Yes, the Fed doesn’t like QE and wants to taper, but seems to me they don’t want mortgage rates this high either. They know the only way the market will ‘bring down rates’ is if the economic weakness persists. And they suspect it very well may persist unless rates come down.
Their remaining option is TIRT (term interest rate targeting) which has yet to be discussed.
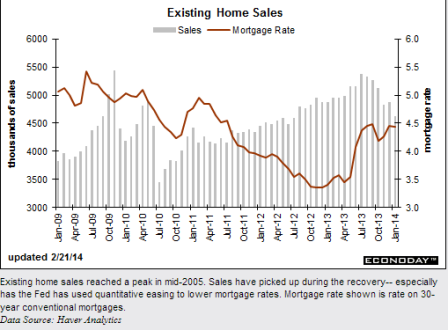
Existing Home Sales
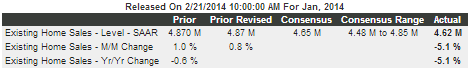
Highlights
It’s more than just weather that’s clobbering the housing market. High prices and tight inventory aren’t helping either as existing home sales fell 5.1 percent in January to a 4.620 million annual rate. The year-on-year rate is also at minus 5.1 percent, a sharp contrast to the year-on-year median price which is up 10.7 percent.
Supply of homes relative to sales did rise to 4.9 months from 4.6 months but the improvement is tied mostly to the drop in sales. Prices did come down in the month but from already high levels with the median price down 4.5 percent to $188,900.
Weather was especially cold in January and no doubt contributed to the sales weakness, especially in the Midwest, where sales fell 7.1 percent in the month, and also the Northeast where the decline was 3.1 percent. But weather in California wasn’t a problem, yet sales in the West fell 7.3 percent which the National Association of Realtors points to as evidence of non-weather constraints.
Unattractive mortgage rates are another factor holding down sales. All cash buyers continue to hold up the market, accounting for 33 percent of all sales vs 32 percent in December. In contrast, first-time buyers, who are especially sensitive to the soft jobs market, continue to account for less sales, at 26 percent vs December’s 27 percent.
This is the 5th decline in the last 6 months for this series and lack of improvement in the jobs market, not to mention this month’s severe bout of heavy weather, point to more trouble for February. For the economy, the housing market needs to snap back sharply this spring. The Dow is showing little initial reaction to today’s report.
 Full size image
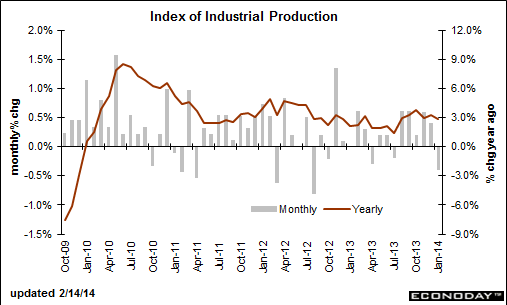
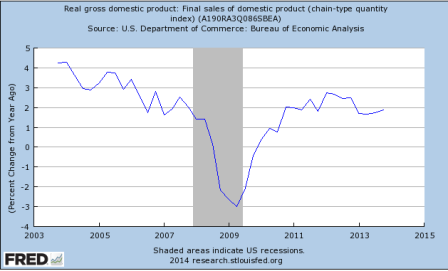
Not exactly gang busters even before the weather reduced incomes.
And the bad weather it’s like hurricane sandy but without the insurance spending and federal relief spending.
 Full size image