Mine starts at about 15 min into the video:
Hong Kong protests, Pettifor on unsustainable debt, Mosler on US problems

Mine starts at about 15 min into the video:
Hong Kong protests, Pettifor on unsustainable debt, Mosler on US problems
Declines in 7 of 20 largest states not good.
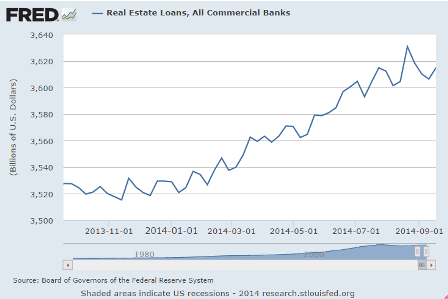
Sure feels to me like this cycle is over:

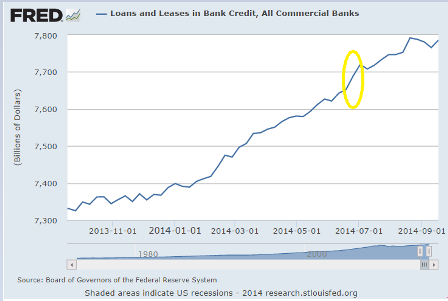
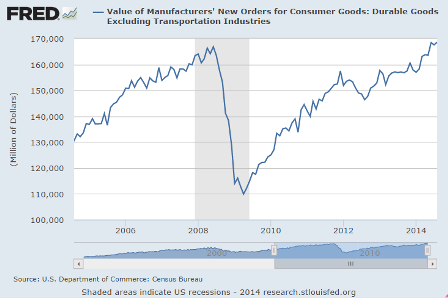
The much hyped acceleration still looks like it’s over.
Acceleration alarm zones circled in yellow:
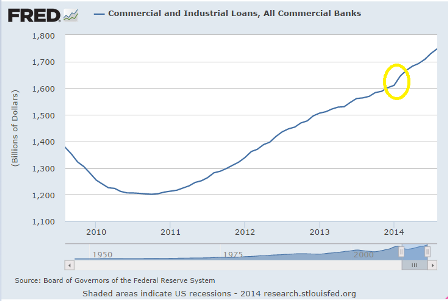

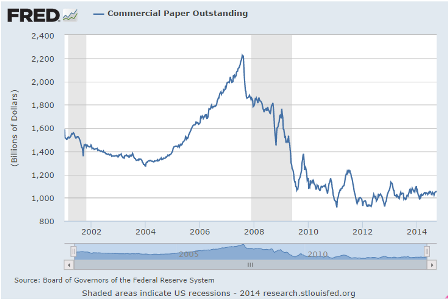
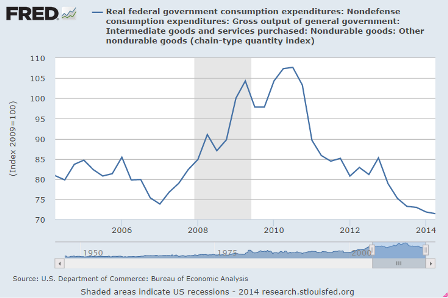
This was a major source of shadow bank funding as well as non financial funding:
Fewer cash buyers and fewer mtg purchase apps also translated into fewer pending home sales:
Pending Home Sales Index
Highlights
The outlook for the used home market remains stubbornly flat, with pending home sales down a disappointing 1.0 percent in August. The Econoday consensus was calling for a 0.8 percent gain. Year-on-year, pending home sales in August were down 2.2 percent which is roughly in line with a 5.3 percent decline for final sales of existing homes in data that were released last week.
A lack of first-time buyers and strong demand for rentals remain key obstacles for home sales. A lack of distressed homes on the market is another negative factor. Mortgage rates for now are still low but are likely to begin to rise as the Fed withdraws stimulus and begins to raise rates, a prospect that points to continued sales weakness ahead.
Regionally, weakness in sales trends for existing homes has been spread evenly with the West lagging slightly. Weakness in today’s report is centered in the Midwest where pending sales fell 2.1 percent for a year-on-year decline of 7.6 percent. The Northeast shows an even steeper 3.0 percent decline in the month though it is the only region with a positive year-on-year rate at plus 1.6 percent. Pending sales rose 2.6 percent in the West though the year-on-year is minus 2.6 percent while the South, which is by far the largest housing region, shows a 1.4 percent decline in the month and no change on the year.
The number of signed contracts to buy existing homes fell 1 percent in August compared to July and is down 2.2 percent from August of 2013, according to the National Association of Realtors
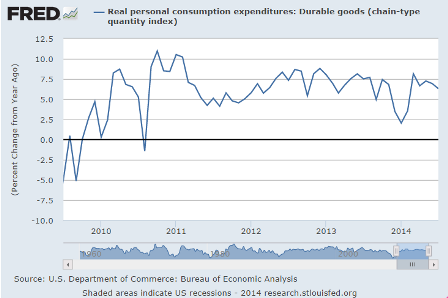
Note that payroll taxes went up Jan 2013, and the sequesters first hit in April, followed by Fed statements that caused mtg rates to gap up about 1% in July or so. We seem to be faltering below the prior 2013 peak and well below prior cycles:

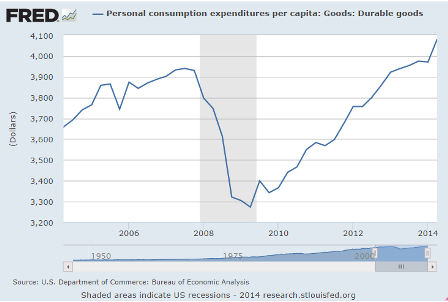
Personal income numbers are not inflation adjusted here:
Highlights
The consumer sector showed improvement in August for both income and spending. Personal income growth posted a 0.3 percent gain in August, following a 0.2 percent rise in July. The latest number matched expectations for a 0.3 percent advance. The wages & salaries component was even stronger with a 0.4 percent boost, following a 0.2 percent increase the month before.
Personal spending jumped 0.5 percent after no change in July. Analysts forecast a 0.5 percent boost. Strength was in the durables component which jumped 1.8 percent after no change in July. August reflected a jump in auto sales. Lower gasoline prices tugged down on nondurables. Nondurable spending declined 0.3 percent after no change in July. Services jumped 0.5 percent in August after being unchanged the month before.
PCE inflation slowed to a monthly no change in August from 0.1 percent in July. The latest figure came in slightly lower than expectations for a 0.1 percent rise. Core PCE inflation posted at 0.1 percent, equaling the pace for July. The median market forecast was for no change.
On a year-ago basis, headline PCE inflation eased to 1.5 percent from 1.6 percent in July. Year-ago core inflation was 1.5 percent in both August and July. Again, PCE inflation remains well the Fed goal of 2 percent but is edging upward.
This is the pre tax personal income:


Weak euro zone lending data underscores need for ECB stimulus
By Eva Taylor
Sept 25 (Reuters) — Lending to euro zone households and companies contracted for the 28th month in a row in August, though at a slower pace, putting a keener spotlight on European Central Bank efforts to get credit flowing again.
Euro zone banks, particularly in the crisis-stricken countries, have tightened up on lending as they adapt to tougher capital requirements and undergo health checks, while companies are holding back on investments, unsure of the future.
The euro zone economy ground to a halt in the second quarter and with inflation in what ECB President Mario Draghi has called the “danger zone” below 1 percent for almost a year now, the ECB saw the need to add new stimulus steps in June and September.
The ECB has now started to offer banks four-year loans at ultra-cheap rates and plans to buy asset-backed securities and covered bonds from October to lighten the weight on banks’ balance sheets and entice them to lend.
But economists in a Reuters poll are skeptical about whether the plan will work, saying bank lending to private euro zone businesses needed to grow at a 3-percent annual rate on a sustained basis to stir inflation.
August lending rates are nowhere near such levels.
In August, loans to the private sector continued to fall, down 1.5 percent from the same month a year earlier after a contraction of 1.6 percent in July, ECB data showed on Thursday. Private sector loans have not grown since April 2012.
“It remains questionable as to how much all the liquidity measures announced by the ECB will encourage banks to lift their lending,” IHS Global Insight economist Howard Archer said.
“…it is also questionable how much businesses’ demand for credit will pick up while the economic and political outlook looks so uncertain,” he said.
WEAK LENDING IN IRELAND
Draghi told Lithuanian business daily Verslo Zinios in an interview published on Thursday a continued weakness in credit growth was likely to curb the euro zone recovery.
Euro zone companies rely mainly on bank funding rather than capital markets, which is why it is so crucial to fix lingering problems in the sector.
For that purpose, the ECB is putting the bloc’s top banks through a thorough review of their balance sheets to weed out bad loans, update collateral valuations and adjust capital.
The picture varies across the euro zone. While lending to companies in Ireland fell at an annual rate of 11.8 percent in August – the fastest decline in three years – and 8.8 percent in Spain, it rose in Finland, Germany and France.
Euro zone M3 money supply – a more general measure of cash in the economy – grew at an annual pace of 2.0 percent in August, up from 1.8 percent in July.
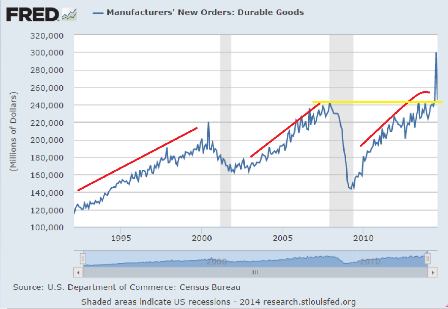
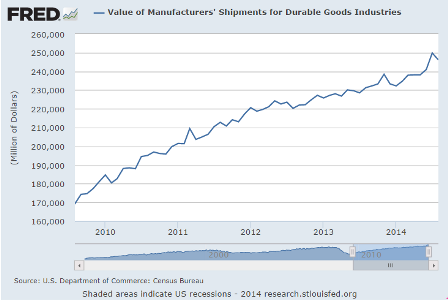
Durable Goods Orders
Highlights
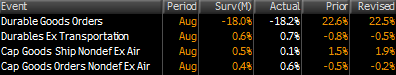
Durables orders fell back in August, coming off July’s surge in aircraft orders. But the core was healthy in August. New factory orders for durables dropped a monthly 18.2 percent, following a spike of 22.5 percent in July. Market expectations were for a 17.1 percent fall. Transportation fell a monthly 42.0 percent in August, following a 73.3 percent jump the month before.
Excluding transportation, durables orders rebounded 0.7 percent, following a decline of 0.5 percent in July. Analysts projected a 0.8 percent gain for August.
Within transportation, nondefense aircraft fell a monthly 74.3 percent, following a 315.6 percent spike in July with both swings essentially reflecting Boeing aircraft orders. Defense aircraft orders slipped 0.6 percent, following a 31.7 percent drop in July. Motor vehicle orders have been moderately volatile but healthy on average, decreasing 6.4 percent after a 10.0 percent boost the prior month.
Outside of transportation, major industries seeing a gain in the latest month were fabricated metals, machinery, computers & electronics, electrical equipment, and “other.” Declines were posted for primary metals.
Orders for equipment investment made a healthy comeback in August. Nondefense capital goods orders excluding aircraft rebounded 0.6 percent in August, following a dip of 0.2 percent the month before. Shipments of this series edged up 0.1 percent but followed a strong 1.9 percent gain in July.
Recent durables orders have shown record volatility. On average, durables orders point to moderate upward momentum in manufacturing.
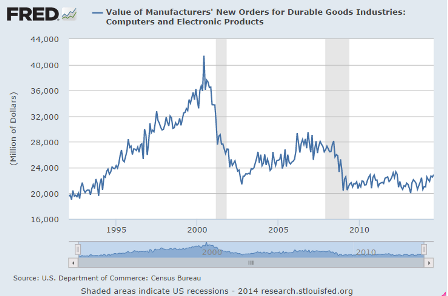
The yellow line is to show that actual orders have just gotten back to pre recession levels, and that’s not inflation adjusted, so in real terms they haven’t yet caught up.
The red lines are roughly the ‘slope’ which is a proxy for the rate of growth, but it should get ever steeper on this arithmetic chart to indicate the same rate of growth. So the growth rate in this cycle is slowing. And also seems last time around we went into recession before this indicator turned south, while the cycle before that it turned down before we went into recession.
MBA Purchase Applications
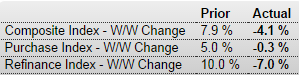
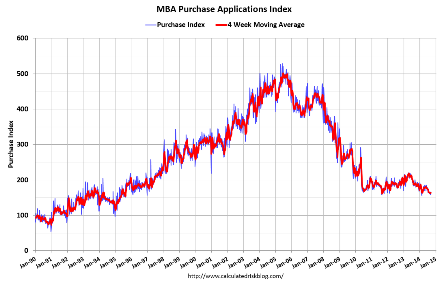
In any case it’s still very low, and with both mortgage purchase apps down and cash buyers down total housing sales are unlikely to rise.
Also note new home sales are booked at signing, while existing home sales are booked at closing, so these are sales that will hopefully close about 90 days from now:
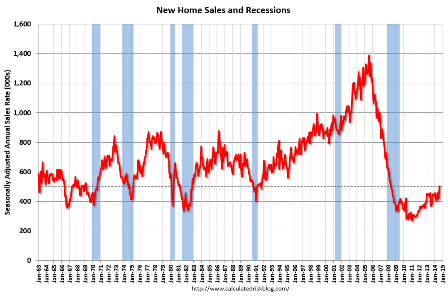
New Home Sales
Highlights
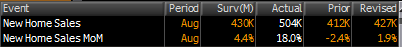
In a report that is frequently volatile, new home sales surged 18.0 percent in August to a much higher-than-expected annual rate of 504,000. To underscore the volatility, the high-end Econoday forecast was 465,000!
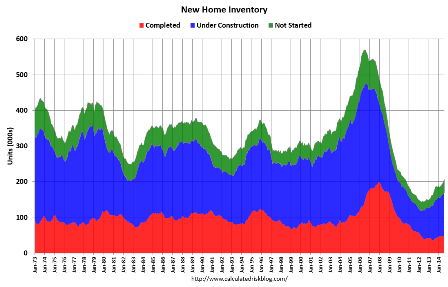
Low supply has been a stubborn problem holding down both sales of new homes and existing homes, and the surge in August sales has made this problem more pronounced. Supply of new homes at the current sales rate fell in August to 4.6 months from 5.6 months in the prior month. Builders will likely be scrambling to bring new homes onto the market which in August totaled 203,000 units vs 201,000 in July.
Prices may no longer be holding down sales, falling 1.6 percent on the median in the month to $275,600. Year-on-year, the median was up 8.0 percent in August which sounds high but not against the 33.0 percent gain in sales.
Looking regionally at sales, sales surged 50.0 percent in the West followed by a 29.2 percent gain in the East. In the South, where more new homes are sold than all other regions combined, sales rose 7.8 percent.
This report is a reminder of the home builders’ housing market index where the traffic component, which had been lagging badly, is suddenly surging. But whether the strength in today’s report can be extended and whether August’s gain will be revised downward are uncertain. Note that revisions to this series are often as volatile as any single month’s headline.
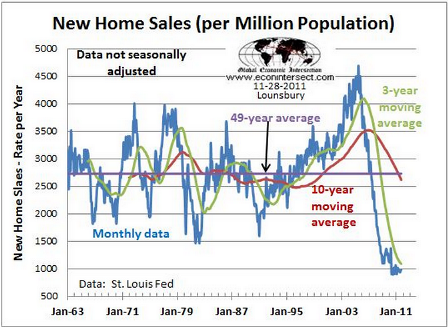
Sales were up but remain at historically low levels:
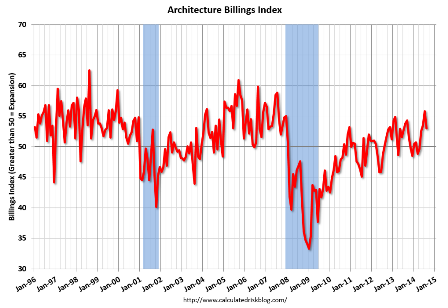
U.S. Architecture Billings Index falls in August
Sept 24 (Reuters) — The Architecture Billings Index, an indicator of U.S. non-residential building activity, fell slightly in August, after hitting a seven-year high the previous month.
The ABI stood at 53.0 in August, down from 55.8 in July, the American Institute of Architects said on Wednesday.
The index, based on a survey of U.S. architects, reflects the roughly nine to 12 months between architecture billings andconstruction spending.
A reading above 50 indicates an increase in billings.
The new projects inquiry index was 62.6, following a very strong mark of 66.0 the previous month.
Full size image