- MBA Mortgage Applications (Released 7:00 EST)
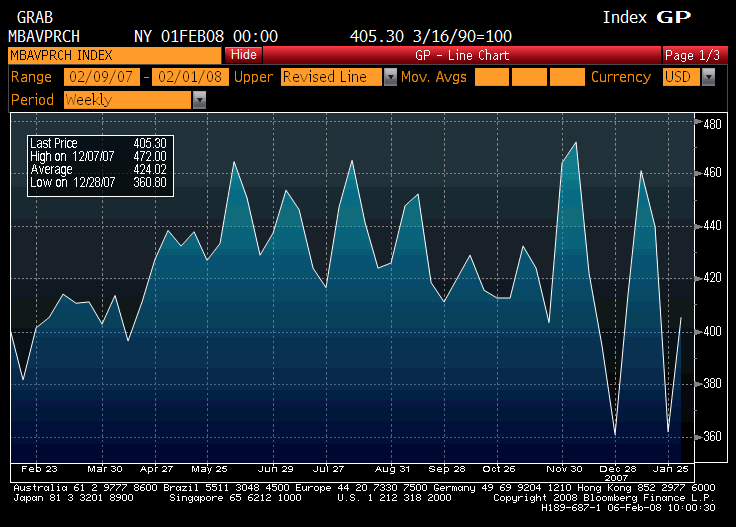
- MBA Purchasing Applications (Released 7:00 EST)
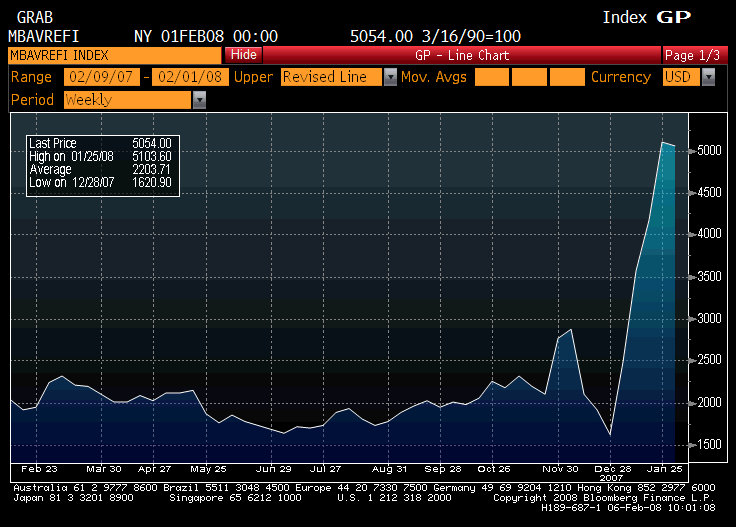
- MBA Refinancing Applications (Released 7:00 EST)
- Durable Goods Orders (Released 8:30 EST)
- Durable Goods Orders YoY (Released 8:30 EST)
- Durables Ex Transportation MoM (Released 8:30 EST)
- Durables Ex Defense MoM (Released 8:30 EST)
- Durable Goods ALLX (Released 8:30 EST)
- Personal Income MoM (Released 8:30 EST)
- Personal Income YoY (Released 8:30 EST)
- Personal Income ALLX (Released 8:30 EST)
- Personal Consumption MoM (Released 8:30 EST)
- Personal Consumption YoY (Released 8:30 EST)
- PCE Deflator YoY (Released 8:30 EST)
- PCE Core MoM (Released 8:30 EST)
- PCE Core YoY (Released 8:30 EST)
- Initial Jobless Claims (Released 8:30 EST)
- Continuing Claims (Released 8:30 EST)
- Jobless Claims ALLX (Released 8:30 EST)
- Univ. of Michigan Confidence (Released 10:00 EST)
- New Home Sales (Released 10:00 EST)
- New Home Sales Total for Sale (Released 10:00 EST)
- New Home Sales MoM (Released 10:00 EST)
- New Home Sales YoY (Released 10:00 EST)
- New Home Sales Median Price (Released 10:00 EST)
- New Home Sales TABLE 1 (Released 10:00 EST)
- New Home Sales TABLE 2 (Released 10:00 EST)
Karim writes:
Lots of numbers today- none of them real good.


MBA Mortgage Applications (Nov 21)
| Survey | n/a |
| Actual | 1.5% |
| Prior | -6.2% |
| Revised | -6.2% |

MBA Purchasing Applications (Nov 21)
| Survey | n/a |
| Actual | 261.60 |
| Prior | 248.50 |
| Revised | n/a |
Up a bit from very low levels.

MBA Refinancing Applications (Nov 21)
| Survey | n/a |
| Actual | 1254.00 |
| Prior | 1281.20 |
| Revised | n/a |

Durable Goods Orders (Oct)
| Survey | -3.0% |
| Actual | -6.2% |
| Prior | 0.8% |
| Revised | -0.2% |
Big fall.
Karim writes:
- -6.2% m/m
- -4% m/m ex-aircraft and defense (after -3.2% and -2.3% prior two months)

Durable Goods Orders YoY (Oct)
| Survey | n/a |
| Actual | -11.7% |
| Prior | -2.5% |
| Revised | n/a |
Big fall in a longer term down trend.
![]()
Durables Ex Transportation MoM (Oct)
| Survey | -1.6% |
| Actual | -4.4% |
| Prior | -1.1% |
| Revised | -2.3% |
Not good either.

Durables Ex Defense MoM (Oct)
| Survey | n/a |
| Actual | -4.6% |
| Prior | -1.8% |
| Revised | n/a |

Durable Goods ALLX (Oct)

Personal Income MoM (Oct)
| Survey | 0.1% |
| Actual | 0.3% |
| Prior | 0.2% |
| Revised | 0.1% |
Income has held up better than expected.
And the consumer has deleveraged substantially.

Personal Income YoY (Oct)
| Survey | n/a |
| Actual | 3.3% |
| Prior | 3.2% |
| Revised | n/a |
Looking lower.
Will get a nice kick up with the coming fiscal adjustment.

Personal Income ALLX (Oct)

Personal Consumption MoM (Oct)
| Survey | -1.0% |
| Actual | -1.0% |
| Prior | -0.3% |
| Revised | n/a |
Consumption falling even as income continues to increase.
The consumer is recharging his batteries.

Personal Consumption YoY (Oct)
| Survey | n/a |
| Actual | 2.3% |
| Prior | 3.5% |
| Revised | n/a |

PCE Deflator YoY (Oct)
| Survey | 3.3% |
| Actual | 3.2% |
| Prior | 4.2% |
| Revised | 4.1% |
Down some and more weak numbers to come, but the longer term trend still looks up.

PCE Core MoM (Oct)
| Survey | 0.0% |
| Actual | 0.0% |
| Prior | 0.2% |
| Revised | n/a |

PCE Core YoY (Oct)
| Survey | 2.2% |
| Actual | 2.1% |
| Prior | 2.4% |
| Revised | 2.3% |
Higher than expected but down some, and more weak numbers on the way, but still at the high end of the Fed’s comfort zone.

Initial Jobless Claims (Nov 22)
| Survey | 535K |
| Actual | 529K |
| Prior | 542K |
| Revised | 543K |
Remains very high.
Karim writes:
- Initial claims only decline 14k to 529k after 80k rise in prior 4 weeks
- Similar bounce with continuing, drop of 54k to 3962k (had risen 295k in prior 3 weeks)

Continuing Claims (Nov 15)
| Survey | 4080K |
| Actual | 3962K |
| Prior | 4012K |
| Revised | 4016K |
Off the highs but remain very high.

Jobless Claims ALLX (Nov 22)

Univ. of Michigan Confidence (Nov F)
| Survey | 57.5 |
| Actual | 55.3 |
| Prior | 57.9 |
| Revised | n/a |
Back through the lows.
Karim writes:
- New low for headline confidence, from 57.9 to 55.3
- 5yr fwd inflation expectations unchanged at 2.9

New Home Sales (Oct)
| Survey | 441K |
| Actual | 433K |
| Prior | 464K |
| Revised | 457K |
Still sliding.
Karim writes:
- -5% m/m
- Mths supply rise from 10.9 to 11.1

New Home Sales Total for Sale (Oct)
| Survey | n/a |
| Actual | 381.00 |
| Prior | 414.00 |
| Revised | n/a |
Maybe this is why sales are falling- no new homes left for sale!
Falling sharply.

New Home Sales MoM (Oct)
| Survey | -5.0% |
| Actual | -5.3% |
| Prior | 2.7% |
| Revised | 0.7% |

New Home Sales YoY (Oct)
| Survey | n/a |
| Actual | -40.1% |
| Prior | -34.1% |
| Revised | n/a |
Might be leveling off at very low levels.

New Home Sales Median Price (Oct)
| Survey | n/a |
| Actual | 218.00 |
| Prior | 221.70 |
| Revised | n/a |
Prices falling but not collapsing.

New Home Sales TABLE 1 (Oct)

New Home Sales TABLE 2 (Oct)
[top]