Bloomberg: Apartment vacancy unchanged, rents rise

The drop in housing starts may be keeping the rental market tight, as about a 80,000 fewer new units are being built each month.

U.S. Apartment Vacancy Unchanged at 5.9 Percent, Rents Increase

(Bloomberg) The vacancy rate for U.S. rental apartment buildings was unchanged at 5.9 percent in the second quarter as the housing slump and a weakening economy deterred people from buying homes, Reis Inc. reported.

The average monthly U.S. asking rent rose 1 percent to $1,047, the 25th consecutive quarter that rents increased or stayed the same, according to Reis, a New York-based research firm.

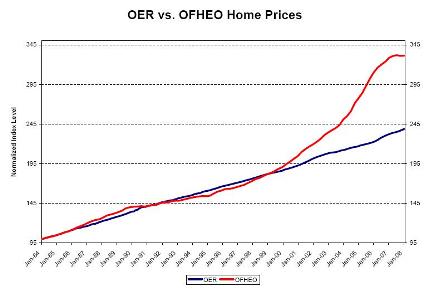
Home prices in 20 U.S. metropolitan areas declined in April by the most on record and new home sales fell 40 percent in May from a year ago. The slumping housing market means apartment rents should remain steady even as gasoline prices rise and U.S. companies cut jobs, Sam Chandan, chief economist for Reis, said in an interview. Payrolls fell by 62,000 in June and 438,000 in the first half, the Labor Department said July 3.

“Our projection is rent growth will moderate through 2009, but we don’t think it will turn negative as it did in the early 2000s,” Chandan said. “The bias will be weighted toward rental, in our view. People fear home prices will fall further.”

The last time U.S. rents fell was the first quarter of 2002, when they declined by 0.2 percent, according to Reis.

The five-year housing boom that ended in 2006 attracted investment to homebuilding, so fewer apartment buildings were constructed, Chandan said.

“There has been very little apartment development because all the money was made in housing development,” he said. “We don’t have a strong pipeline of apartments.”

San Francisco
San Francisco asking rents grew the most in the second quarter from the previous 12 months, increasing 9.4 percent. New York gained 7.7 percent, Seattle rose 7.4 percent, San Jose, California increased 7.3 percent and Salt Lake City increased 6.1 percent, according to Reis.

New York had the highest average U.S. rent at $2,847 a month, followed by San Francisco at $1,825, Fairfield County, Connecticut at $1,757, Boston at $1,646 and Long Island, New York at $1,521, Reis said.

Orange County, California, ranked sixth at $1,520, followed by San Jose at $1,504, Northern New Jersey at $1,460, Ventura County, California at $1,409 and Los Angeles at $1,408, according to Reis.

New York had the lowest vacancy rate at 2.2 percent, followed by Long Island at 2.9 percent, Central New Jersey at 3 percent, San Jose at 3.2 percent and New Haven, Connecticut at 3.3 percent, Northern New Jersey at 3.5 percent, Syracuse, New York at 3.6 percent, San Diego and San Francisco at 3.8 percent and Minneapolis at 3.0 percent, Reis said.

Re: Alt A downgrades


[Skip to the end]

(An email exchange)

On Wed, Jun 4, 2008 at 12:57 AM, Eric wrote:
>     I guess you have seen this article.
>
>      Primes going down too.
>
>
>      More generally look at the attached graphs, they suggest that IOs and other
>      exotic mortgage are clearly a major cause of the problems, independently of
>      the quality of the loans. I think there is here a pretty good argument to make
>      that non-fixed mortgages, and more especially exotic mortgage have structural
>      characteristics that make them prone to speculative and ponzi structure. The
>      borrowers expect to be able to refinance at one point once interest rate reset or
>      the principal become due. Warren you were saying that proof of ability to pay
>     “libor plus 3 or whatever” was necessary to qualify. This margin of safety
>      (expected ability to pay libor +3 even though now borrower pay only teaser rate)
>      may have been destroyed in several ways.
>
>      – the interest rate may have reset at a higher rate than libor + 3, so that people
>      cannot afford the mortgage anymore.
>
>      – ARMs reinforce the probability of the previous effect, especially when libor when
>      up sky high after the crisis
>
>     – Income of borrowers felt short of expectations, expecially with the economic
>     slowdown (here fiscal policy is clearly a big player)
>
>     – The margin of safety thinned. Maybe previously they had to prove libor + 5 but
>     progressively borrower only had to prove libor + 4 then libor + 3. This would qualify
>      more borrowers and make the deal more sensitive to shock in product and financial
>      markets
>
>      In all this case the affordability of the mortgage is questioned Þ need to refinance Þ
>      if not available then sell the house (short sale or foreclosure). Fixed-rate mortgage
>      eliminate three of the previous reason (only income expectations is a problem).
>
>      Éric

agreed with all.

add to that food and energy prices taking income from home mtg payments, which could be the larger short term effect.

the fed has been taking some heat for this under the theory that the low rates have hurt the $ and thereby hurt the financial sector via the above channel, rather than helped the financial sector via lower rates ‘easing’ conditions via the lower payments channel.

the fed has argued this isn’t the case, insisting the lower rates have helped more than hurt.

also, the fiscal package could soften some of the delinquency increases for a few months.


[top]

Data Review

thanks, a few quips below:

Karim writes:

  • Conference Board survey falls from 62.8 to 57.2 (lowest since 1992)
  • Both present situation and expectations decline

Labor conditions, plans to buy home and plans to buy auto all fall to new cycle lows

Tough living in an export economy.

  • 1yr inflation expectations jump from 6.8 to 7.7

Inflation rips as non-residents outbid us for your output, as all our funds are spent on food and fuel.

  • Case Shiller Home price index accelerates rate of decline, down 6.7% q/q and 14.1% y/y

Narrow index of 20 metro regions, with 4 or 5 biggest spec boom/bust regions doing most of the damage.

  • New home sales rise 3.3% in April; mths inventories fall from 11.1 to 10.6

Coming back from unsustainably low levels give the US population and income growth.

Actual homes in inventory fell to the lowest levels since July.

  • Jan-March sales data revised lower by cumulative 5.5%

Tough first quarter with record low consumer sediment :) behind us.

Bloomberg: New-Home Sales in the U.S. Rose 3.3% to 526,000 Pace

Looking more like a bottom with every report. And most housing reports are ‘fighting’ some strong seasonals in the spring.

by Shobhana Chandra

(Bloomberg) New-home sales in the U.S. unexpectedly rose in April after readings for the prior month were revised down, signaling a worsening housing slump is still a threat to the economy.

Sales increased 3.3 percent to an annual pace of 526,000 from a 509,000 rate the prior month that was the lowest in 17 years, the Commerce Department said today in Washington. A separate report today showed home prices dropped in the first quarter by the most in at least 20 years.

A separate report today showed confidence among American consumers fell to the lowest level since October 1992 this month, raising the risk that households will rein in spending. The Conference Board’s confidence index declined more than forecast to 57.2.

They already have reined it in. That´s what an export economy looks like!

Economists’ Forecasts
Economists forecast new home sales would drop to a 520,000 annual pace from an originally reported 526,000 rate the prior month, according to the median estimate in a Bloomberg survey of 70 economists. Forecasts ranged from 500,000 to 570,000.

Purchases in April were the second lowest since October 1991. The March reading became the weakest since April 1991.

The median sales price last month increased 1.5 percent from April 2007 to $246,100. The figures can be influenced by changes in the mix of sales at the regional level. For that reason, economists prefer price measures that track the same house over time.

They never added that type of comment when prices fell. Still a lot of biased reporting out there.

One such gauge is the S&P/Case-Shiller index. Those figures, also reported today, showed house prices dropped 14.1 in the first quarter compared with the same period in 2007, the biggest decline since records began in 1988.

Much narrower market and different months

Sales of new homes were down 42 percent from April 2007, the biggest year-over-year decline since September 1981, the Commerce report showed.

Better to be 10 miles from hel_ and moving away from it than 100 miles away moving towards it.

Drop in Inventories
One bright spot is that inventories decreased. The supply of homes at the current sales rate dropped to 10.6 months’ worth from 11.1 months in March. The number of homes completed and waiting to be sold decreased to 181,000, the fewest since July.

Shortages looming as suggested in prior emails.

Purchases rose in three of four regions, led by a 42 percent jump in the Northeast. They increased 8.3 percent in the West and 5.8 percent in the Midwest. Purchases dropped 2.4 percent in the South.

Sales of previously owned homes, which account for about 85 percent of the market, fell 1 percent in April, and the supply of unsold properties reached a record, the National Association of Realtors said last week.

New-home purchases, which make up the remaining 15 percent of the market, are considered a timelier indicator because they are based on contract signings. Resales are calculated when a contract closes, usually a month or two later.

AP: California home sales up big

Just annecdotal, but guaranteed that if they were down that much it would be all over the news:

Home sales in California jump nearly 27 percent

by Jordan Robertson

SAN JOSE, Calif. (AP) – Home sales in California jumped nearly 27 percent from March to April as bargain hunters found it easier to get loans and pick up property on the cheap.

DataQuick Information Systems released statewide numbers Tuesday, after reporting similarly positive figures for the San Francisco Bay area, which saw a nearly 29 percent jump during the same period.

But home prices continue to drop around California, a sign that home owners are still finding it hard to unload their properties without steep discounts.
The median price paid for a home last month was $353,000 — down 1.1 percent from the month before and down nearly 27 percent from the year-ago period.

A total of 31,150 new and resale houses and condos were sold statewide last month.

Associated Press: Forclosures FALL 4% in February

Note the fact that foreclosures went down a tad in February versus January is buried at the end of the article.

Number of US homes facing foreclosure jumps nearly 60 percent in February

by Alex Veiga

(AP) Nearly 60 percent more U.S. homes faced foreclosure in February than in the same month last year, with Nevada, California and Florida showing the highest foreclosure rates, a research firm said Wednesday.

AP


A total of 223,651 homes across the nation received at least one notice from lenders last month related to overdue payments, up 59.8 percent from 139,922 a year earlier, according to Irvine, Calif.-based RealtyTrac.

Nearly half of the homes on the most recent list had slipped into default for the first time.

Nevada had the nation’s highest foreclosure rate, with one in every 165 households receiving at least one foreclosure-related notice. It had 6,167 properties facing foreclosure, a 68 percent increase from a year earlier and up 1 percent from January, RealtyTrac said.

Most of the troubled properties were located in California, Florida, Texas, Michigan and Ohio — states where home prices have plunged as the housing boom went bust.

The overall U.S. foreclosure rate last month was one filing for every 557 homes.

February’s total represents a 4 percent dip from January, but the decline was just a seasonal blip, said Rick Sharga, RealtyTrac’s vice president of marketing.

“We seem to be settling in at a new plateau in terms of monthly activity, but it’s a much higher plateau than we were at a year ago,” he said.

CNBC: home buyers have an incentive to delay

You can save about 100 bps by waiting for the extended limits for jumbos to kick in:

Hurdles for Jumbo Borrowers

by Jennifer Woods

For starters, if you’re looking in certain high-cost metropolitan areas such as New York, Los Angeles, Boston or San Francisco, you may want to sit tight for a few weeks.

That’s because a measure in the fiscal stimulus package recently signed into law by President Bush that will temporarily change the guidelines on what constitutes a jumbo mortgage.

As it stands, mortgages above $417,000 on single-family homes are considered “jumbo” , or non-conforming, in that they are not backed by federal mortgage entities, and carry higher rates than conforming mortgages which are below $417,000.

The new bill, however, allows that amount to be bumped up — in some areas to as much as about $729,750. The actual guidelines were set March 6 by the Department of Housing and Urban Development.

“It makes huge sense to wait [for the guidelines to be determined] said Fenton Soliz, president and chief executive of Mortgage Experts. “You might qualify for substantially more money at a lower rate,” he said.

The current average for a 30-year fixed mortgage is 5.90 percent, compared to 6.88 percent for a 30-year fixed jumbo mortgage.