Personal income and spending, GDP, Trump meeting, North Korea tests

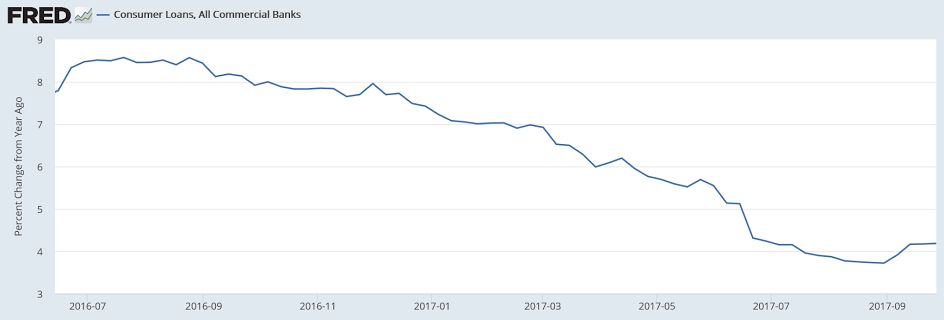
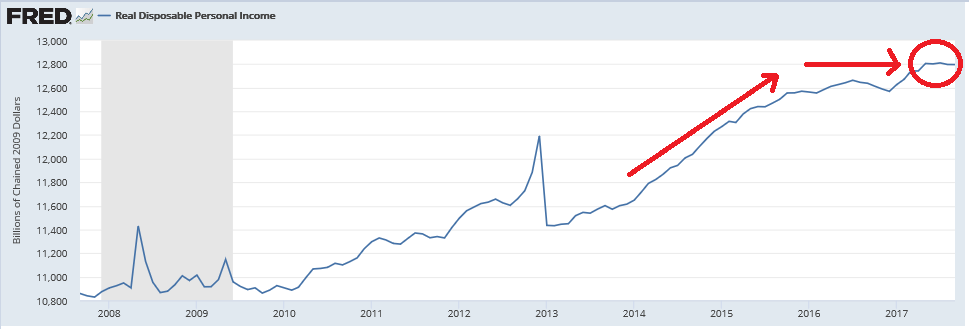
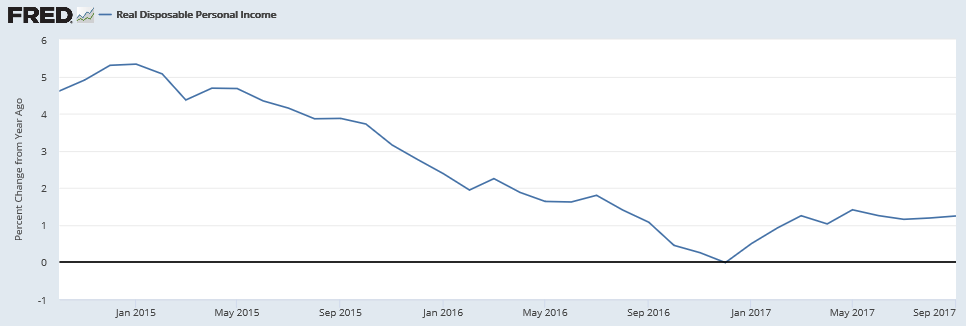
Personal income growth continues to be depressed, which tends to keep spending down as well over time, though this month it had a nice one time increase due to the hurricanes, and the drop in the personal savings rate tells me it’s entirely unsustainable. Also the low inflation readings also support the notion of a general lack of aggregate demand:
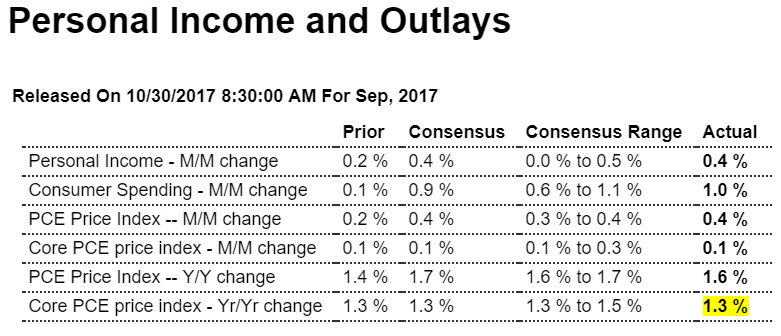
Highlights

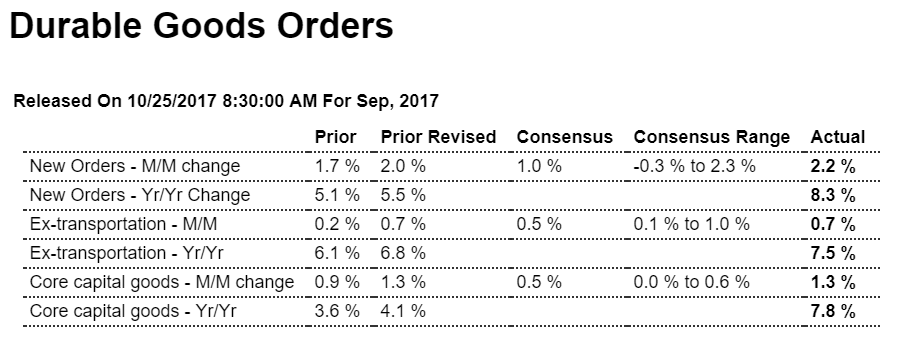
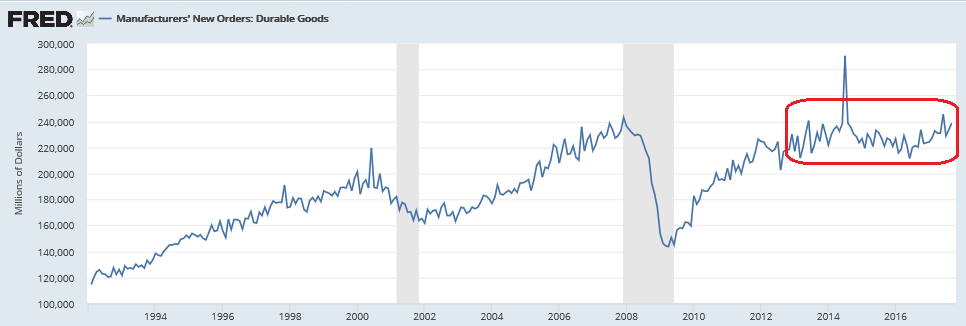
Core inflation remains lifeless in an unwanted highlight of an otherwise solid income and spending report. Personal income rose 0.4 percent in September and was underpinned by wages & salaries which also rose 0.4 percent. Consumer spending jumped 1.0 percent driven by a 2.1 percent surge in durable goods that was tied to vehicle replacement following Hurricanes Harvey and Irma.

But the rise in income and spending didn’t heat up ex-food ex-gas core inflation which posted a marginal 0.1 percent gain. This is the 5th straight 0.1 percent gain for this key reading. The core’s year-on-year rate has been stuck at a rock bottom 1.3 percent for the last two months. Total inflation, reflecting a hurricane-related gain for energy prices, rose 0.4 percent with this year-on-year rate rising 2 tenths to 1.6 percent.

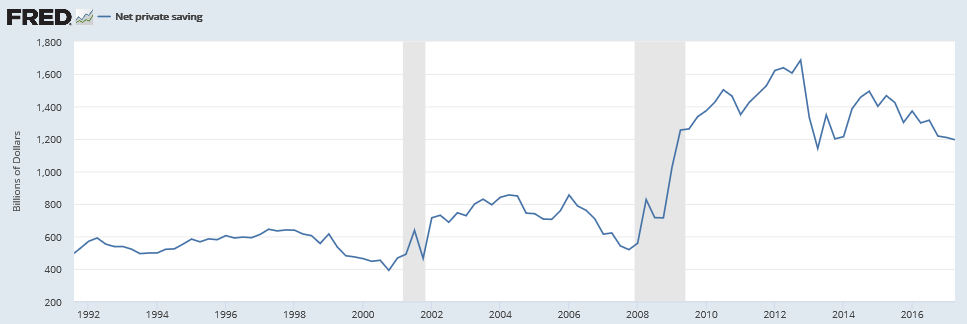
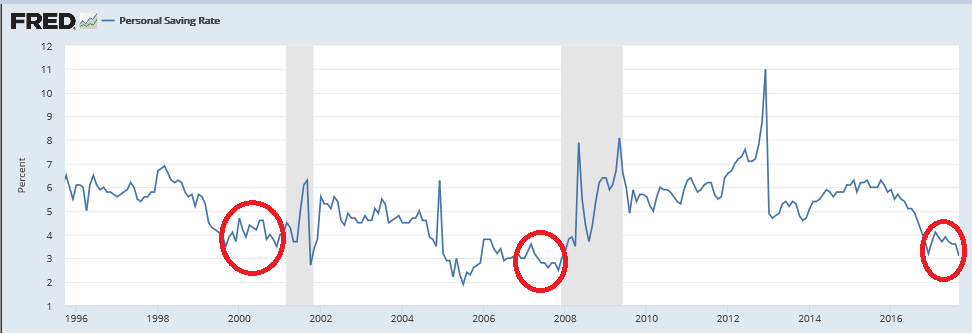
But the pressure on energy prices has already faded and unless wage pressures can extend their emerging gains, inflation readings are not going to be climbing in the direction of the Federal Reserve 2 percent goal. Also helping spending in September was a sharp 5 tenths decline in the savings rate to 3.1 percent and a 10-year low in what, however, is likely to be another hurricane effect that will be quickly reversed.

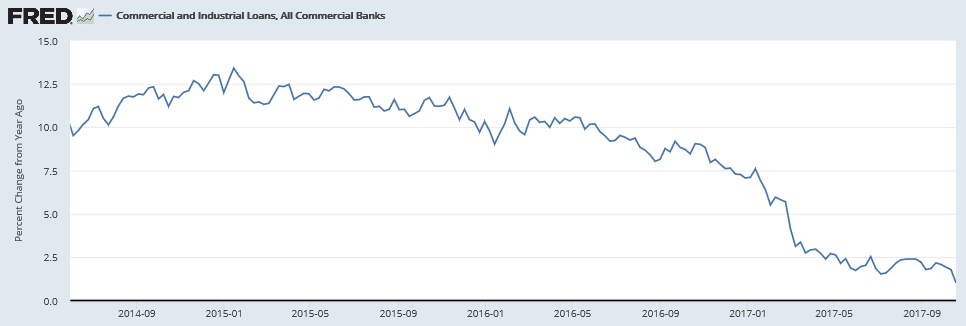
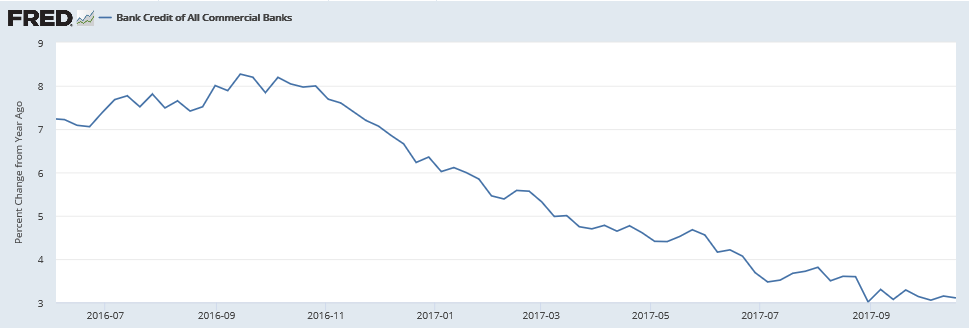
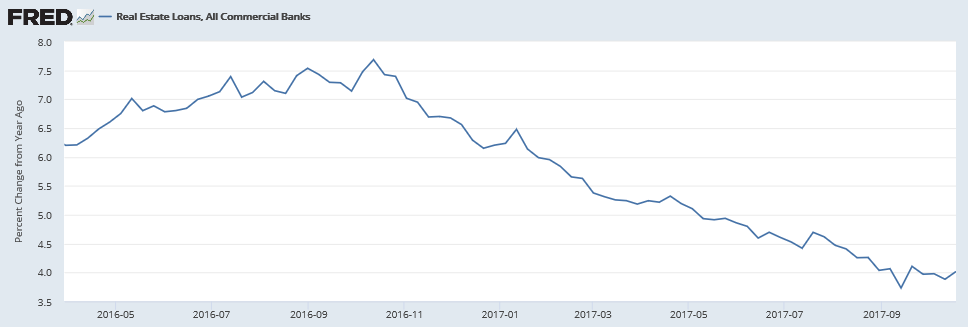
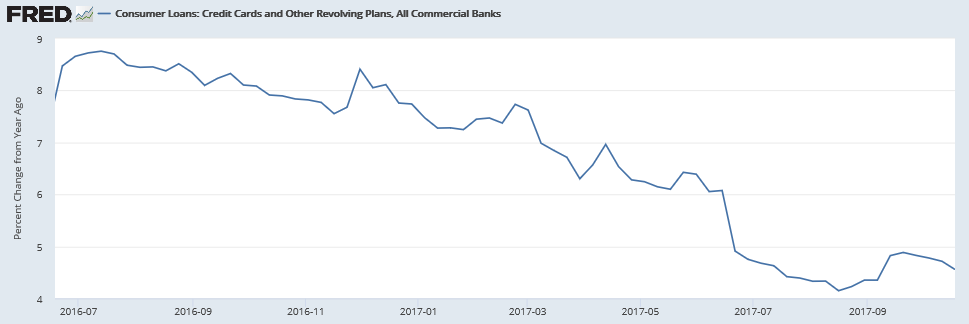
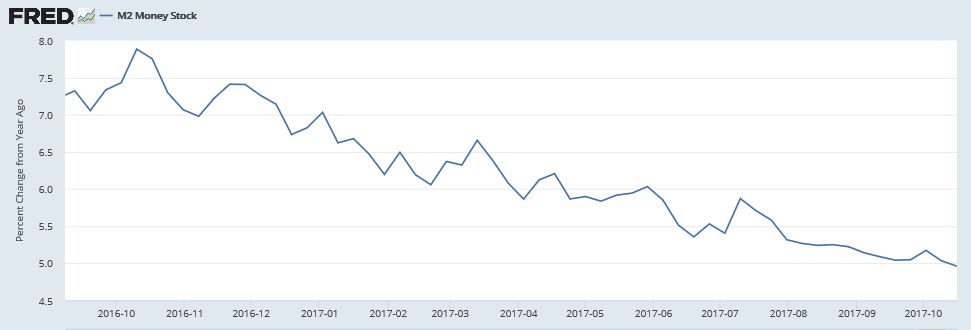
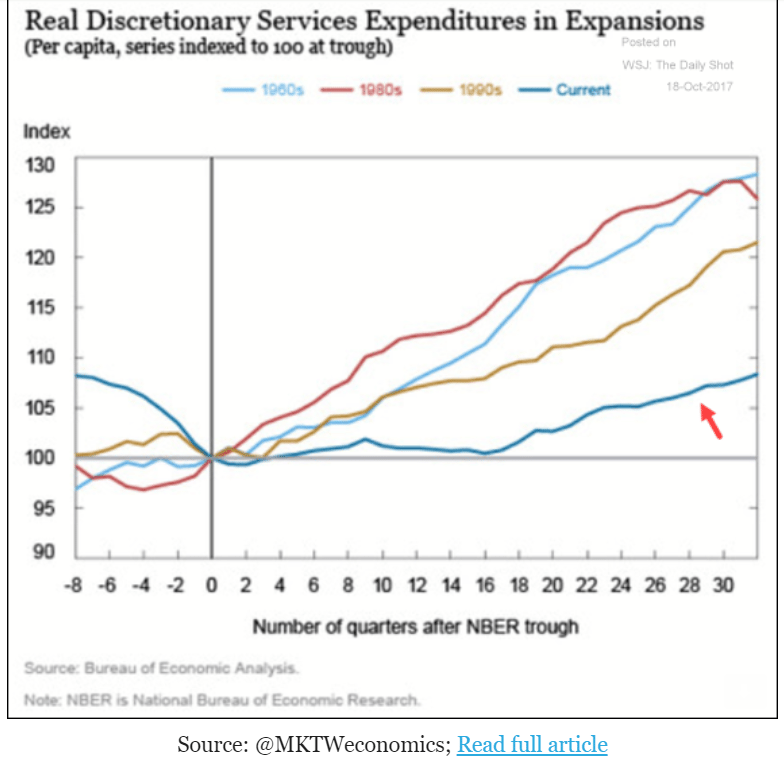
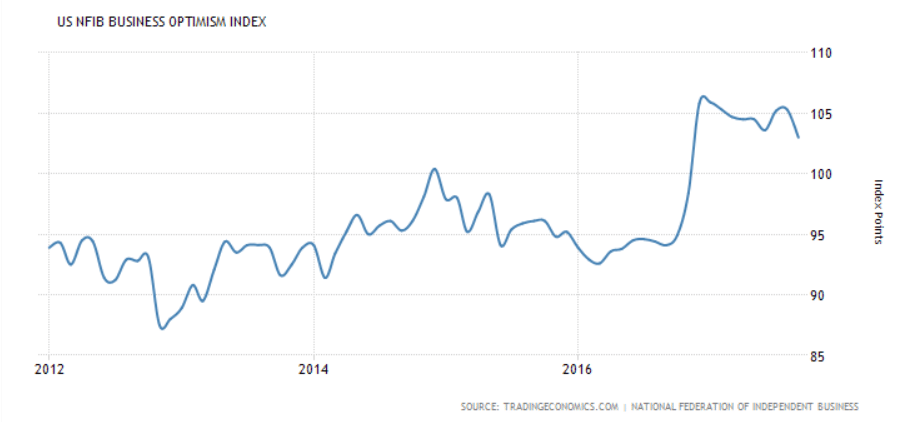
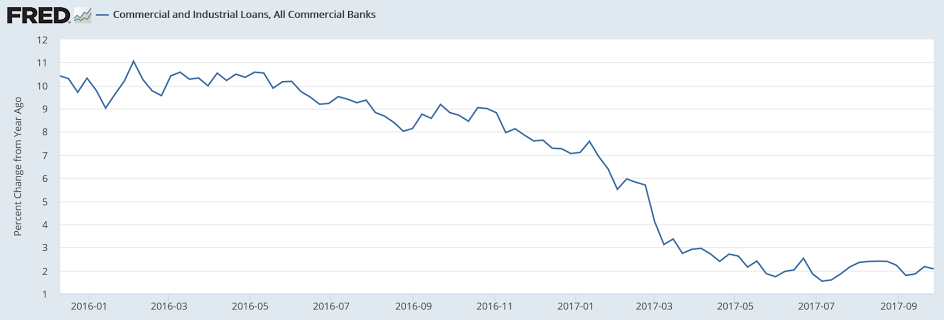
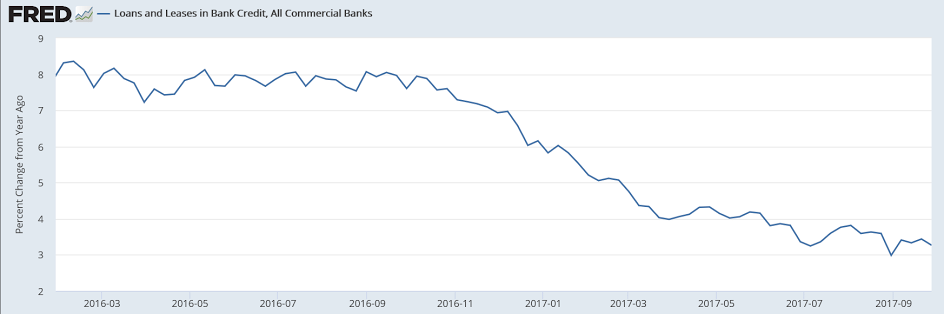
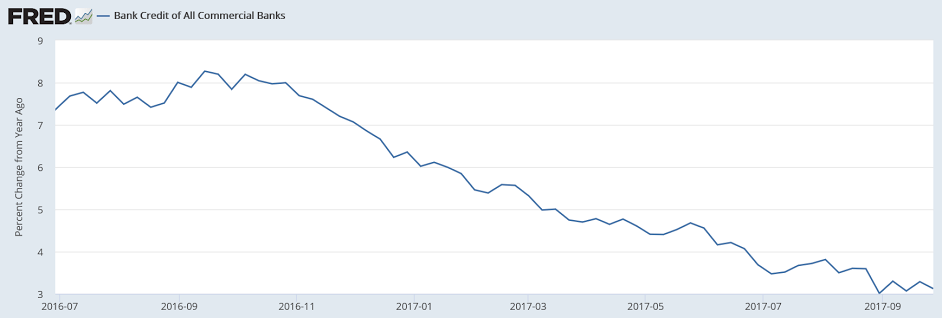
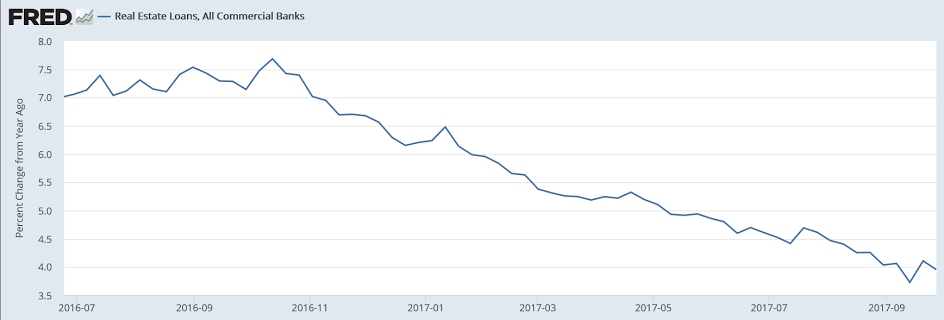
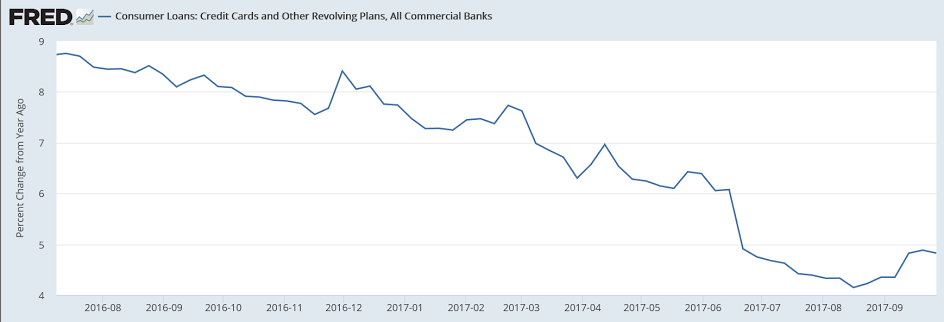
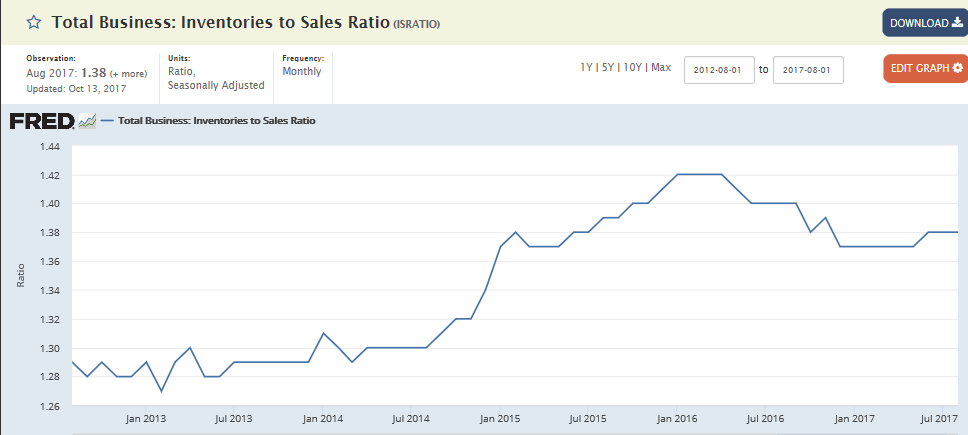
For me, the numbers still don’t ‘add up’. Yes, subtracting inventories, trade, etc. bring the number down closer to 2%, but that’s still at odds with the bank lending reports, depressed personal income, decelerating employment, and the large drop in the personal savings rate. I suspect something has to give, and very soon, and most likely a further and larger drop in consumption:

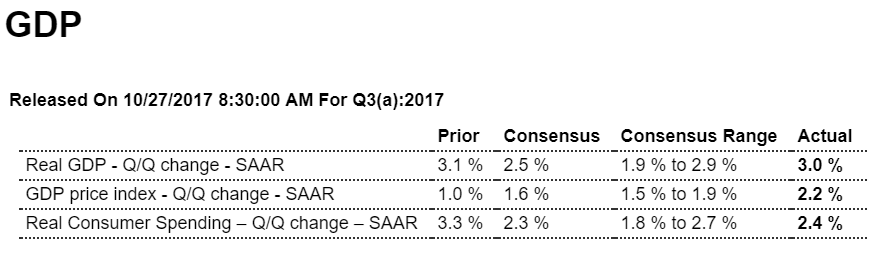
The changes from the prior quarter reflect a general weakening of consumer and commercial spending growth, nearly offset by increased inventories and reduced imports. The contribution from consumer spending on goods dropped -0.24%, while the contribution from spending on services dropped -0.38% (a combined -0.62%). The inventory contribution became significant, at +0.73%, roughly a quarter of the entire growth. The contribution from fixed commercial investment was halved to +0.25% (from +0.53%). Governmental spending remained in a very minor contraction (-0.02%). The contribution from exports dropped -0.14% to +0.28%, while the contribution from imports turned positive, at +0.12%.

The BEA’s “bottom line” (their “Real Final Sales of Domestic Product”, which excludes inventories) decreased to +2.25%, down -0.69% from the prior quarter.

Real annualized household disposable income dropped -$19 to $39,280 (in 2009 dollars). The household savings rate also dropped -0.4% to 3.4%, the lowest level since the fourth quarter of 2007.

For this revision the BEA assumed an effective annualized deflator of 2.16%. During the same quarter (July 2017 through September 2017) the inflation recorded by the Bureau of Labor Statistics (BLS) in their CPI-U index was 4.31%. Underestimating inflation results in optimistic growth rates, and if the BEA’s “nominal” data was deflated using CPI-U inflation information the headline growth number would have been materially lower at an +0.89% annualized growth rate.

Among the notable items in the report :

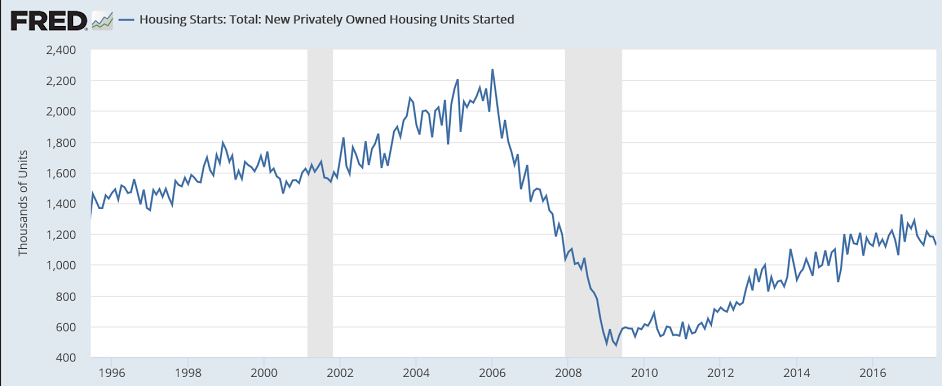
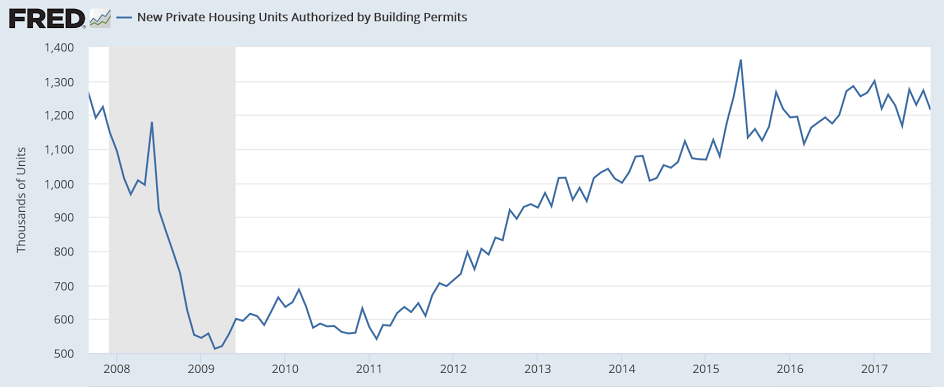
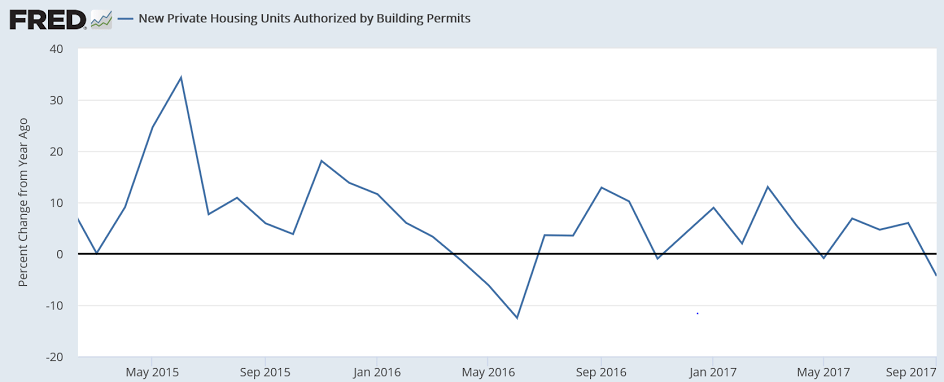
  • The headline contribution from consumer expenditures for goods was reported to be +0.92% (down -0.24% from the prior quarter).
  • The contribution to the headline from consumer spending on services weakened to +0.70% (down -0.38% from the prior quarter). The combined consumer contribution to the headline number was +1.62%, down -0.62% from 2Q-2017.
  • The headline contribution from commercial private fixed investments decreased to +0.25%, down more than half (-0.28%) from the prior quarter. That continued to reflect a contraction in residential construction.
  • Inventory growth provided a material boost to the headline number (+0.73%). This was a +0.61% improvement from the prior quarter. It is important to remember that the BEA’s inventory numbers are exceptionally noisy (and susceptible to significant distortions/anomalies caused by commodity price or currency swings) while ultimately representing a zero reverting (and long term essentially zero sum) series.
  • Governmental spending was reported to be contracting very slightly, at a -0.02% rate. This was a +0.01% improvement from the prior quarter.
  • Exports contributed +0.28% to the headline number, down -0.14% from the prior quarter.
  • Imports added +0.12% to the headline, which was up +0.34% from the prior quarter. In aggregate, foreign trade added +0.42% to the headline number.
  • The “real final sales of domestic product” grew at an annualized 2.25%, down -0.69% from the prior quarter. This is the BEA’s “bottom line” measurement of the economy and it excludes the inventory data.
  • As mentioned above, real per-capita annual disposable income reportedly dropped -$19 per annum. At the same time the household savings rate was reported to have dropped to 3.4% (down -0.4% from the prior quarter). It is important to keep this line item in perspective: real per-capita annual disposable income is up only +7.10% in aggregate since the second quarter of 2008 — a meager annualized +0.74% growth rate over the past 37 quarters.
  • Household disposable income took another hit. Less money was available, and less money was saved — so that a significant portion of the already softening consumer spending came from savings, not pay checks.

  • At this meeting Papadopoulos told everyone he was setting up a meeting with Putin:

    North Korea on verge of ‘catastrophe’ at nuclear site – China warns Kim to STOP tests

    North Korea on verge of ‘catastrophe’ at nuclear site – China warns Kim to STOP tests (Express) Scientists from Beijing believe the Punggye-ri nuclear facility is unstable and that just one more explosion could blow the top off of Mount Mantap, beneath which all six of North Korea’s nuclear tests have been conducted. That could lead to the mountain collapsing, causing radioactive waste to escape and blow across the border into China just 50 miles away. Researchers from the Chinese Academy of Sciences’ Institute of Geology and Geophysics warned Pyongyang delegates of the risk during a briefing in Beijing soon after North Korea’s last nuclear test on September 3, according to the South China Morning Post.

    New home sales, Durable goods orders, Vehicle sales

    Nice uptick, but subject to revision and at best indicating continued very modest growth well below the last cycle with a population that’s maybe 10% higher than it was 10 years ago:

    Highlights

    Volatility tied to low sample sizes is what the new home sales report is known for, proving its reputation again as September surged 18.9 percent to a 667,000 annualized rate. This is the largest percentage gain in nearly 28 years and is the highest level of the economic cycle, since October 2007. The revision to August is surprisingly slight, now at 561,000 vs an initial 560,000.

    If hurricanes affected the South in September, then they apparently lifted sales which rose 26 percent in the month to a 405,000 rate. Sales in the three other regions also rose, led by a 33 percent gain in the Northeast to a 48,000 rate and an 11 percent increase in the Midwest to 73,000. Sales in the West rose 2.9 percent to 141,000.

    The surge in sales makes inventories look even more tight. The number of new homes on the market did hold unchanged in the month at 279,000 yet, relative to sales, supply fell 1 full month to 5.0 months.

    Underscoring the strength of the data is strength in prices as sellers were not giving discounts. The median rose a very steep 5.2 percent in the month to $319,700. And prices may have further to run as the year-on-year gain, at only 1.6 percent, is far below the yearly sales rate of 17.0 percent.

    The volatility that this report is subject to makes today’s results feel uneasy. The 3-month average tells a less dramatic story, at 603,000 which is roughly where the trend line has been much of the year. But September’s surge is still something to take notice of, and unless it’s revised away or simply proves a one-month wonder, the new home market may be accelerating sharply into year end.

    There was clearly some rebound following hurricane Harvey. Sales in the South were up sharply from August, and at the highest level since July 2007. Some contracts in the South, that would have been signed in August, were probably delayed until September. Also some people who lost homes might have signed contracts for new homes in September (New home sales are counted when contracts are signed).
    Read more at http://www.calculatedriskblog.com/#1C0h8I1iEJmLPf4I.99


    And the number circled in red looks a bit suspect?


    Better than expected, supported by a large aircraft order, as manufacturing chugs along at modest rates of growth, with core capital goods looking up as well. However as per the chart, it’s not wrong to say it’s all been going sideways for the last several years:

    Highlights
    Business investment is picking up sharply based on capital goods orders which highlight a very favorable durable goods report. Durable orders jumped 2.2 percent in September which is right at Econoday’s high estimate. A second straight strong month for commercial aircraft, up 64 percent following a 52 percent gain in August, skewed the headline higher but when excluding transportation equipment, orders still managed a strong 0.7 percent gain.

    But its core capital goods orders (nondefense ex-aircraft) that show the most important strength, up 1.3 percent with the two prior months also at 1.3 percent. Shipments for this series, which are direct inputs into the business investment component of the GDP report, are building momentum with monthly gains of 0.7 percent in September following 1.2 and 1.0 percent gains in August and July.

    One soft spot is vehicle orders which rose only fractionally. Hurricanes effects could not be isolated in September’s data and seasonal adjustment procedures were unchanged. Note that upward revisions to August data were first posted in the factory orders report.

    Unfilled orders have been flat but rose 0.2 percent which are another positive of September’s report. And a rise in inventories will be another plus for GDP, up 0.6 percent and pointing to a monthly build for total factory inventories.

    Year-on-year rates are really telling the story, now hitting highs last seen before the oil price collapse of 2014. Total orders are up a yearly 8.3 percent with ex-transportation up 7.5 percent and core capital goods up 7.8 percent.

    With only one exception remaining, and that is manufacturing production in the Federal Reserve’s industrial production report, factory data are accelerating going into year end. Watch for the Kansas City manufacturing report on tomorrow’s calendar.

    These charts are not inflation adjusted:


    Consumer not looking so good:


    Settling back down after replace orders from hurricane damage:

    From WardsAuto: U.S. Forecast: October Auto Sales Rate Flat with Prior-Year

  • A WardsAuto forecast calls for U.S. automakers to deliver 1.31 million light vehicles in October. A daily sales rate of 52,579 units over 25 days is nearly equivalent to like-2016’s 52,584 units for 26 days.
  • The report puts the seasonally adjusted annual rate of sales for October at 17.55 million units, behind year-ago’s 17.80 million and prior-month’s 18.48 million mark.
  • emphasis added

    Read more at http://www.calculatedriskblog.com/#f5XXWIM4C9kTSV7l.99

    Existing home sales, Oil rig count

    Now down year over year, and in line with the deceleration in bank mortgage lending:

    Highlights

    Existing home sales posted their first gain in four months, rising 0.7 percent in September to a 5.390 million annualized rate that is near Econoday’s top forecast. Hurricane effects are hard to gauge with the National Association of Realtors reporting that sales in Florida were down substantially though sales in Houston have already recovered.

    The sales gain came at a price discount as the median fell 3.2 percent to $245,100 for what is still, however, a respectable 4.2 percent year-on-year gain. Supply is still very tight, at 1.900 million resales on the market which makes for a useful 1.6 percent gain though the yearly rate is down 6.4 percent. On a sales basis, supply is unchanged at only 4.2 months.

    Sales in the South fell 0.9 percent in September and follow August’s 5.7 percent decline. These may be hurricane effects but they’re not overly substantial given mixed readings in other regions. All regions are either slightly lower to flat year-on-year.

    And overall sales are flat, down 1.5 percent compared to September last year. Yet this report is positive for what is a lukewarm housing sector. Watch for sales of new homes and pending sales of existing homes on next week’s calendar.


    This peaked a while back and continues to fade:

    Highlights

    The Baker Hughes North American rig count is down 25 rigs in the October 20 week to 1,115. The U.S. rig count is down 15 rigs at 913 but is up 360 rigs from last year at this time. The Canadian count is down 10 rigs from last week at 202 but compared to last year is up 59 rigs.

    For the U.S. count, rigs classified as drilling for oil are down 7 rigs at 736 while gas rigs are down 8 at 177. For the Canadian count, oil rigs are down 5 at 107 and gas rigs are also down 5, at 95 rigs.

    The week’s large drop is the fourth consecutive weekly decline in the count, and is partly caused by seasonality as cold weather begins to curtail operations in northern regions, and partly probably by lingering hurricane damages, with Texas down 8 rigs to 436.

    Schlumberger, Baker Hughes Warn Of N. America Slowdown

    Oct 20 (Reuters) — Schlumberger Ltd and Baker Hughes, the world’s top two oilfield services firms, warned on Friday of a slowdown in North America and a challenging year ahead as crude oil prices stay volatile.

    Schlumberger said investments in North America were moderating as energy companies increasingly shied away from chasing higher production at the cost of financial returns.

    “Oil prices remain volatile and, as a result, our customers remain cautious,” Baker Hughes Chief Executive Lorenzo Simonelli said.

    The company, in its first report to include GE Co’s oil and gas business since their merger, reported a quarterly profit that missed analysts estimates by a wide margin.

    Schlumberger reported a 53 percent jump in revenue from North America, its biggest market, in the latest quarter, but cautioned that activity had been slowing.

    “In the U.S. Gulf of Mexico, activity continued to weaken in the third quarter, and the outlook remains bleak for this region based on current customer plans,” Schlumberger said.

    The company’s results and warnings come amid slowing drilling activity in North America.

    Housing starts, Spending, Trump comments, Car comment

    Continuing evidence that the slowdown in bank lending is reflecting slowdowns in the macro economy:

    Highlights

    Single-family permits continue to rise in what, however, is the main positive in an otherwise weaker-than-expected housing starts and permits report. Looking first at headline totals, starts fell 4.7 percent in September to a 1.127 million annualized rate which is well under Econoday’s low estimate. Permits fell 4.5 percent to a 1.215 million rate that is above the low estimate but below the consensus for 1.238 million. Hurricane effects aren’t striking despite affected areas accounting for more than 1/4 of the total.

    First the good news as permits for single-family homes rose 2.4 percent to an 819,000 rate and a year-on-year gain of 9.3 percent. Single-family homes are the backbone of the housing sector and strength here not only points to greater supply in the new home sales market but also to gains ahead for residential investment in the GDP report.

    Not good news are permits for multi-family units which fell 16.1 percent to a 396,000 rate with this yearly rate at minus 24.0 percent. Multi-family units had shown strength earlier in the year but have since tailed off.

    Starts for multi-family units fell 5.1 percent to a 298,000 rate with single-family starts down 4.6 percent to 829,000. Single-family completions offer some good news, up 4.6 percent to a 781,000 rate and adding immediate supply to the market.

    Regional data do show what is likely hurricane-related weakness in the South, where starts fell 9.3 percent to 527,000 following August’s 4.9 percent decline. Yet also weak were starts in the Midwest, down 20.2 percent to 154,000, and also the Northeast, down 9.2 percent at 119,000.

    Housing has been generally slowing and looks to end 2017 no better than flat. Still, permits and completions for single-family homes are solid pluses.

    President Trump admits he’s trying to kill Obamacare. That’s illegal.

    The president has a right not to like the ACA. But so long as it is the law of the land, he does not have the right undermine it through the use of executive power.

    “Faithful” execution of a law that is validly on the books is what the words of the Constitution require of Trump — until Congress decides otherwise.

    Branson: I met Trump once, and all he talked about was destroying people who wouldn’t help his bankrupt firm

    http://www.carophile.org/the-worst-cars-of-all-time/41/

    JOLTS, IBD survey, Trump comments

    I read this as weakening demand and employers unwilling to pay up to hire, and maybe even posting openings to replace existing workers at lower wages:

    Highlights

    Job openings held steady at a very abundant 6.082 million in August while hirings remained far behind, at 5.430 million. In an early indication of full employment, the gap between openings and hiring first opened up about 2-1/2 years ago signaling that employers are either not willing to offer high enough pay to fill empty positions and/or are having a hard time finding people with the right skills. At 652,000, the current spread between openings and hirings is one of the very widest on record.

    For comparison, the number of job seekers who are out actively pounding the pavement is 6.911 million which is very near the total number of available openings. Today’s results offer further evidence that the economy is at full employment and will likely add urgency for further Federal Reserve rate hikes.

    Hires have gone flat and on a per capita basis are far lower than the prior cycle:

    More evidence Trumped up expectations are fading:

    United States IBD/TIPP Economic Optimism Index

    The IBD/TIPP Economic Optimism Index in the United States fell 5.8 percent from the previous month to 50.3 in October 2017, below market expectations of 54.2. The gauge of the six-month economic outlook declined 4.7 percent to 48.7; and the personal financial outlook index dropped 4 percent to 59.5. Also, the measure of confidence in federal economic policies decreased 9.1 percent to 42.8.

    President Donald Trump suggested he’s smarter than Secretary of State Rex Tillerson, saying in an interview published Tuesday that if Tillerson did call him a moron, as reported, the two should ‘‘compare IQ tests.’’

    “And I can tell you who is going to win,” Trump said to Forbes magazine.

    Trump reportedly wanted nearly 10 times more nuclear weapons

  • President Donald Trump discussed increasing the number of U.S. nuclear weapons by nearly 10 times at a July meeting with top national security officials, according to NBC News.
  • After the meeting, Secretary of State Rex Tillerson was heard calling Trump a “moron,” NBC reported.
  • Small business survey, Commercial construction index, Buybacks comments

    Trumped up expectations continue to unwind, though still above pre election levels, and note the details:

    Highlights

    The small business optimism fell 2.3 points in September to 103.0, led by a sharp drop in sales expectations, not only in states affected by hurricanes in Texas and Florida, but across the country. The surprising drop put the index at the lowest level of the year after hovering just below the 12 year high set in January, and came in not only below the consensus forecast of 105.4 but below the range of analysts’ forecasts.

    Of the ten components making up the index, 6 declined, 3 rose and 1 was unchanged. The most severe declines were registered in sales expectations, which fell 12 points to 15, and now is a good time to expand, falling 10 points to 17. But planned increases in capital outlays by small business owners also fell significantly, with the component shedding 5 points to 27.

    Despite the sharp drop in sales expectations, the one bright spot of the report was the net percentage of small business owners planning to increase inventories, which rose by 5 points to 7, as more owners expected a strong quarter.

    The employment front also remained very strong, with the net percentage of business owners planning to increase employment rising by 1 point to 19 while current job opening slipped by just a point to a still exceptionally strong 30.

    Though the level of optimism remains very high by historical standards and despite the month’s decline still surpasses any month in previous years going back to 2006, the September survey indicates the frothy expectations of business-friendly health reform and lower corporate taxes have cooled noticeably in September. Moreover, NFIB noted that optimism may have actually declined more than its survey indicates, since it was likely that reporting members in Florida and Texas were underrepresented because of disruptions.

    Optimism Among US Small Businesses at 10-Month Low
    The NFIB’s Index of Small Business Optimism in the US fell to 103 in September 2017 from a six-month high of 105.3 in August, and below market expectations of 105.1. It was the lowest reading since November last year, as 6 of 10 index components declined: Higher sales expectations (-12 pp to net 15 percent); good time to expand (-10 pp to 17 percent); plans to make capital outlays (-5 pp to 27 percent); expectations the economy will improve (-1 pp to 30 percent); current job openings (-1 pp to 30 percent); and expected credit conditions (-1 pp to -3 percent). On the other hand, earnings trends were flat (at -11 percent) and improvement was observed for: Plans to increase inventories (+5 pp to 7 percent); current inventory (+2 pp to -3 percent); and plans to raise employment (+1 pp to 19 percent).


    This index is down in line with decelerating commercial real estate bank borrowings:

    A few comments on share buybacks:

    Once a company decides it has ‘excess cash’ the options are dividend payments or share buybacks.

    After a dividend payment the company has that much less cash and shares outstanding remain the same.

    After a share buyback the company has that much less cash and shares outstanding are reduced.

    Now consider that after a reverse split the company has the same cash and there are fewer shares outstanding.

    Therefore, for the company, share buybacks are functionally equivalent to a dividend payment combined with a reverse split, as in either case the company has less cash and there are fewer shares outstanding.

    But for executive compensation related calculations, a reverse split reduces share count or increases option strike prices, while buybacks do no alter executive share count and option strikes.

    Seems the accounting process should disclose any increases in executive compensation due to share buybacks?

    Seems the accounting process should disclose any increases in executive compensation due to share buybacks?