Mtg applications, GDP, Personal savings, Corporate profits, ADP employment, Federal tax reciepts

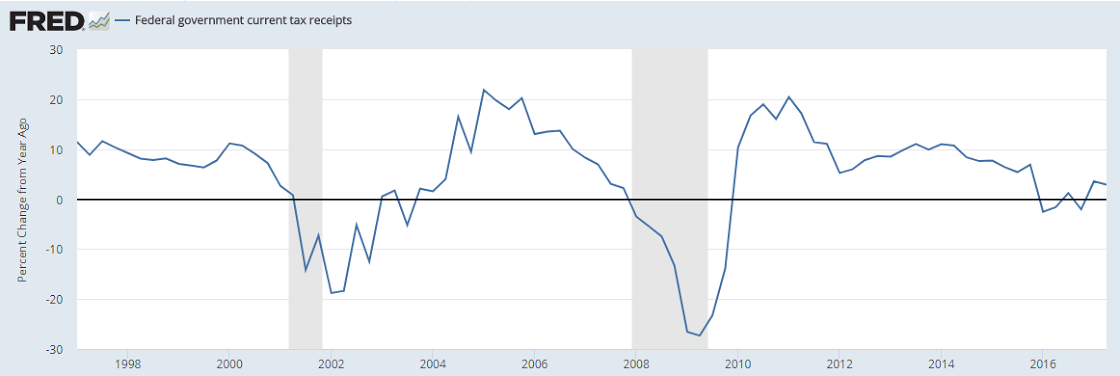
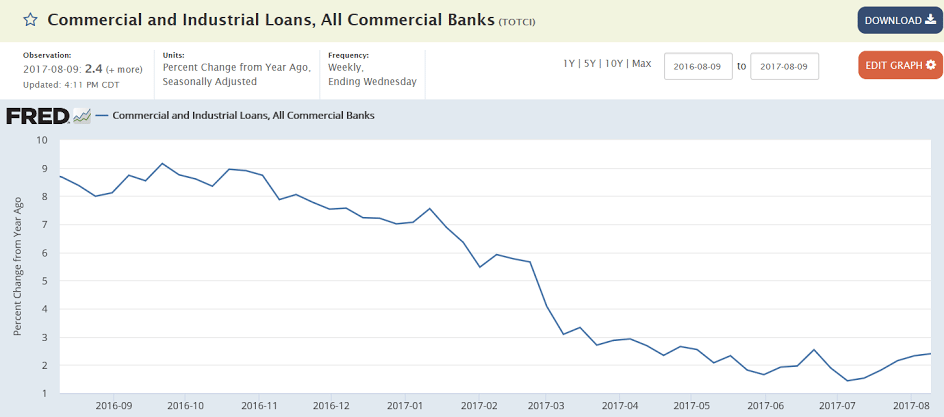
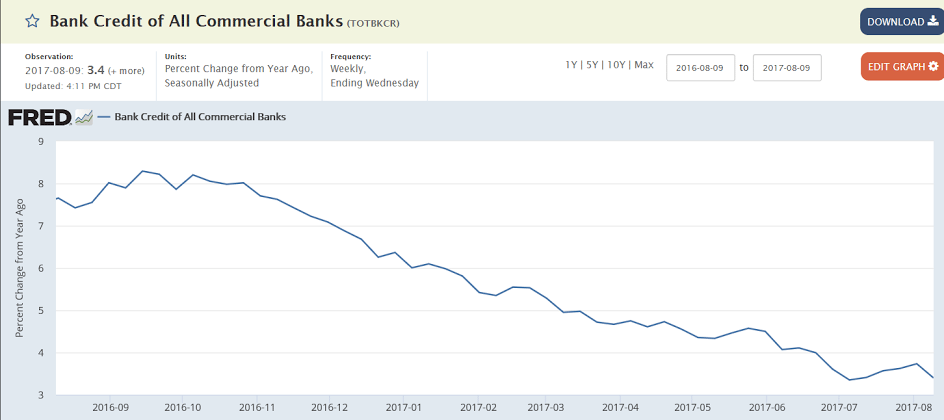
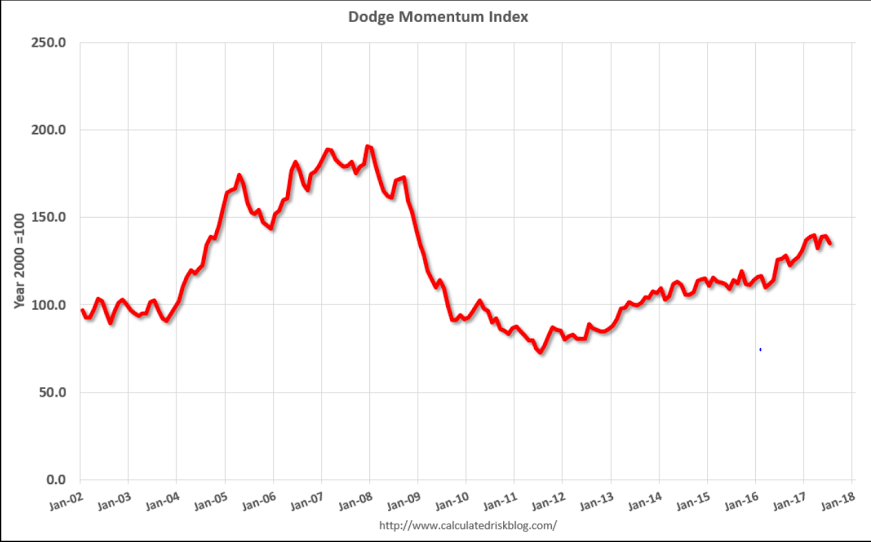
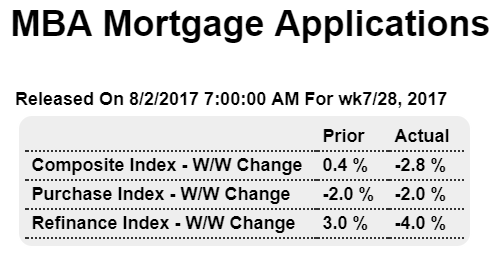
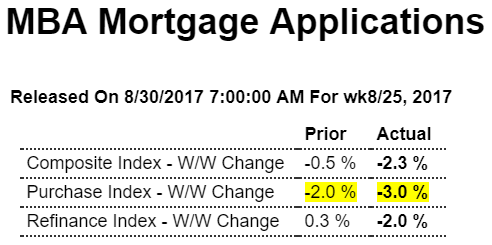
Purchase applications were down again, as housing weakness reflects the drop in the growth of mortgage credit:

Highlights

Low mortgage rates are failing to entice home buyers, whose activity declined for the third straight week according to the Mortgage Bankers’ Association. Purchase applications for home mortgages fell a seasonally adjusted 3.0 percent in the August 25 week following 2 percent declines in the two prior weeks. Unadjusted, the purchase index decreased 5 percent from the prior week, taking it to a level only 4 percent higher than in the same week a year ago, well off the 8 plus percent gains seen in previous weeks this year. Applications for refinancing fell 2 percent from the prior week, with the refinance share of mortgage activity rising by 1.2 percentage points to 49.4 percent. The average interest rate on 30-year fixed rate mortgages ($424,100 or less) fell 1 basis point 4.11 percent, the lowest rate since November 2016. Three weeks of falling purchase applications is a worrisome development for the housing market, which may be accelerating its retreat from expansion highs, especially following the evidence of July weakness submitted in last week’s housing data, showing monthly declines in sales for both new and existing homes.

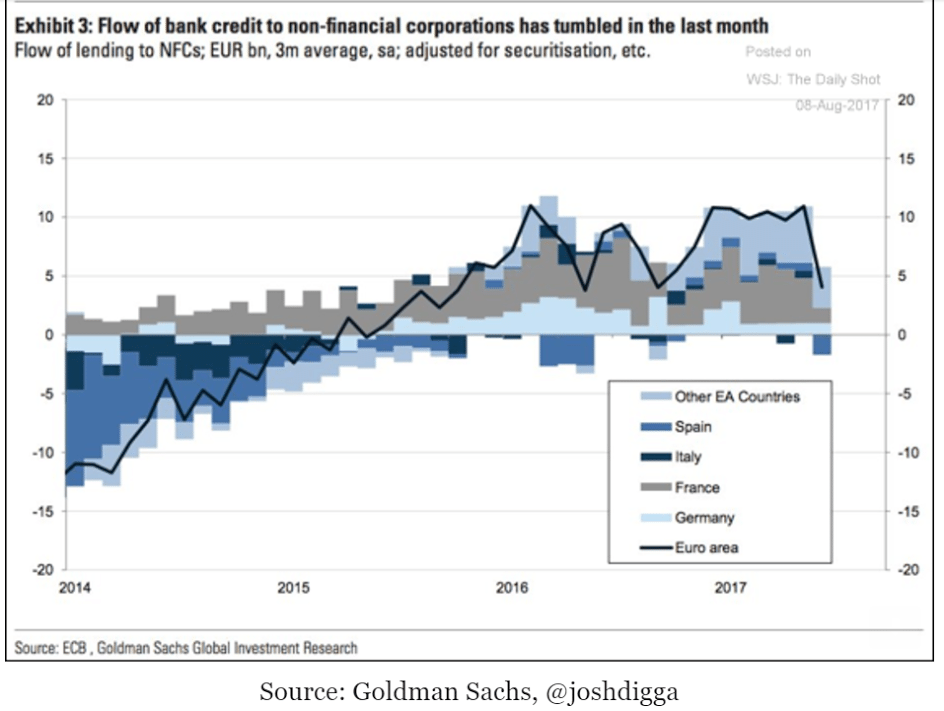
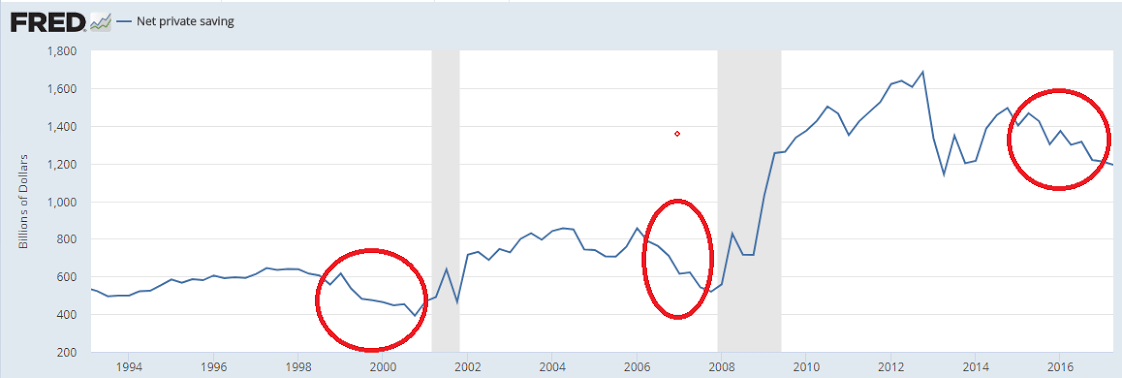
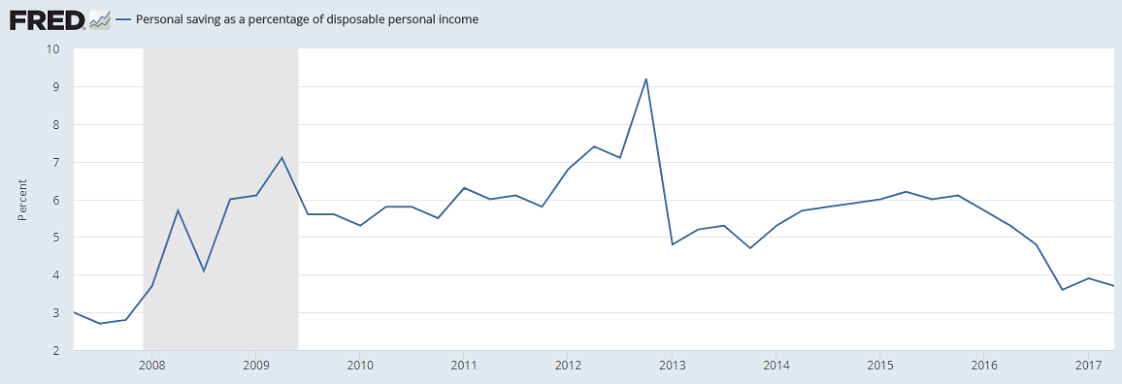
So the question is, how is GDP coming in at 3% while credit growth has collapsed and personal income growth has evaporated as well? A partial answer may be the personal savings rate, which has not only gone down, but total net personal savings seems to have declined as well. This is most likely unsustainable, and likely to very quickly translate into a further substantial decline in personal spending.

Also, prices pressures were very weak, indicating low demand, which seems contradictory. But close examination shows health care premiums for various private plans, which count as personal consumption, were up by 25%, and utility bills were high as well, leaving less for spending on other goods and services:

Highlights

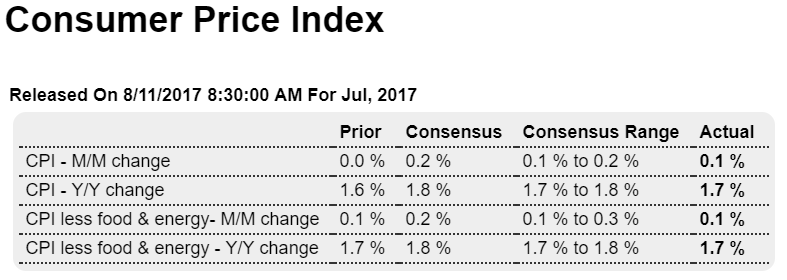
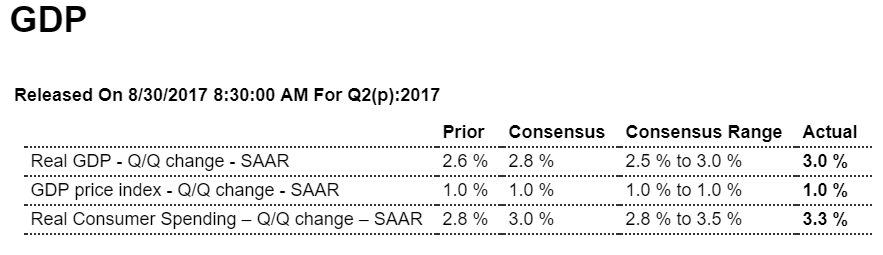
The second-quarter proved to be very solid, revised 4 tenths higher in the second estimate to a 3.0 percent annualized rate. And strength is centered where it must be as consumer spending is now at a 3.3 percent rate for a 5 tenths upward revision.

Non-residential investment was also a positive, at a 6.9 percent rate following the prior quarter’s 7.2 percent showing. Residential investment, however, was a drag on the second quarter, at a negative 6.5 percent rate that followed a positive 11.1 percent rate in the first quarter. Government purchases were negative for a second straight quarter, at minus 0.3 percent following a minus 0.6 percent first-quarter showing. Both second-quarter net exports and inventories were slightly positive.

But prices were very weak in the quarter, at a 1.0 percent rate overall and 1.1 percent for the core. Inflation aside, the second quarter marked a solid though not exceptional reversal of the first quarter’s 1.2 percent pace and points to constructive momentum going into the third quarter.

The increased cost of health insurance is a central fact in any discussion of health policy and health delivery. Annual premiums reached $18,142 in 2016 for an average family, up 3 percent from 2015, with workers on average paying $5,277 towards the cost of their coverage.* For those Americans who are fully-covered, these cost realities affect employers, both large and small, plus the “pocket-book impact” on ordinary families. Yet for those buying insurance on an exchange or private market plan for 2017, the average increase before subsidies was a shocking 25 percent. For 2016 among the roughly 85 percent of HealthCare.gov consumers with premium tax credits, the average monthly net premium increased just $4, or 4 percent, from 2015 to 2016, according to an HHS report.

* Figures reported by Kaiser Employer Survey, 9/2016, apply to employer-based insurance.
http://www.ncsl.org/research/health/health-insurance-premiums.aspx


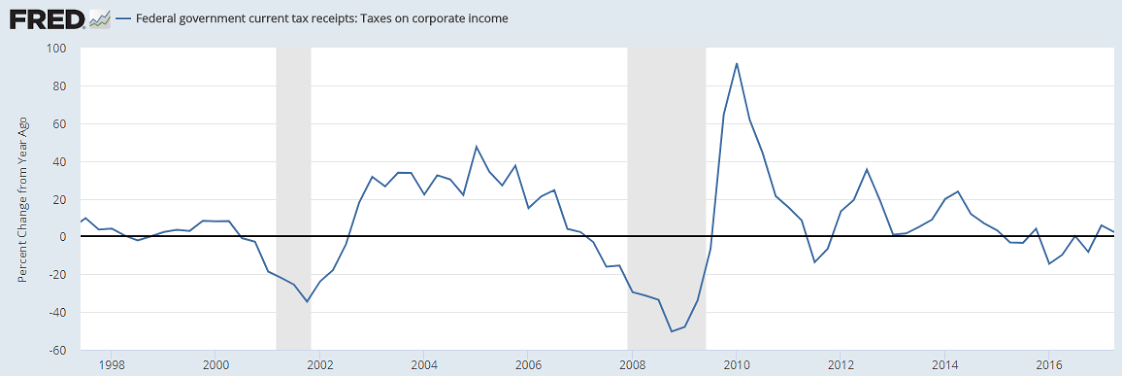
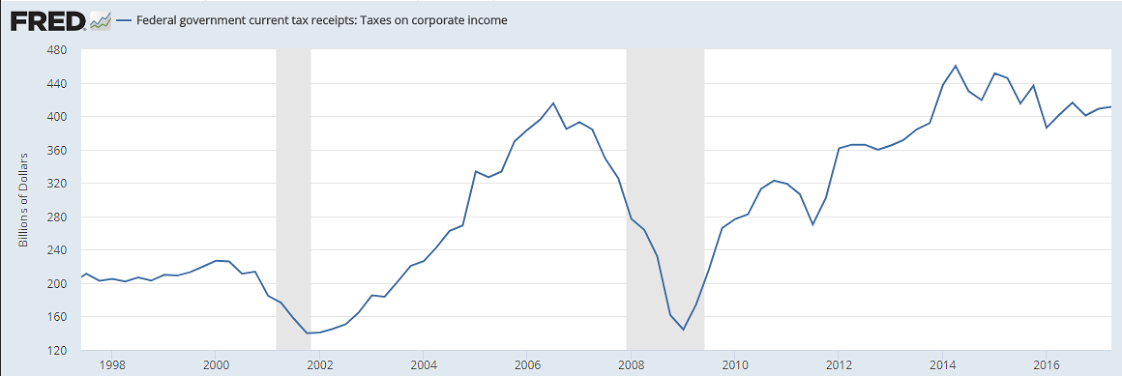
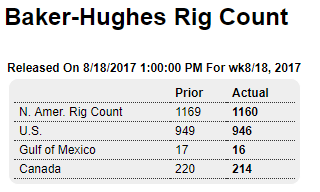
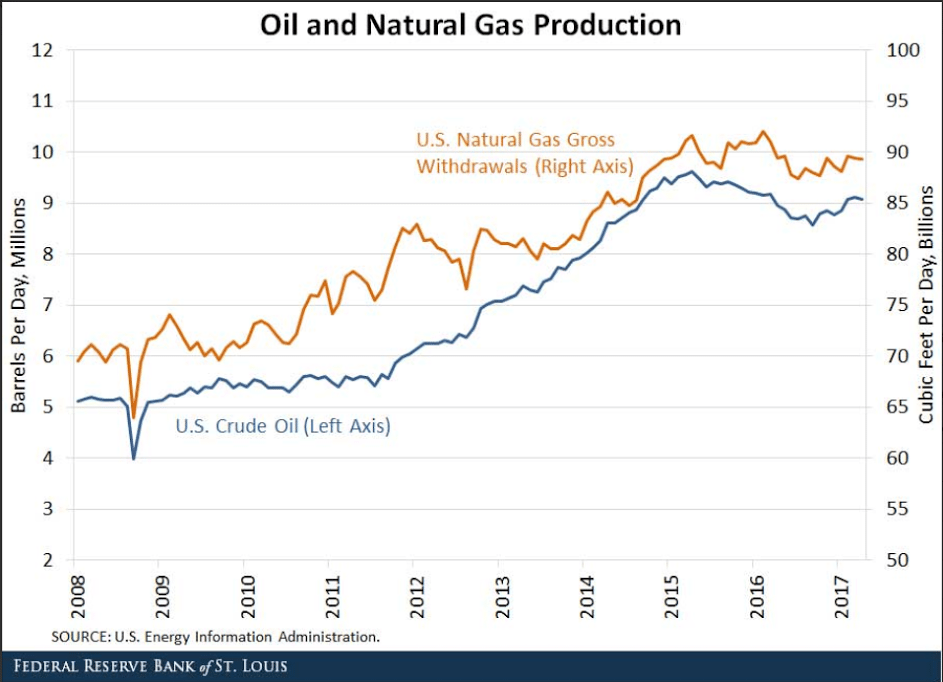
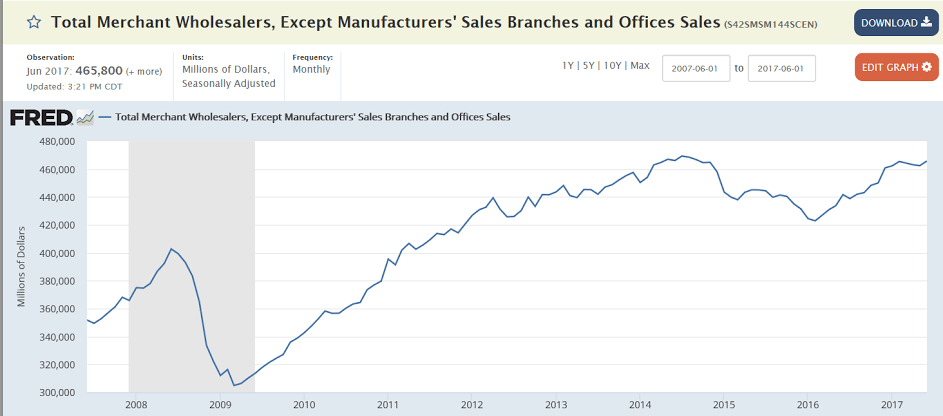
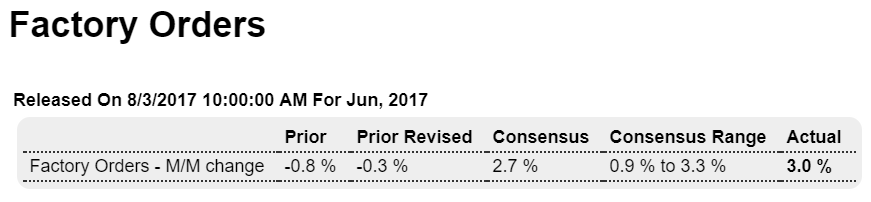
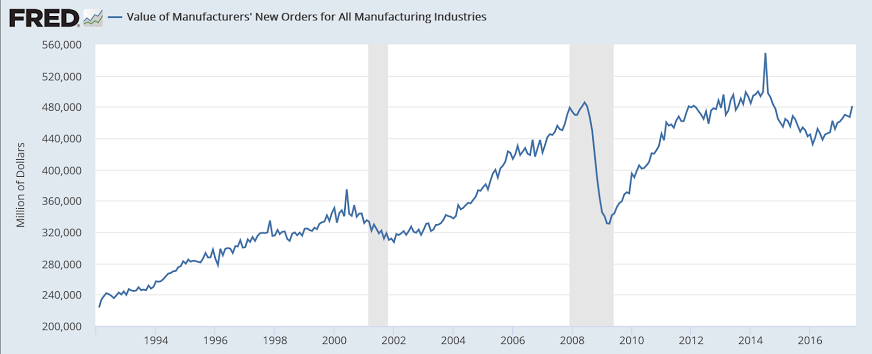
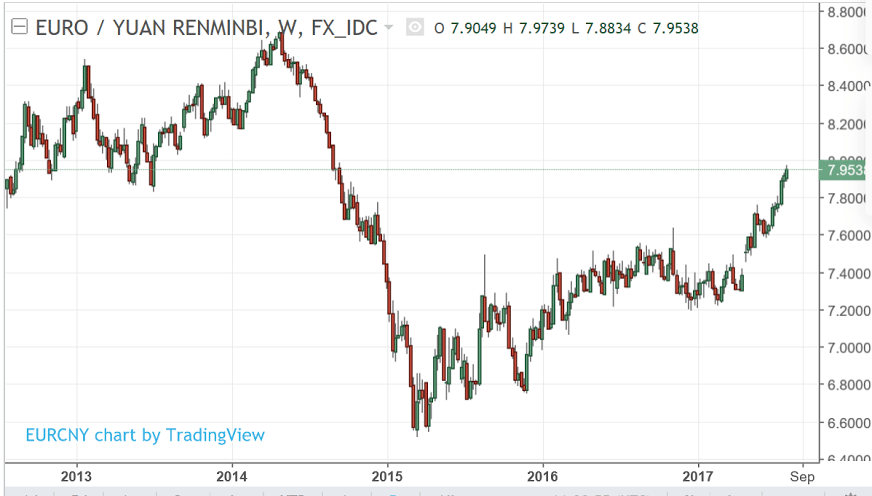
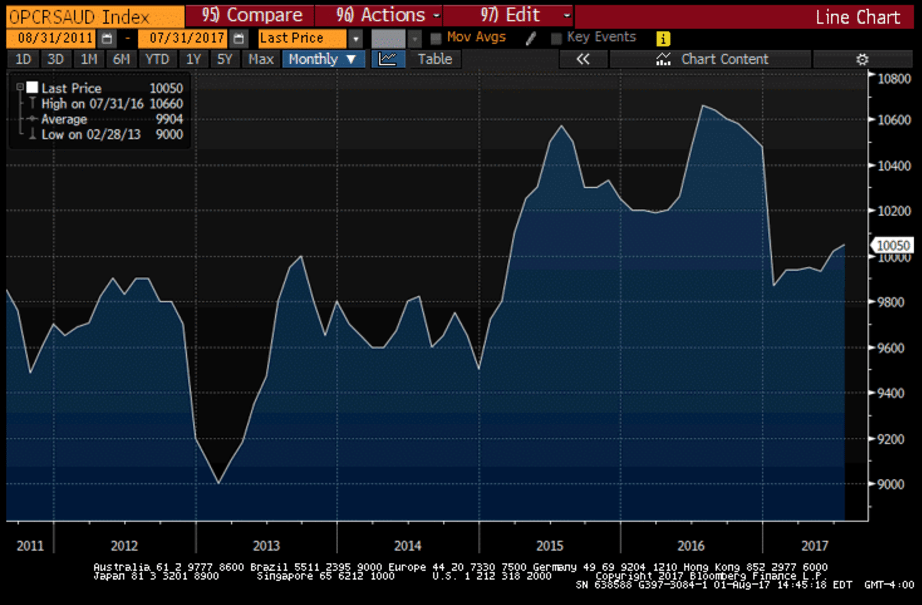
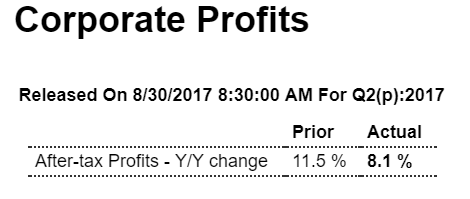
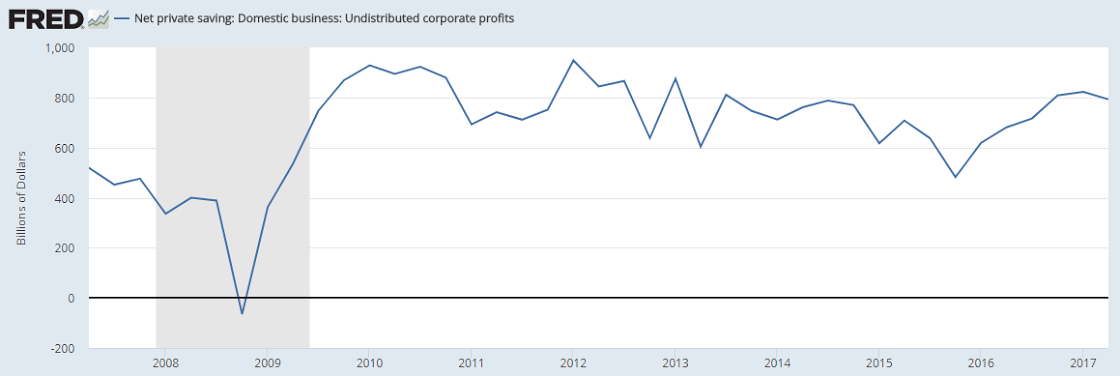
Yes, the growth rate is reasonable, but it’s currently measured from the dip that took place after oil capex collapsed. Total profits are now only back to where they’ve been for quite a while and have most recently flattened out:

Highlights

Corporate profits rose 8.1 percent year-on-year in second-quarter 2017 to an annualized $1.785.9 trillion from $1.652.1 trillion in second-quarter 2016. Profits are after tax without inventory valuation or capital consumption adjustments.
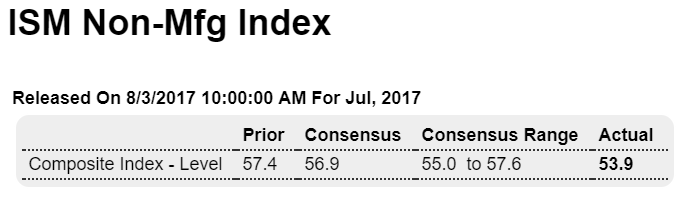
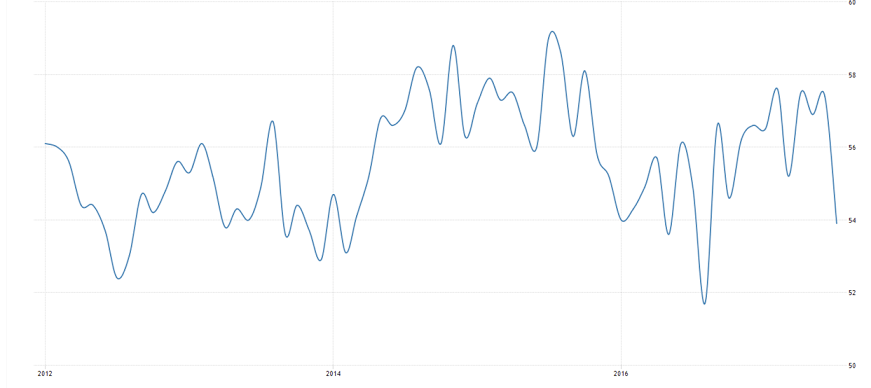
Highlights

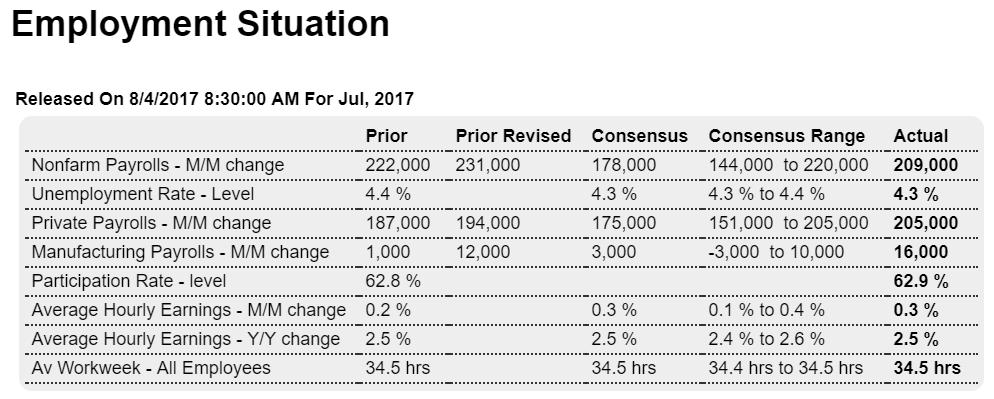
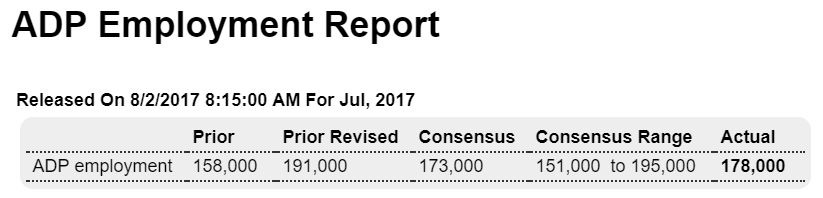
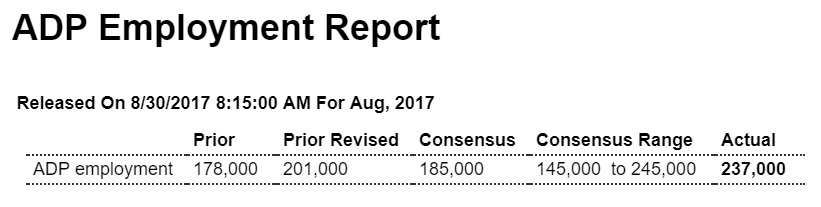
ADP is calling for a 237,000 rise in August private payrolls for Friday’s employment report where Econoday’s consensus is 179,000. ADP’s predictive accuracy has been on-and-off this year with their call for July, at an initial 178,000 which is now revised to 201,000, well below the actual 205,000.

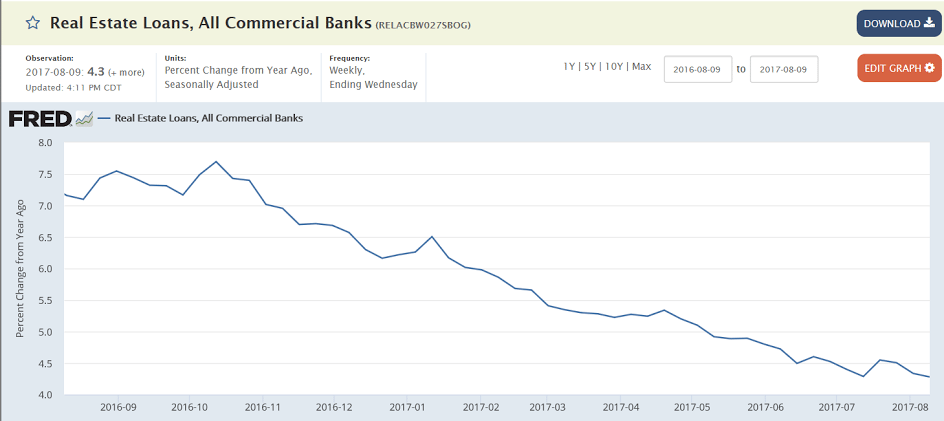
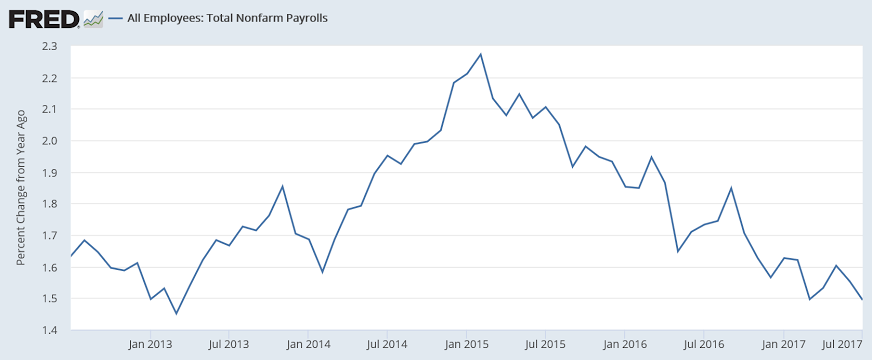
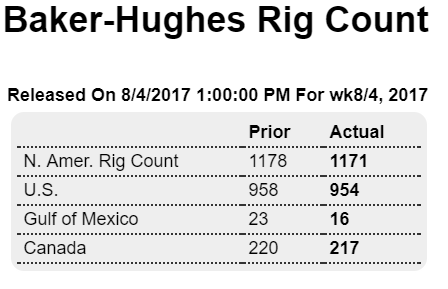
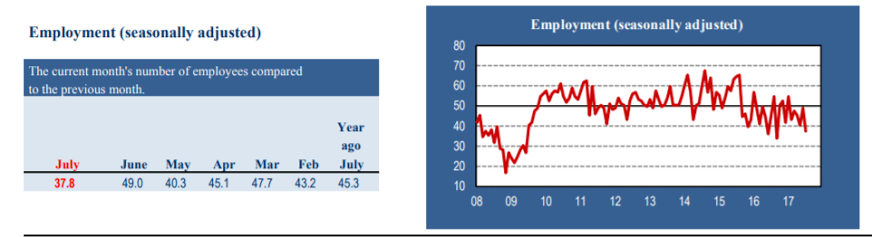
Looks to be slowing as well:

House prices, Redbook retail sales, NY Fed survey

Home prices may be softening, but too soon to tell:

Highlights

The FHFA house price index came in at a very soft 0.1 percent increase in June, well short of Econoday’s consensus for 0.5 percent and low estimate of 0.3 percent. This is both good news and bad news, as slowing price appreciation should help affordability for home sales but will also limit growth in household wealth. Despite June’s weakness, year-on-year prices remain very strong, at plus 6.5 percent which is nearly a percentage point above Case-Shiller’s data. Watch on next week’s calendar for June data from Case-Shiller.


This has definitely come back from the lows, though there are likely fewer stores reporting, and this series is not adjusted for inflation:

U.S. workers have low hopes for higher pay

Aug 21 (Reuters) — A New York Fed survey found that on average respondents said in July that the lowest annual salary they would accept in a new job would be $57,960, down from $59,660 only four months earlier. Asked what salary they expected in job offers over the next four months, the average response declined to $50,790 from $54,590 when the last survey was taken in March. The survey also showed 22.7 percent of respondents searched for a job in the last four wees, up from 19.4 percent in the previous report. The respondents saw a 22 percent likelihood of receiving at least one job offer in the next four months, down from an average response of 25 percent eight months ago.

Credit check, Rig count, Consumer sentiment, Romney comment, Pollak comment

More of same:

More evidence this has stabilized and maybe reversed:


Expectations up, current conditions down:

Highlights

Consumer sentiment unexpectedly burst higher in the August flash but the results, warns the report, do not fully reflect the impact of the weekend’s violence in Virginia. The index rose to 97.6 which is well over Econoday’s high estimate and the strongest reading since the post-election surge in January. But the report said “too few” interviews were conducted after the violence and that related fallout may reverse expectations especially for Republicans.

Details of the August flash show an 8.5 point jump in the expectations component to 89.0 with, however, the current conditions component lagging with a 3.4 point decline to 111.0. The step back for current conditions is not a favorable indication for consumer activity in the month of August. And in a negative for Federal Reserve policy makers, inflation expectations are very subdued, unchanged at 2.6 percent for the 1-year outlook and down 1 tenth for the 5-year outlook at 2.5 percent.

Recent History Of This Indicator

Unlike the consumer confidence index which is holding steady near 20-year highs, the consumer sentiment index has been falling back, down more than 5 points from its highs early in the year to 93.4 in July. Econoday’s consensus for the preliminary August report is calling for a moderate rebound to 94.0. July showed continued strength in current conditions but a noticeable slowing in expectations in a divergence that hints at year-end erosion for the headline index.

Mitt Romney urges Trump to apologize for Charlottesville reaction

“I think there’s a fear among conservatives that with Steve Bannon gone, essentially the Trump administration could become in all but name a Democratic administration,” Pollak said.

Steve Bannon plans to go ‘thermonuclear’ on White House officials: Axios

Carl Icahn drops out of presidential advisory role

Retail sales, Import and export prices, Business inventories, Housing index

The chart still looks weak to me. Shale boom in 2014 pumped it up, and then reversing with the shale bust, and still looking suspect after January when consumer credit further decelerated:

Highlights

The consumer was back in the stores last month in a July retail sales report, headlined by a 0.6 percent monthly gain, that not only exceeds top expectations but also includes sizable upward revisions. Nonstore retailers, vehicle dealers, building materials stores lead the report — all major categories. Secondary readings are all strong: up 0.5 percent ex-autos, up 0.5 percent ex-autos ex-gas, and up 0.6 percent for the control group.

Revisions are prominent in this report with June revised 5 tenths overall to plus 0.3 percent from an initial minus 0.2 percent. And May gets an upward revision too, now unchanged vs minus 0.1 percent.

One the weakest of all the consumer readings, retail sales are now back into the fold with other indications on consumer spending, which are positive and in line with full employment. Note that the upward revisions to June and May will be positives for second-quarter GDP revisions.

This measure has flattened recently:


This looks to me like it’s again working its way lower:


Looking like the weak $US is translating into deflation abroad rather than inflation at home:

Highlights

A boost in petroleum gave a lift to import prices while a boost from agricultural gave a boost to export prices. Import prices in July posted an as-expected 0.1 percent increase as petroleum was up 0.7 percent in the month. Outside of petroleum, however, July import prices limped in at no change. Prices of finished exports remain dead flat, at or near zero whether month-on-month or year-on-year. The yearly rate for overall imports is steady at a modest 1.5 percent.

Export prices rose a stronger-than-expected 0.4 percent with agricultural products up 2.1 percent to more than shave in half sharp declines in the two prior months. Prices for finished exports, like finished imports, are flat with consumer goods, at minus 1.7 percent year-on-year, especially weak. Total export prices are up only 0.8 percent year-on-year which is not good news for the nation’s exporters.

But what is good news for exporters is the tangible decline underway in the dollar. This points to increasing pressure for import prices which, though making them less affordable to U.S. buyers, will help the Federal Reserve in its efforts to stimulate inflation.

Inventories remain excessive and just grew a bit more than sales:

Highlights

After a flat start to the second quarter, businesses built up their inventories by a sharp 0.5 percent in June which beats Econoday’s consensus by 1 tenth. The build is centered in wholesale which rose 0.7 percent with inventories among retailers up 0.6 percent in June which, based on this morning’s retail sales report, is a plus going into what proved to be a very strong July for the sector. Factory inventories in June rose 0.2 percent.

In an uncertain result in the report, the rise in inventories exceeded the 0.3 percent rise in underlying sales to lift the inventory-to-sales ratio 1 tick to a less lean 1.38. This could mean that supply is exceeding demand, or however that businesses are stocking up ahead of what see as better business ahead. Note that the slightly higher-than-expected headline may give a lift to second-quarter revision estimates which are likely to get a more definitive lift from the upward revisions in today’s retail sales report.

Highlights

The housing market index joins retail sales and Empire State as major upside surprises this morning, up 4 points to 68 in August which tops Econoday’s high forecast by 2 points. This puts the index back at levels earlier this year and points to building confidence among the nation’s home builders.

Builders see gains for both present sales, up 4 points to 74, and 6-month sales, up 5 points to 78. Trailing far behind, however, and not showing much pace is traffic still under 50 at 49. Lack of traffic hints at lack of first-time buyers who appear to be getting locked out of the new home market by high prices and lack of supply on the market.

Regional composite scores show the West, a key region for builders, out in front followed by the South and Midwest which are also both very strong followed in the distance by the Northeast which is flat. This report offers an advance indication for August but won’t be hurting expectations any for tomorrow’s July housing starts and permits report where strength is the call.

CPI, Oil and gas production, Hotels

So the Fed is failing to meet its inflation target, wage growth remains weak, and all measures of credit expansion have been decelerating for more than 6 months:

Highlights

Consumer prices remain very soft, failing to match what were modest Econoday expectations for July. Total prices edged 1 tenth higher in July as did the core (less food & energy) which are both no better than the low estimates. Year-on-year rates are also at the low estimates, at 1.7 percent each. Moderation in housing costs remains a major disinflationary force, inching only 0.1 percent higher for a yearly 2.8 percent which is down 2 tenths from June. And wireless services, in keeping with the telecom revolution, continue to move lower, falling 0.3 percent on the month for a yearly decline of 13.3 percent.

Vehicle sales have been weak this year and it’s being reflected in prices which fell 0.5 percent in the month. Lodging away from home is another major negative in the July report, falling a record 4.2 percent as motels and hotels cut prices. On the plus side, apparel prices, which had been on a long negative streak, rose 0.3 percent though the year-on-year rate remains in the negative camp at minus 0.4 percent. Medical care is a plus in the report, rising 0.4 percent for the second straight month with the year-on-year rate, however, edging lower to 2.6 percent. Energy prices are a negative in the report, at minus 0.1 percent, offset by a 0.2 percent rise for food.

Is the dip in inflation the result of one-time effects that will soon pass? Or is it the result of weak wages and general global disinflation? Lack of inflation remains the central trouble in the Federal Reserve’s policy efforts. Today’s results will not be improving expectations for the beginning of balance-sheet unwinding at the September FOMC.

Interesting how both core and headline CPI growth reversed and began deceleration just over 6 months ago as well:


Crude production has leveled off? Gas as well?

Competition from Air B%B?

From HotelNewsNow.com: STR: US hotel results for week ending 5 August

The U.S. hotel industry reported mostly negative year-over-year results in the three key performance metrics during the week of 30 July through 5 August 2017, according to data from STR.

In comparison with the week of 31 July through 6 August 2016, the industry recorded the following:

  • Occupancy: -1.5% to 74.5%
  • Average daily rate (ADR): +0.7% to US$129.00
  • Revenue per available room (RevPAR): -0.8% to US$96.08
  • Read more at http://www.calculatedriskblog.com/#Abl5O3RLz78wWYJb.99

    Dodge index, Euro area lending, China investment, Wholesale trade

    This is reflected in the deceleration of commercial real estate lending:

    From Dodge Data Analytics: Dodge Momentum Index Stumbles in July

    The Dodge Momentum Index fell in July, dropping 3.3% to 135.0 (2000=100) from its revised June reading of 139.6. The Momentum Index is a monthly measure of the first (or initial) report for nonresidential building projects in planning, which have been shown to lead construction spending for nonresidential buildings by a full year. The move lower in July was due to a 6.6% decline in the institutional component of the Momentum Index, while the commercial component fell 1.1%.This month continues a recent trend of volatility in the Momentum Index where a string of gains is interrupted by a step backwards in planning intentions.

    Not just the US!


    This is slowing things down as well:

    China’s capital controls apply brakes on ‘go out’ drive

    Aug 9 (Nikkei) — China’s outbound direct investment plunged 46% on the year to $48.1 billion in the six months through June, trailing foreign direct investment of $65.6 billion. Foreign acquisitions, remittances, money exchanges and other outbound transactions of more than $5 million became subject to mandatory pre-screening by regulators starting last November. Regulators also said real estate, hotel, entertainment, film, sports club and other “irrational” overseas investments would be tightly monitored. In June it was learned Chinese bank regulators had told lenders to more strictly examine overseas investments by Dalian Wanda Group, HNA Group and three other major conglomerates.

    Good chance the inventories are ‘unwanted’ due to low sales as retail sales were a lot lower than expected:

    Highlights

    Wholesale inventories rose a sharp 0.7 percent in June in what was a wanted build given a likewise 0.7 percent rise in sales. The stock-to-sales ratio is unchanged at a lean 1.29. If there is an imbalance, it’s inventories of autos which rose 1.4 percent while sales fell 0.5 percent. Otherwise this a very positive report, pointing at the same time to sales growth and inventory growth.

    Inventories still look elevated to me:


    This is the sales chart they think is so good- still short of 2014 levels and this chart isn’t adjusted for inflation:

    Small business survey, JOLTS

    No sign of Trumped up expectations fading here:

    Hires fell, which most are saying indicates a lack of supply of workers. But the low wage growth and low participation rates tell me it’s more likely about low aggregate demand:

    Highlights

    Job openings rose sharply in June, to 6.163 million from 5.702 million in May. Hires, however, fell sharply, to 5.356 million from 5.459 million. This data set can be volatile but the underlying theme is a separation between openings and hiring which points to tightness in the labor market and the risk, at least theoretically, of wage inflation.

    Looks to me like ‘hires’ tend to lead openings:

    Employment, Trade, M2, Public employment, Rig count

    More than the entire gain in civilian employment seems to have been via part time work:

    Highlights

    The second half of the year opens on a strong note as nonfarm payrolls rose 209,000 in July, far above Econoday’s consensus for 178,000. The unemployment rate moved 1 tenth lower to 4.3 percent while the participation rate rose 1 tenth to 62.9 percent, both solid positives. And a very strong positive is a 0.3 percent rise in average hourly earnings though the year-on-year rate, at 2.5 percent, failed to move higher. The workweek held steady at 34.5 hours.

    Factory payrolls are coming alive, up 16,000 in July following a 12,000 increase in June. This points to second-half momentum for manufacturing and is a positive wildcard for the economy in general. A similar standout is professional & business services, up 49,000, and within this temporary help services which rose 15,000. Gains here suggest that employers, pressed to find permanent staff, are turning to contractors to keep up with production. Government was a big factor in June, up 37,000, but was quiet in July at a gain of 4,000. Total revisions are a wash with nonfarm payrolls revised 9,000 higher in June and 7,000 lower in May.

    Employment has by far been the strongest factor in the economy and the strength in today’s report will firm conviction among Federal Reserve policy makers that increasing wage gains, and with this increasing inflation, are more likely to hit sooner than later.

    From the household survey:

    If there was a blemish in the month’s numbers, it came from the distribution of jobs to lower-income sectors. Job creation was strongly titled to part-time, which gained 393,000 positions, while full-time fell by 54,000.
    https://www.cnbc.com/2017/08/04/us-nonfarm-payrolls-july-2017.html

    No hint yet of this trend reversing:

    Highlights
    At $43.6 billion, the nation’s trade deficit came in below Econoday’s consensus for $44.4 billion which will prove a plus for second-quarter GDP revisions. The goods gap fell 3.2 percent to $65.3 billion (vs the advance reading of $63.9 billion) while the services surplus, which is the economy’s special strength, rose 2.9 percent to $21.6 billion.

    Exports show a bounce higher for capital goods despite a dip in aircraft. Exports of cars and food were also strong offsetting a decline for consumer goods. Imports of industrial supplies and within this crude oil fell as did imports of consumer goods. This helped offset a sharp rise in car imports. Imports of capital goods were flat.

    The trade gap with China widened nearly $1 billion in June to $32.6 billion and narrowed slightly with the EU to $12.5 billion. The gap with Japan also narrowed slightly, to $5.6 billion, and narrowed sharply with Mexico, by $1.3 billion to $6.0 billion. The gap with Canada also narrowed, to $0.6 billion.

    Except for the widening with China and weakness in consumer-goods exports, this is a positive report showing that cross-border trade ended the quarter with solid improvement.

    M2 includes bank deposits at the Fed and commercial banks, and as loans create deposits, it’s a proxy for bank loan growth. And while it is ‘distorted’ by QE most recently the Fed’s portfolio has be relatively constant. So note the same pattern of deceleration as with bank lending:

    So Trump is winning on this one- more new public sector workers than Obama! ;)

    The public sector grew during Mr. Carter’s term (up 1,304,000), during Mr. Reagan’s terms (up 1,414,000), during Mr. G.H.W. Bush’s term (up 1,127,000), during Mr. Clinton’s terms (up 1,934,000), and during Mr. G.W. Bush’s terms (up 1,744,000 jobs).

    However the public sector declined significantly while Mr. Obama was in office (down 268,000 jobs).

    During the first six months of Mr. Trump’s term, the economy has gained 47,000 public sector jobs.
    Read more at http://www.calculatedriskblog.com/#bXBCMVBXZXBLuHDB.99

    Rig counts seem to have leveled off at current prices. Yes, a bit more is being spent on drilling, and output is up, but oil related capital spending is nowhere near the 2014 growth in oil related spending that was subsequently lost:

    Highlights

    The Baker Hughes North American rig count is down 7 rigs in the August 4 week to 1,171, interrupting its upward climb for only the second time in the last 14 weeks. The U.S. count is down 4 rigs to 954 but is up 490 rigs from the same period last year. The Canadian count is down 3 rigs to 217 but is up 95 rigs from last year.

    For the U.S. count, rigs classified as drilling for oil are down 1 rig to 765 and gas rigs down 3 to 189. For the Canadian count, oil rigs are down 5 rigs to 124 but gas rigs are up 2 to 93.

    Factory orders, ISM services, China investments, ISM NY

    Up nicely but not so good excluding aircraft orders, which are highly volatile:

    Highlights

    Factory orders surged 3.0 percent in June but were skewed higher by a more than doubling in monthly aircraft orders. Excluding transportation equipment, a reading that excludes aircraft, orders actually fell 0.2 percent in the month following a 0.1 decline in May and no change in April. June orders for capital goods (nondefense ex-aircraft) were also weak, unchanged in the month.

    Shipments fell 0.2 percent while inventories rose 0.2 percent, lifting the inventory-to-shipment ratio to a less lean 1.38. A major positive in today’s report is a 1.3 percent surge in unfilled orders which had been flat but are now getting a lift from transportation equipment as well as capital goods industries including machinery and fabrications.

    Turning to nondurable goods, orders slipped 0.3 percent on declines for petroleum and coal. Aircraft are an important part of the factory sector and have been a big plus so far this year, yet outside aircraft the sector is still struggling to get in the air this year.

    This is not inflation adjusted and still well below the highs of the last cycle and below the 2014 highs:


    Less than expected as trumped up expectations fade further:

    Highlights

    Slowing is the call from ISM’s non-manufacturing sample where July results show their least strength since August last year. The composite index slowed by an abrupt 3.5 points in July to 53.9 with new orders down 5.4 points to 55.1 and business activity down 4.9 points to 55.9. Employment is also down, to 53.6 from 55.8 in a reading that does not point to acceleration for tomorrow’s employment report. But strength is still the clear message of this report with inventories rising, delivery times slowing and, very importantly, backlog orders still rising.

    Yet the July edition is a surprise for this report which is usually very consistent with the headline composite in the high to mid 50s and new orders and business activity in the low 60s. The contrast with this morning’s PMI services report is noticeable, one slowing and one accelerating, but the story of the two samples together is positive: moderate growth for the bulk of the economy.


    This could slow things down:

    China issues rules to curb state firms’ overseas investment risks

    Aug 3 (Reuters) — China’s giant SOEs have been leading the country’s “go out” drive with growing overseas investments, but they have encountered low returns on investment and weak profitability, the ministry said. The guidelines will help “strengthen financial management of overseas investment of state-owned enterprises, prevent financial risks and improve investment efficiency,” the ministry said. “The lack of accountability of senior executives for poor or failed investment is one of the reasons that lead to radical decision-making and loss-making deals,” Xu Baoli, director of the research centre at China’s state-owned assets regulator said.

    ISM NY:

    ADP, Euro inflation, Mtg purchase apps, Loan officer survey, Saudi output, jobs

    Highlights

    ADP sees the private payroll reading in Friday’s employment report coming in at 178,000. But ADP has been wild lately, evident in its sharp 33,000 upward revision to June which is now at 191,000. Econoday expectations are calling for 175,000 in private payroll growth in Friday’s report and 178,000 in total nonfarm payroll growth.

    ADP private falling off since year end:

    The now strong euro seems to be keeping a lid on prices via a drop in import prices. Looks to me like this time around the falling dollar is more likely to result in deflation abroad rather than inflation here at home. Also, with China keeping its currency relatively stable vs the dollar and weaker vs the euro, seem like China is targeting the euro area for exports:

    Euro zone producer price inflation slows in June to lowest this year

    By Lucia Mutikani

    Aug 1 (Reuters) — Euro zone prices at factory gates grew in June at their slowest pace this year. Eurostat said industrial producer prices in the 19-country currency bloc increased 2.5 percent on the year in June, slowing from an upwardly revised 3.4 percent rise in May and a 4.3 percent surge in April. Headline inflation was stable at 1.3 percent in July, far from its 2.0 percent peak reached in February, according to preliminary estimates released by Eurostat this week. On the month, prices eased in June by 0.1 percent, in line with market expectations. In May industrial prices went down by 0.3 percent on the month, slightly less than the 0.4 percent fall previously estimated by Eurostat.

    No rebound in mortgage purchase apps this week:

    The seasonally adjusted Purchase Index decreased 2 percent from one week earlier to its lowest level since March 2017. The unadjusted Purchase Index decreased 2 percent compared with the previous week and was 9 percent higher than the same week one year ago. …
    Read more at http://www.calculatedriskblog.com/#AA1sVKDFp3qYGrIX.99

    Confirmation of weakening loan demand by domestic US banks, though some of the deceleration was due to foreign bank competition:

    July 2017 Senior Loan Officer Opinion Survey Indicates Demand For Commercial And Industrial Loans Weakened

    from the Federal Reserve

    The July 2017 Senior Loan Officer Opinion Survey on Bank Lending Practices (SLOOS) addressed changes in the standards and terms on, and demand for, bank loans to businesses and households over the past three months. This summary discusses the responses from 76 domestic banks and 22 U.S. branches and agencies of foreign banks.

    Regarding the demand for C&I loans, a moderate net share of domestic banks reported that demand from large and middle-market firms weakened, while a modest net share of banks reported that demand from small firms did so. The reported reasons for weakening loan demand were less concentrated than the reasons for having eased standards. Each of the following reasons for weaker demand was cited by at least half of the banks that reported weaker demand: shifts in customer borrowing to other bank or nonbank sources and decreases in customers’ needs to finance inventory, accounts receivable, investment in plant or equipment, and mergers or acquisitions.

    Questions on commercial real estate lending. On net, domestic survey respondents indicated that their lending standards for all major categories of CRE loans tightened during the second quarter. In particular, a moderate net fraction of banks reported tightening standards for construction and land development loans and loans secured by multifamily residential properties, while a modest net share of banks reported tighter standards for loans secured by nonfarm nonresidential properties.

    Banks also reported that demand for CRE loans weakened during the second quarter. A modest net fraction of banks reported weaker demand for construction and land development loans and loans secured by multifamily residential properties, while demand for nonfarm nonresidential loans remained basically unchanged on net.

    Meanwhile, a modest net share of foreign banks reported tightening standards for CRE loans. Also, in contrast to the domestic respondents, a significant net share of foreign banks indicated that demand for CRE loans strengthened in the second quarter of 2017.

    Not much happening here as Saudis continue to set price via their discounts to benchmarks, and let their output be demand determined:

    Race to the bottom to see which party can make the stupidest proposals:

    Democrats call for harsh new punishments on companies that outsource jobs