New manufacturers orders, vehicle sales, unemployment claims, rents, oil prices

This component is going nowhere:

Still trying to catch up from the oil capex collapse of 2016 and covid collapse:

Not good:

This is an all time low as people scramble to get extra jobs to deal with higher prices,
like paying rent, for example:

Oil prices taking a breather with the announcements of releases from strategic petroleum reserves.

Price direction, however, is instead set by Saudi OSP premiums to benchmarks which were just raised for the 3rd month and this time to record highs.

This puts a relentless upward bias to prices until Saudi pricing changes, and will propel what’s call inflation as well. And the higher prices can also trigger a sharp recession:

The Commodities Feed: Saudi OSP raised to record highs

CPI, commodity charts

Quite a few price increases, which the media now calls ‘inflation’ even though inflation is a continuous increase in the price level:

The annual inflation rate in the US surged to 6.2% in October of 2021, the highest since November of 1990 and above forecasts of 5.8%. Upward pressure was broad-based, with energy costs recording the biggest gain (30% vs 24.8% in September), namely gasoline (49.6%). Inflation also increased for shelter (3.5% vs 3.2%); food (5.3% vs 4.6%, the highest since January of 2009), namely food at home (5.4% vs 4.5%); new vehicles (9.8% vs 8.7%); used cars and trucks (26.4% percent vs 24.4%); transportation services (4.5% vs 4.4%); apparel (4.3% vs 3.4%); and medical care services (1.7% vs 0.9%). The monthly rate increased to 0.9% from 0.4% in September, also higher than forecasts of 0.6%, boosted by higher cost of energy, shelter, food, used cars and trucks, and new vehicles. source: U.S. Bureau of Labor Statistics

The longer term chart show how so far it’s just a one time blip up:


Quite a few commodities are also looking like it’s been a one time blip up:

Oil prices, however are set by Saudi Arabia working closely with Russia,
so at least for the medium term the price is an entirely political decision:

https://www.dtnpf.com/agriculture/web/AG/news/world-policy/article/2021/11/08/oil-futures-gain-saudi-osp-hike-us

Buy backs, Inflation, Credit applications, Philly Fed

So the question is regarding dividends vs stock buy backs- do stock buy backs cause stocks to be over valued or do dividends cause them to be undervalued?
;)

A Surprising Connection Between the Bull Market and Stock Buybacks

(WSJ) A study published last year in the Financial Analysts Journal, “Net Buybacks and the Seven Dwarfs,” found that net buybacks—the number of shares that companies repurchased across the entire stock market, less the number of new shares issued—explain the bulk of the intermediate- and longer-term differences in stock-market returns around the world. In an analysis of 43 countries’ stock markets between 1997 and 2017, the researchers found that net buybacks explain 80% of the difference in countries’ returns.

Maybe core inflation does start rising after rates are hiked?


Note the 2018 deceleration:


Signs of elevated recession risk here:

Employment

Nice surprise on the upside, though there’s discussion it’s weather-related, as highlighted below. The growth rate moved up some as per the chart shows, but remains in a multi-year downtrend, with the low growth in hourly earnings an indication that demand remains very weak;

Highlights

There’s still no wage inflation underway but the flashpoint may be sooner than later based on unusual strength in the February employment report. Nonfarm payrolls rose an outsized 313,000 which is more than 80,000 above Econoday’s high estimate. Revisions add to the strength, at a net 54,000 for January which is now 239,000 and December which is 175,000.

Strength in construction is a standout in the report as payrolls in the sector surged 61,000 in February following gains in the three prior gains that are all 40,000 and over. Manufacturing is also very strong, up 31,000 for a fifth straight strong gain. Retail, which has been uneven, added 50,000 as did professional & business services where the closely watched temporary help subcomponent spiked 27,000 in a tangible indication that employers are scrambling to fill positions. Government payrolls, which have been weak, added 26,000 to February’s nonfarm total.

Despite all this strength average hourly earnings actually came in below expectations, at only plus 0.1 percent with the year-on-year 3 tenths under the consensus at 2.6 percent. But given how strong demand is for labor, policy makers at the Federal Reserve may not want to risk runaway wage gains as employers try increasingly to attract candidates.

The workweek further points to strength, up 1 tenth to an average 34.5 hours for all employees with the prior month revised 1 tenth higher to 34.4 hours (the private sector workweek rose 2 tenths to 38.8 hours with manufacturing also up 2 tenths to 41.0 hours in a gain that points to strength for next week’s industrial production report).

The unemployment rate held at a very low 4.1 percent as discouraged workers flocked into the jobs market. The labor participation rate is another major headline, up 3 tenths to 63.0 percent and again well beyond high-end expectations.

The sheer strength of the hiring in this report would appear certain to raise expectations for four rate hikes this year as Fed policy makers may begin to grow impatient with their efforts to cool demand.

There was probably a boost from weather in February. According to Chicago Fed economist Francois Gourio: “February was significantly warmer than usual – positive weather effect in today’s NFP of about 80k according to our state model”. Even if weather boosted the NFP report by 80,000 jobs, this was still a strong report. If weather was a factor, we might see some payback in the March report.

Read more at http://www.calculatedriskblog.com/#fjXLw7chlFPWdFbv.99

Factory orders, Trade, Consumer credit, Fed beige book, Las Vegas real estate sales

Highlights

Today’s factory orders report, down 1.4 percent at the headline level but showing life underneath, closes the book on what was a mixed to soft month of January for manufacturing. Aircraft has been a bright spot for the factory sector and mitigates what is a 28 percent downswing in January. Excluding transportation equipment, where aircraft and also motor vehicles are tracked and which were also weak with a 0.5 percent decline, factory orders fell 0.3 percent but follow impressive 0.8 and 0.4 percent gains in the prior two months.

The split between the report’s two main components shows a 0.8 percent rise for nondurable goods — the new data in today’s report where strength is tied to petroleum and coal — and a 3.6 percent drop for durable orders which is 1 tenth less weak than last week’s advance report for this component.

Orders for computers and consumer products are highlights of the report as is a 0.6 percent rise in total shipments. But shipments of core capital goods (nondefense ex-aircraft) are not part of the good news, falling 0.1 percent in the month for a 2 tenth downward revision from the initial reading and which gets business investment off to a slow first-quarter start. And orders for January core capital goods are revised 1 tenth lower to a 0.3 percent decline that follows December’s 0.5 percent dip.

Unfilled orders are another of the report’s weaknesses, down 0.3 percent in a reading that, unlike regional and private surveys, does not point to capacity stresses nor immediate inflationary risks.

This report is a reminder that not all the data on the factory sector are strong and underscores the second straight no change reading in the manufacturing component of the previously released industrial production report for January.


Not a good sign for GDP:

Highlights

The nation’s trade deficit widened sharply in January, to $56.6 billion which is beyond Econoday’s deepest estimate and marks a negative start to first-quarter net exports.

Imports, at $257.5 billion, were unchanged in the month but not exports which fell a sharp 1.3 percent to $200.9 billion. Exports of services were steady at $66.7 billion while exports of goods fell 2.2 percent to $134.2 billion. And here to blame are industrial supplies, which includes primary metals, down $1.3 billion to $41.5 billion and also capital goods, a central focus of U.S. strength that fell $2.6 billion to $44.9 billion and includes a $1.8 billion decline in civilian aircraft exports to $3.8 billion.

Imports show a $2 billion rise in industrial supplies to $47.3 billion and a welcome $0.9 billion decline in consumer goods to $54.6 billion. Petroleum imports rose $2.2 billion to $13.2 billion reflecting both higher volumes and higher prices.

Exports are going to have to pick up in February and March otherwise first-quarter GDP will be fighting uphill against an accelerating trade deficit.

Consumer credit growth was low in 2017 until the what now looks to have been a one time ‘dip into savings’ at year end, with a pronounced flattening most recently:


Low and less than expected, inline with the above bank data above:


So they’ve finally noticed weakness in housing and cars:

Highlights

Reading the Beige Book can be sobering as the latest edition may be weaker than January’s when at least the Dallas Fed was reporting special strength. But now all 12 districts are back in the “modest-to-moderate” camp with especially soft descriptions for auto sales, which are said to be flat or declining in all districts, and also housing and construction which the report says, outside of isolated strength in some nonresidential markets, is being held down by labor and material shortages.

Las Vegas Real Estate in February: Sales Down 4% YoY, Inventory down 31%
by Bill McBride on 3/07/2018 10:59:00 AM

This is a key distressed market to follow since Las Vegas saw the largest price decline, following the housing bubble, of any of the Case-Shiller composite 20 cities.

Read more at http://www.calculatedriskblog.com/#So8QxRxTRVE157Y7.99

Light vehicle sales, Trump tariffs

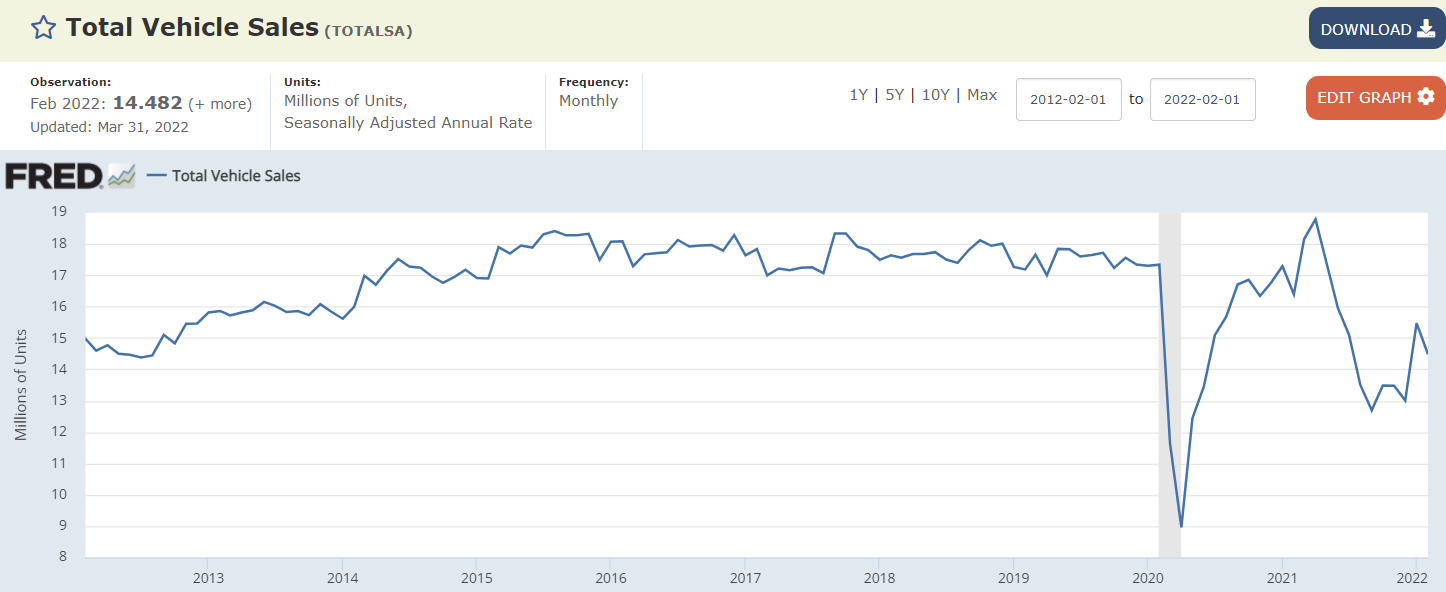
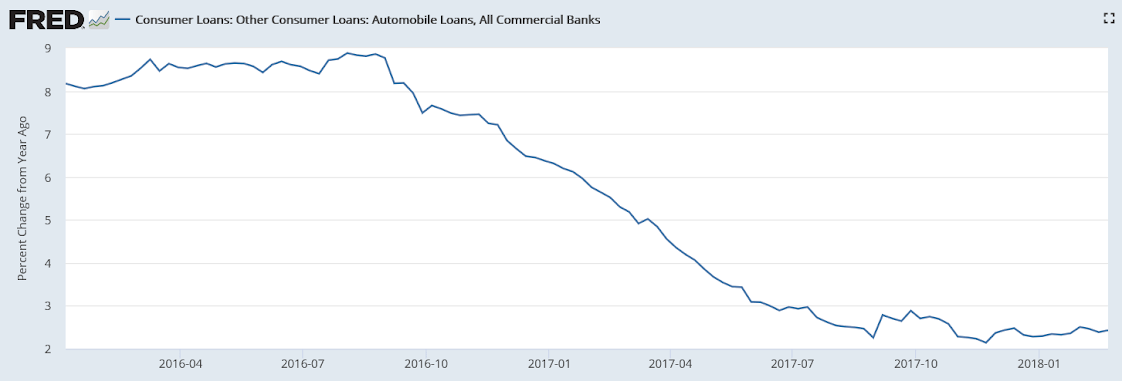
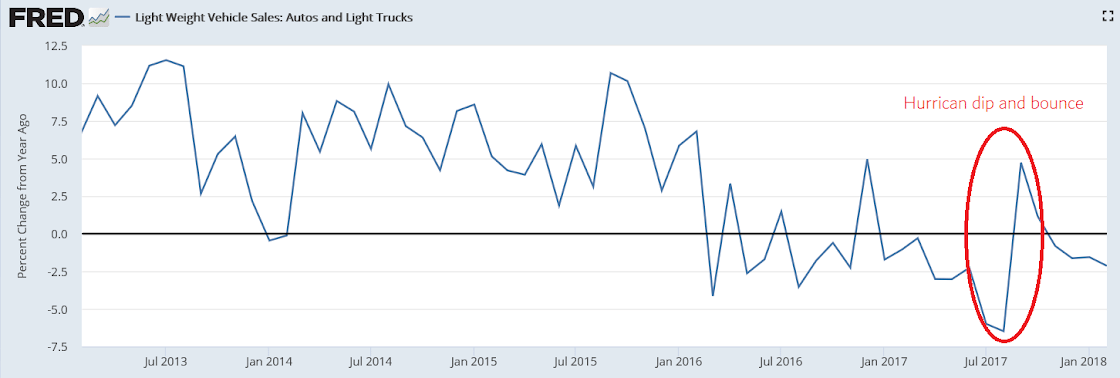
Blaming interest rates for a decline that started about two years ago:

U.S. Car Sales Fall as Credit Terms, Higher Payments Squeeze Buyers (WSJ)

Overall U.S. vehicle sales dropped 2.4% in February, to 1.3 million, according to Autodata Corp. J.D. Power estimates incentive spending in February—averaging $3,850 per vehicle—was down slightly from the same month in 2017. The seasonally adjusted sales pace for the market slipped to 17.1 million on an annualized basis, from 17.5 million a year earlier, according to Autodata. Average monthly payments now exceed $525 a month, according to Edmunds.com, with the online-shopping company estimating that interest rates on new-vehicle loans hit an eight-year high in February.

What best serves public purpose when this is a concern is to require defense needs be sourced domestically while the rest of the economy continues unrestricted:

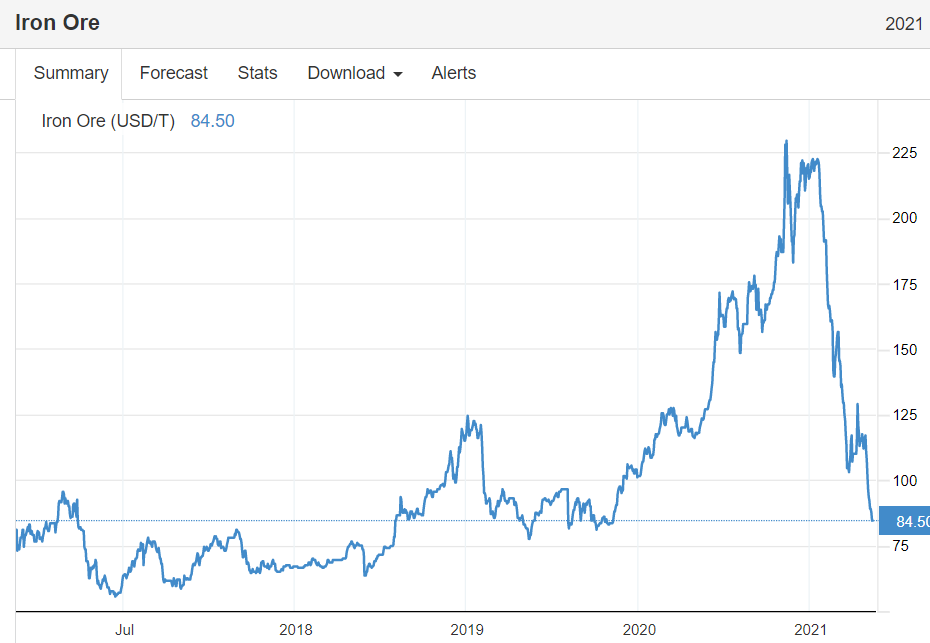
“The premise for the decision, known as Section 232, was on national security grounds. The White House claimed that relying on foreign steel could threaten the U.S. defense industry.”

I wrote this a year or so ago and just modified to keep it current:

Shop to Win!

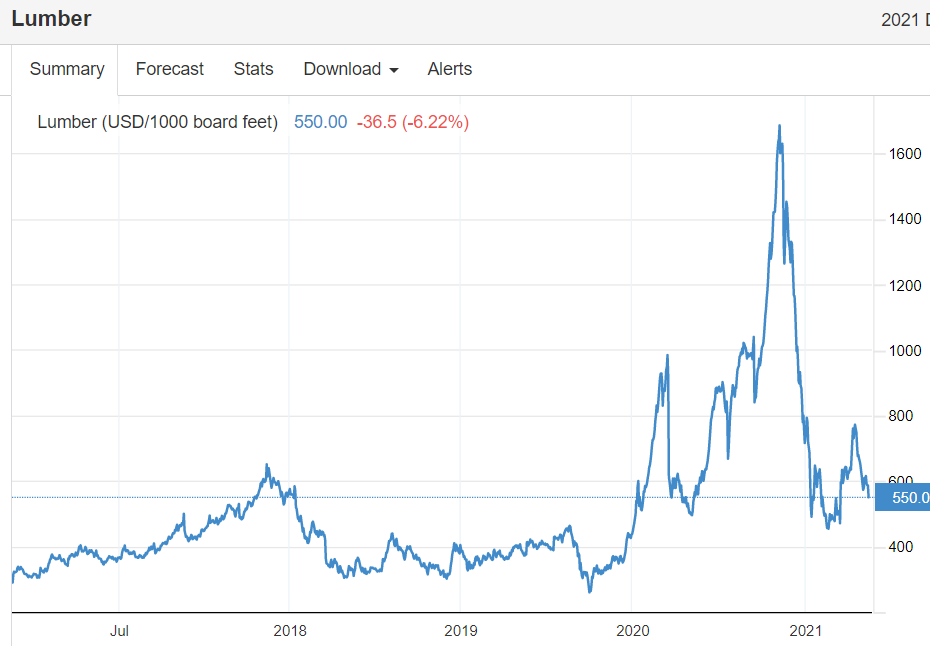
The President no doubt knows that when you go shopping, buying at the lowest price is the mark of a winner, while paying too much is the mark of a loser. Yet when it comes to buying lumber from Canada, cars from Germany, and now steel and aluminum, the President has viciously attacked and is now retaliating against other nations for not charging us enough for their products!

And while everyone knows that buying at the lowest price is a good thing, there is no serious push back from Democrats, the ‘free trade’ Republicans, the media or any of the headline mainstream analysts. There is clearly something very wrong with their underlying mainstream logic that leads to this type of costly Presidential blunder.

Yes, when we buy imports jobs are lost, just as when we replace workers with machines, including lawn mowers, vacuum cleaners, and power washers, jobs are lost. And yet somehow we’ve survived all that. We went from needing 99% of the people working to grow our food to less than 1%, and manufacturing jobs are down to only 7% of the labor force. And yet the remaining 90% of us are not all unemployed, as jobs have proliferated in the service sector, where most of those jobs are now considered to be better jobs than the lost agricultural and manufacturing jobs. Nor has a trade deficit necessarily resulted in higher unemployment or lower pay. In 1999, for example, we had record imports with unemployment under 4% and inflation under 2%, and students were getting recruited for good paying jobs well before graduation.

The answer to sustaining high levels of employment and pay is fiscal policy. If for any reason, including more imports, weak demand at home is keeping unemployment too high or wages too low, the appropriate policy response is fiscal relaxation- either a tax cut or spending increase, even if that increases the public debt- and not to tax or otherwise drive up the cost of imports. Unfortunately however, the policy that allows all of us to pay the lowest prices for imports and have good paying jobs to replace those lost because of imports has been taken entirely off the table by both Republicans and Democrats. Consequently a very good thing for America- lower prices of imports- has been turned into a very bad thing- unemployment, and all because of the fake news about the public debt that is supported by Republicans and Democrats.

The US public debt is nothing more than the dollars spent by the federal government that have not yet been used to pay taxes. Those dollars spent and not yet taxed sit in bank accounts at the Federal Reserve Bank that are called ‘reserve accounts’ and ‘securities accounts’, along with the actual cash in circulation. Treasury securities (bonds, notes, and bills) are nothing more than dollars in securities accounts at the Federal Reserve Bank, functionally the same as dollars in savings accounts or CD’s at commercial banks.

Think of it this way- when the government spends a dollar, that dollar either is used to pay taxes and is lost to the economy, or it’s not used to pay taxes and remains in the economy. Deficit spending adds to those dollars that were spent but not yet taxed, which is called the public debt. And what’s called ‘paying off the debt’ (as happens to 10’s of billions of Treasury securities every month) is just a matter of the Fed shifting dollars from securities accounts to reserve accounts- a simple debit and a credit- all on its own books. (No tax payers or grand children required…) The ‘ability to pay’ is always there- it’s just a debit and a credit to accounts on the books of the Federal Reserve Bank. The fear mongering about the US running out of money or constraints by foreigners is simply not applicable to today’s monetary system.

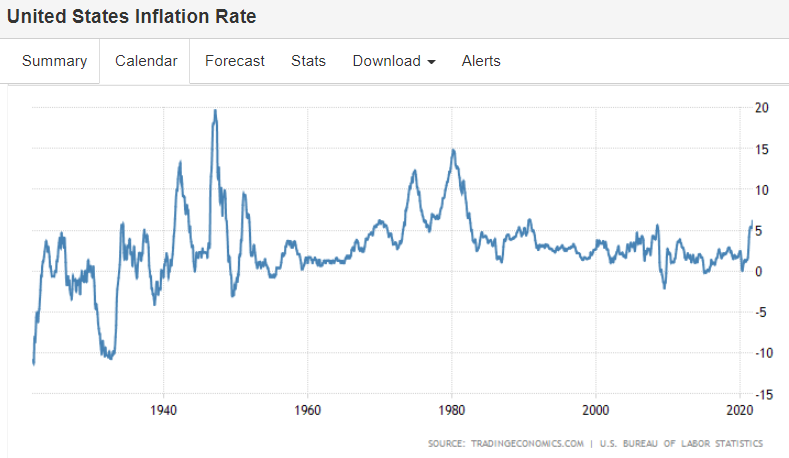
And if you are worried about inflation, our proposal works to lower prices for all of us, while the Presidents direct policy is to raise the prices we all pay.

And if the concern is national security, the policy response that best serves public interest is to order the defense department to require domestic sourcing of what they consider strategically important,
and let the rest of us continue to shop for the lowest possible prices.

Point is, once it’s understood that 1) the public debt is nothing more than what can be called the net money supply 2) there is no risk of default 3) there is no dependence on foreign or any other lenders 4)there is no burden being put on future generations the President will be free to make us all winners by being our shopper in chief who works to get us the lowest possible prices.

Personal income and expenditures, Construction spending

About as expected, with a relatively small increase from the tax cuts, which are a one time event. And the weakness in consumption hints at those receiving the cuts having a low propensity to spend. Also, the still too low personal savings rate suggests continuing weakness:

Highlights

Core inflation did noticeably rise but not more than expected, at 0.3 percent in January but not enough to lift the year-on-year rate which holds at an as-expected 1.5 percent. Total prices, reflecting a rise in gas, rose 0.4 percent with this year-on-year rate also unchanged, at 1.7 percent. These results fit in with the Federal Reserve’s expectations for a gradual upward trend for prices but they don’t accelerate the outlook.

The income side of this report does show the effect of tax changes, as personal taxes fell 3.3 percent in the month to help underpin total income which rose a solid 0.4 percent for a second straight month. The wages & salaries component of income rose 0.5 percent for a second time in three months. Disposable personal income, after holding at 0.3 and 0.4 percent gains in prior months, rose 0.9 percent in January for the largest gain in a year.

Spending data are soft, up only 0.2 percent overall and marking a weak first-quarter start for the consumer. Spending on durable goods fell 1.5 percent on a downturn in vehicle sales offset by a gas-related 1.0 percent rise in non-durable spending and a 0.3 percent increase in service spending.

Reflecting the drop in taxes, the savings rate popped back higher in January, up 7 tenths to 3.2 percent. The gain in income is a positive not only for the savings outlook but the spending outlook as well. This report, despite the monthly weakness in spending, points to economic health, specifically rising income and gradually rising prices.


And another weak bit of hard data:


Manufacturing surveys again not in sync with each other:

ISM: