Central bank liquidity swaps (13) $379,687 – $9,984
[top]

(email exchange)
Cliff,
Martin Wolf is spot on below. Our biggest risk is the reluctance of our leaders to implement the fiscal adjustments on an as needed, size no object, basis to reverse shortfalls in aggregate demand.
>
> On Fri, Feb 20, 2009 at 11:11 AM, Cliff wrote:
>
> Warren,
>
> Many people ask me why Japan did not have large
> inflation with their large deficits,
>
They weren’t even large enough to fully offset the deflationary forces.
>
> and they ask will the U.S. be like Japan or will
> inflation recur in the next few years.
>
Depends on crude prices. If they go up inflation as we know it comes back. This is very likely.
We need a hard policy to cut our imported fuel consumption to prevent ‘inflation’ and declining real terms of trade.
>
> Please see the article below, and can you
> comment on the article and the related two
> questions posed above.
>
> Thanks, Cliff
>
Japan’s lessons for a world of balance-sheet deflation
by Martin Wolf
Feb 17 (Financial Times) — What has Japan’s “lost decade” to teach us? Even a year ago, this seemed an absurd question. The general consensus of informed opinion was that the U.S., the U.K. and other heavily indebted western economies could not suffer as Japan had done. Now the question is changing to whether these countries will manage as well as Japan did. Welcome to the world of balance-sheet deflation.
As I have noted before , the best analysis of what happened to Japan is by Richard Koo of the Nomura Research Institute.* His big point, though simple, is ignored by conventional economics: balance sheets matter. Threatened with bankruptcy, the overborrowed will struggle to pay down their debts. A collapse in asset prices purchased through debt will have a far more devastating impact than the same collapse accompanied by little debt.
Most of the decline in Japanese private spending and borrowing in the 1990s was, argues Mr Koo, due not to the state of the banks, but to that of their borrowers. This was a situation in which, in the words of John Maynard Keynes, low interest rates – and Japan’s were, for years, as low as could be – were “pushing on a string”. Debtors kept paying down their loans.
How far, then, does this viewpoint inform us of the plight we are now in? A great deal, is the answer.
First, comparisons between today and the deep recessions of the early 1980s are utterly misguided. In 1981, U.S. private debt was 123 per cent of gross domestic product; by the third quarter of 2008, it was 290 per cent. In 1981, household debt was 48 per cent of GDP; in 2007, it was 100 per cent. In 1980, the Federal Reserve’s intervention rate reached 19-20 per cent. Today, it is nearly zero.
When interest rates fell in the early 1980s, borrowing jumped. The chances of igniting a surge in borrowing now are close to zero. A recession caused by the central bank’s determination to squeeze out inflation is quite different from one caused by excessive debt and collapsing net worth. In the former case, the central bank causes the recession. In the latter, it is trying hard to prevent it.
Second, those who argue that the Japanese government’s fiscal expansion failed are, again, mistaken. When the private sector tries to repay debt over many years, a country has three options: let the government do the borrowing; expand net exports; or let the economy collapse in a downward spiral of mass bankruptcy.
Despite a loss in wealth of three times GDP and a shift of 20 per cent of GDP in the financial balance of the corporate sector, from deficits into surpluses, Japan did not suffer a depression. This was a triumph. The explanation was the big fiscal deficits. When, in 1997, the Hashimoto government tried to reduce the fiscal deficits, the economy collapsed and actual fiscal deficits rose.
Third, recognising losses and recapitalising the financial system are vital, even if, as Mr Koo argues, the unwillingness to borrow was even more important. The Japanese lived with zombie banks for nearly a decade. The explanation was a political stand-off: public hostility to bankers rendered it impossible to inject government money on a large scale, and the power of bankers made it impossible to nationalise insolvent institutions. For years, people pretended that the problem was downward overshooting of asset price. In the end, a financial implosion forced the Japanese government’s hand. The same was true in the U.S. last autumn, but the opportunity for a full restructuring and recapitalisation of the system was lost.
In the U.S., the state of the financial sector may well be far more important than it was in Japan. The big US debt accumulations were not by non-financial corporations but by households and the financial sector. The gross debt of the financial sector rose from 22 per cent of GDP in 1981 to 117 per cent in the third quarter of 2008, while the debt of non-financial corporations rose only from 53 per cent to 76 per cent of GDP. Thus, the desire of financial institutions to shrink balance sheets may be an even bigger cause of recession in the US.
How far, then, is Japan’s overall experience relevant to today?
The good news is that the asset price bubbles themselves were far smaller in the US than in Japan. Furthermore, the U.S. central bank has been swifter in recognising reality, cutting interest rates quickly to close to zero and moving towards “unconventional” monetary policy.
The bad news is that the debate over fiscal policy in the U.S. seems even more neanderthal than in Japan: it cannot be stressed too strongly that in a balance-sheet deflation, with zero official interest rates, fiscal policy is all we have. The big danger is that an attempt will be made to close the fiscal deficit prematurely, with dire results. Again, the U.S. administration’s proposals for a public/private partnership, to purchase toxic assets, look hopeless. Even if it can be made to work operationally, the prices are likely to be too low to encourage banks to sell or to represent a big taxpayer subsidy to buyers, sellers, or both. Far more important, it is unlikely that modestly raising prices of a range of bad assets will recapitalise damaged institutions. In the end, reality will come out. But that may follow a lengthy pretence.
Yet what is happening inside the US is far from the worst news. That is the global reach of the crisis. Japan was able to rely on exports to a buoyant world economy. This crisis is global: the bubbles and associated spending booms spread across much of the western world, as did the financial mania and purchases of bad assets. Economies directly affected account for close to half of the world economy. Economies indirectly affected, via falling external demand and collapsing finance, account for the rest. The US, it is clear, remains the core of the world economy.
As a result, we confront a balance-sheet deflation that, albeit far shallower than that in Japan in the 1990s, has a far wider reach. It is, for this reason, fanciful to imagine a swift and strong return to global growth. Where is the demand to come from? From over-indebted western consumers? Hardly. From emerging country consumers? Unlikely. From fiscal expansion? Up to a point. But this still looks too weak and too unbalanced, with much coming from the US. China is helping, but the eurozone and Japan seem paralysed, while most emerging economies cannot now risk aggressive action.
Last year marked the end of a hopeful era. Today, it is impossible to rule out a lost decade for the world economy. This has to be prevented. Posterity will not forgive leaders who fail to rise to this great challenge.
[top]
Thanks!
Germany and France touch 100, up from 5 cents not long ago and climbing rapidly.
Ireland on the verge of going parabolic.
| Country | 5yr CDS/10yr CDS |
| Austria | 235/260 -10/0 |
| Belgium | 143/153 -5/0 |
| Finland | 80/95 -1/+2 |
| France | 88/100 -3/0 |
| Germany | 88/100 -1/+1 |
| Greece | 240/270 -20/-8 |
| Ireland | 355/380 -60/25 |
| Italy | 184/194 -10/0 |
| Netherlands | 123/135 -5/0 |
| Norway | 50/60 -3/+2 |
| Portugal | 140/150 -10/-2 |
| Spain | 148/160 -10/-2 |
| Sweden | 136/150 -5/0 |
| UK | 150/165 -5/0 |
| US | 90/105 -3/0 |
[top]
So how do we pay off those Treasury securities held by China?
Treasury securities are held in accounts at the US Federal Reserve.
Let’s assume $1 billion of Treasury securities held by China comes due tomorrow.
Here’s what would happen tomorrow:
The US Federal Reserve keeps the books and increases and decreases these balances just by changing the numbers on its books.
That’s how it is and has always been.
Paying off the Federal debt is nothing more than debiting a securities account and crediting a member bank account at the Fed.
[top]
This is the paper being presented next week in DC.
Please distribute.
Comments welcome!
This is how it begins:
Comments on the FASB Exposure Drafts relating to “Comprehensive Long-term Projections for the U.S. Government (ED 1)” and to “Accounting for Social Insurance. (ED 2)”
Testimony Submitted by:
James K. Galbraith, Lloyd M. Bentsen, Jr., Chair in Government/Business Relations, Lyndon B. Johnson School of Public Affairs, The University of Texas at Austin, Austin
TX 78712 and Senior Scholar, Levy Economics Institute.
L. Randall Wray, Professor of Economics, the University of Missouri-Kansas City, and Senior Scholar, Levy Economics Institute.
Warren Mosler, Senior Associate Fellow, Cambridge Center for Economic and
Public Policy, Department of Land Economy, University of Cambridge, and Valance Co., St Croix, USVI.
Date: February 25, 2009
In this testimony we supplement our earlier letter, which responded to specific questions on the first exposure draft. Here we set out general principles of federal budget accounting, and then we offer specific comments on the proposed reporting procedures in both of the exposure drafts.
General Principles of Federal Budget Accounting
Even though some principles of accounting are universal, federal budget accounting has never followed and should not follow the exact procedures adopted by households or business firms. There are several reasons why this is true.
First, the government’s interest is the public interest. The government is there to provide for the general welfare, and there is no correlation between this interest and a position of surplus or deficit, nor of indebtedness, in the government’s books.
Second, the government is sovereign. This fact gives to government authority that households and firms do not have. In particular, government has the power to tax and to issue money. The power to tax means that government does not need to sell products, and the power to issue currency means that it can make purchases by emitting IOUs. No private firm can require that markets buy its products or its debt. Indeed taxation creates a demand for public spending, in order to make available the currency required to pay the taxes. No private firm can generate demand for its output in this way. Neither of these statements is controversial; both are matters of fact. Nor should they be construed to imply that government should raise taxes or spend without limit. However, they do imply that federal budgeting is different from private budgeting, and should be considered in its proper, public context.
While it is common to regard government tax revenue as income, this income is not comparable to that of firms or households. Government can choose to exact greater tax revenues by imposing new taxes or raising tax rates. No firm can do this; even firms with market power know that consumers will find substitutes if prices are raised too much. Moreover firms, households, and even state and local governments require income or borrowings in order to spend. The federal government’s spending is not constrained by revenues or borrowing. This is, again, a fact, completely non-controversial, but very poorly understood.
The federal government spends by cutting checks – or, what is functionally the same thing, by directly crediting private bank accounts. This is a matter of typing numbers into a machine. That is all federal spending is. Unlike private firms, the federal government maintains no stock of cash-on-hand and no credit balance at the bank. It doesn’t need to do so. There are surely limits of wisdom and prudence on federal spending, as well as numerous checks, balances, and self-imposed constraints, but there is no operational limit. The federal government can, and does, spend what it wants.
Tax receipts debit bank accounts. So does borrowing from the public. These are operationally distinct from spending. There is no operational procedure through which federal government “uses” tax receipts or borrowings for its spending. If, perchance, one chooses to pay taxes in cash, the Treasury simply issues a receipt and shreds the cash. It has no need for the income in order to spend. This is why it is a mistake to look at federal tax receipts as an equivalent concept to income of households or firms.
As we discuss below, federal government spending has exceeded tax revenues, with only brief exceptions, since the founding. There is no evidence, nor any economic theory, behind the proposition that federal government spending ever needs to match federal government tax receiptsâ€â€Âover any period, short or long. The deficit per unit time is the difference between taxing and spending over that time. To repeat, the taxing on the one hand and the spending on the other are operationally independent. Any reasonable observer should conclude that federal government spending is not, and need not be, dependent on, constrained by (or even related to) tax revenues in the way that the spending of households or firms is related to their incomes.
The difference between microeconomic and macroeconomic accounting is also pertinent. An individual household or firm has a balance sheet that consists of its assets and liabilities. The spending of that household or firm is constrained, in a fairly concrete sense, by its income and by its balance sheet by its ability to sell assets or to borrow against them. It is meaningful to say that its ability to deficit-spend is constrained: a household must get the approval of a bank before spending can exceed income, and therefore its borrowing is subject to banking norms. But if we take households or firms as a whole, the situation is different. The private sector’s ability to deficit-spend, to spend more than its income, depends on the willingness of another sector to spend less than its income. For one sector to run a deficit, another must run a surplus. This surplus is called saving – claims against the deficit sector. In principle, there is no reason why one sector cannot run perpetual deficits, so long as at least one other sector wants to run surpluses.
[top]
This kind of fiscal drag is highly counterproductive.
German January Tax Revenue Increases 3.4 Percent, Ministry Says
by Rainer Buergin
Feb 20 (Bloomberg) — German tax revenue rose 3.4 percent in January to 39.1 billion euros ($49.6 billion), led by flows to Finance Minister Peer Steinbrueck’s federal coffers, the Finance Ministry said in its monthly report.
Intake at federal level increased 8.5 percent to 15.9 billion euros while the country’s 16 states reaped 18.5 billion euros, 2.1 percent more than a year earlier, the report showed. Germany’s budget plans call for a tax revenue increase of 2.1 percent for the year as a whole, compared with 2008.
“The cooling world economy has by now fully impacted on Germany’s domestic economy,” the ministry said. “The worsening of the situation and the outlook for the manufacturing industry” suggest that “the recession will continue.”
Forward-looking economic indicators suggest the German economy will shrink in the first quarter after contracting 2.1 percent in the final three months of last year, a drop that was bigger than expected, the ministry said.
[top]
Good news for cutting crude consumption some day, bad news for GM.
Chery Unveils Plug-in Hybrid, Trumps GM Volt’s Range
by Tian Ying
Feb 20 (Bloomberg) — Chery Automobile Co., China’s largest maker of own-brand cars, unveiled its first plug-in hybrid, touting a range more than twice as far as General Motors Corp.’s planned Volt.
The S18 can travel as much as 150 kilometers (93 miles) using just its batteries, Chery said in a statement posted on its Web site yesterday. GM’s Volt, due to go on sale next year, has a range of 64 kilometers. Chery has no timetable as yet on when the S18 will go on sale, spokesman Jin Yibo said in an interview by phone today.
China has encouraged domestic automakers to develop alternative-energy vehicles to curb oil imports and pollution, as well as to help the local industry challenge GM and Toyota Motor Corp. overseas. BYD Co., the Chinese automaker backed by billionaire Warren Buffett, started selling the world’s first mass-produced plug-in hybrid in December.
The Chinese government plans to support domestic automakers’ research into alternative-energy vehicles in a bid to have 60,000 on the roads of 10 cities by 2012, Science Minister Wan Gang said in November.
Automobiles account for about half of the total oil consumption in China, the world’s largest vehicle market behind the U.S. That may rise to 60 percent by 2020, according to the Development Research Center of the State Council.
Plug-in cars can be recharged from standard household powerpoints. The S18 can be fully charged in as little as four hours and be 80 percent powered via a quick charge at a specialist station in 30 minutes, Chery said.
Subsidies
BYD’s F3 DM can run for 100 kilometers using only batteries. It takes as little as seven hours to fully charge and can be 50 percent powered via a quick charge at a specialist station in 10 minutes.
To help support the development of alternative-energy technologies, the Chinese government plans to give out subsidies of as much as 600,000 yuan ($88,000) per vehicle to public- transport operators and government agencies to help fund purchases of electric, hybrid and fuel-cell automobiles.
Chrysler LLC, the third-largest U.S. automaker, is forecasting sales of battery-powered cars exceeding 100,000 a year by 2013 and GM is counting on selling 60,000 of its first such model in the year after it goes on sale in 2010.
Gasoline-electric hybrids and other electric vehicles made up 2.2 percent of the U.S. market in 2007, according to J.D. Power & Associates, which expects that share to expand to 7 percent by 2015.
[top]
Met Richard years ago. Seems he’s still confused on fiscal policy:
Bond issues to fund capital injections will not lead to higher interest rates
Right! The CB sets rates. Too bad he didn’t stop here rather than try to explain the process.
Japan’s second round of capital injections was four times the size of the first, and some question the ability of US capital markets to absorb such a large emission of government debt. However, the 1989 S&L crisis demonstrated that funds raised for the purpose of rescuing the financial sector will not lead to higher interest rates.
True!
This is because, unlike fiscal outlays for public works, money spent to rescue the financial system does not reduce the amount of investment funds available in the financial markets.
Huh???
Assume, for example, that the government issues $100 of Treasury bonds to recapitalize a troubled bank.
And then makes a payment to the bank.
The bank receiving the capital injection would credit its capital account by $100 and then invest that $100. In effect, there will be $100 in the market to be invested regardless of whether the government issues debt to rescue the bank.
The $100 gets credited to the banks account at the CB. The bank can leave it there or look for alternatives.
Purchases of alternatives in the private sector cause the banks $100 to be ‘wire transferred’ to another bank.
That means the bank’s account at the CB is reduced by $100 and another bank’s account at the CB is increased by $100.
Because the $100 represents capital, the bank’s investment should be liquid and easily convertible into cash. The asset that best fills this bill is government securities
Ok.
If the bank decides to buy government debt with the money, the government will have another $100 to fund a capital injection.
I assume he means new government debt as he started with the government issuing $100 of bonds and recapitalizing the bank.
Two rubs.
The government would only issue additional bonds if it wanted to (deficit) spend additional funds.
And it if wanted to issue bonds and (deficit) spend new funds, it would do so whether this particular bank wanted to buy the bonds or not. That is, the bank wanting to buy bonds is not the enabling force for (deficit) spending.
The sale of the original $100 of bonds reduced total bank reserves by $100 and the payment of the $100 to the bank added $100 to total bank reserves. So the initial bond issue and the recapitalization left bank reserves offset each other leaving total bank reserves unchanged. Institutionally, issuing new bonds starts a new series of transactions, and, again, that particular bank is not the enabling force.
If, on the other hand, the government uses that $100 to build bridges or roads, that money will leave the capital markets and be spent on wages or construction materials, producing a corresponding decrease in the amount of investment funds available.
I don’t follow this distinction at all.
In this case, as before, the Treasury borrowing $100 reduces bank balances at the CB by $100, and the Treasury spending $100 as above adds $100 to bank balances at the CB, leaving total bank balances (reserves) unchanged.
In short, money spent on public works projects leads to higher interest rates because it does not find its way back to the capital markets.
Not the case, interest rates go to where the CB sets them, one way or another.
[top]
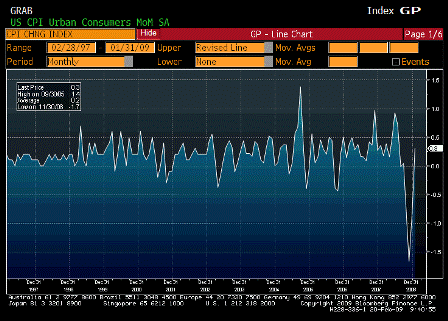
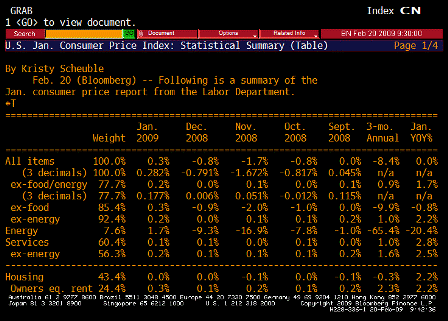
| Survey | 0.3% |
| Actual | 0.3% |
| Prior | -0.7% |
| Revised | -0.8% |
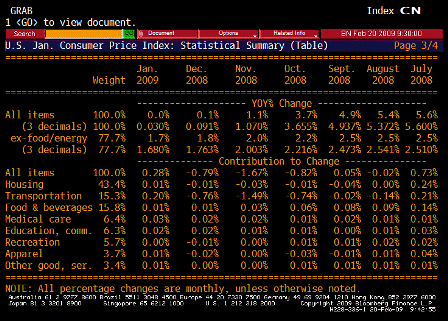
Karim writes:
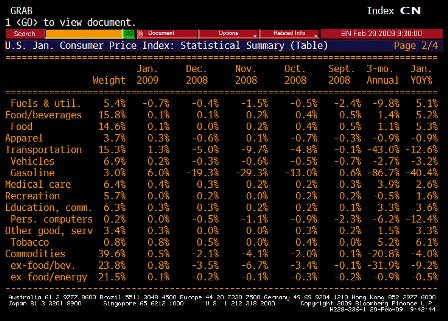
CPI boosted by OER and tobacco.
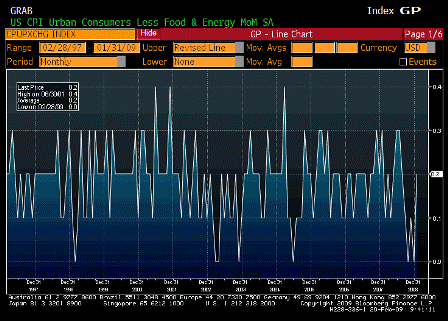
| Survey | 0.1% |
| Actual | 0.2% |
| Prior | 0.0% |
| Revised | n/a |
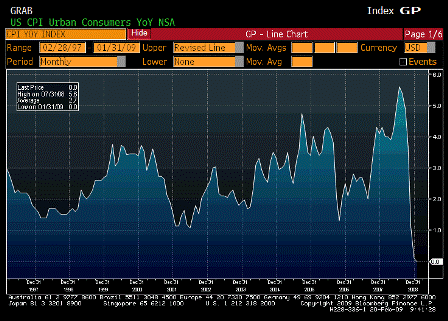
| Survey | -0.1% |
| Actual | 0.0% |
| Prior | 0.1% |
| Revised | n/a |
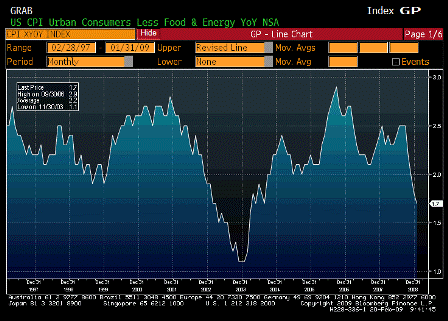
| Survey | 1.5% |
| Actual | 1.7% |
| Prior | 1.8% |
| Revised | n/a |
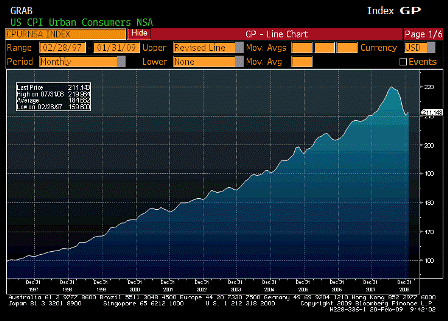
| Survey | 211.081 |
| Actual | 211.143 |
| Prior | 210.228 |
| Revised | n/a |
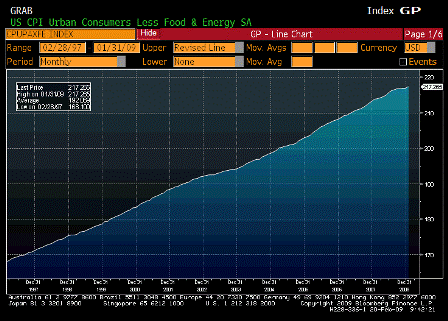
| Survey | n/a |
| Actual | 217.265 |
| Prior | 216.816 |
| Revised | 216.882 |
[top]