2009-05-12 USER


[Skip to the end]


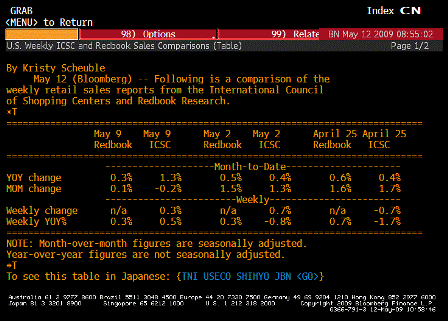
ICSC UBS Store Sales YoY (May 12)

Survey n/a
Actual 0.5%
Prior -0.8%
Revised n/a

[top][end]

ICSC UBS Store Sales WoW (May 12)

Survey n/a
Actual 0.3%
Prior 0.7%
Revised n/a

[top][end]

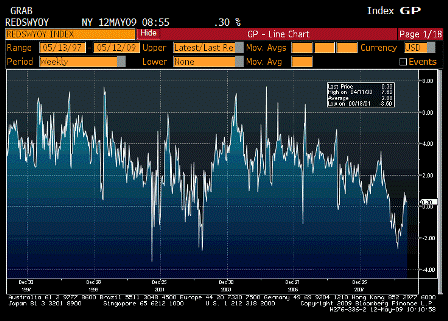
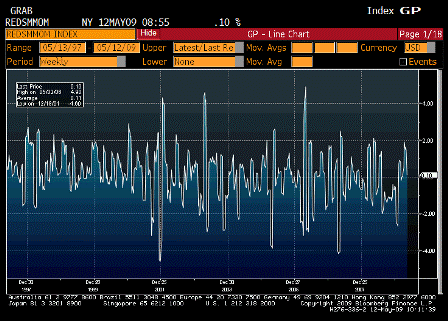
Redbook Store Sales Weekly YoY (May 12)

Survey n/a
Actual 0.3%
Prior 0.3%
Revised n/a

[top][end]

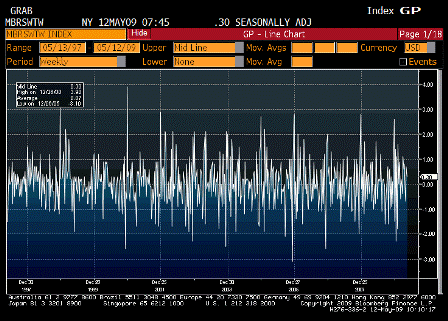
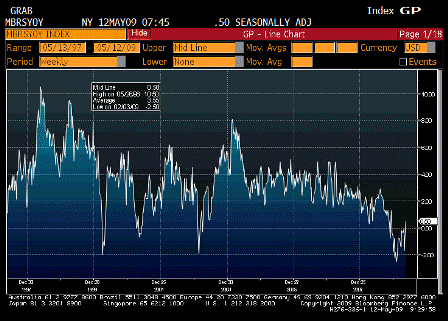
Redbook Store Sales MoM (May 12)

Survey n/a
Actual 0.1%
Prior 1.5%
Revised n/a

[top][end]

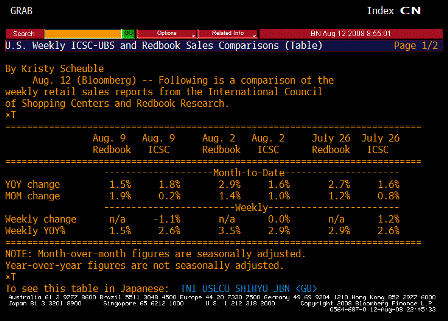
ICSC UBS Redbook Comparison TABLE (May 12)

[top][end]


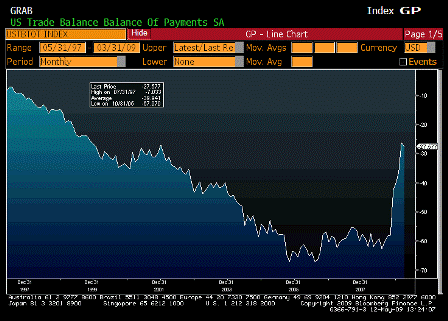
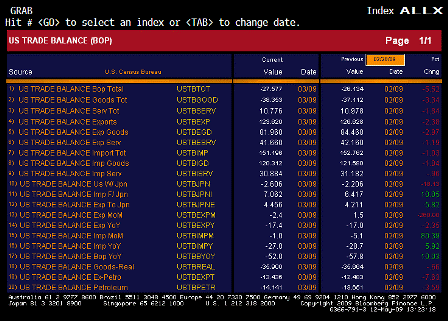
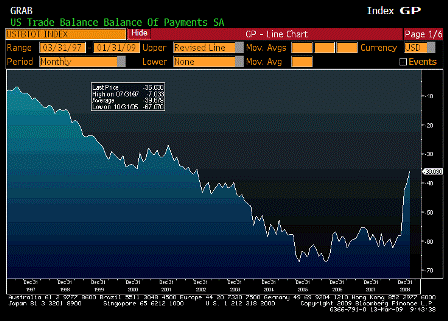
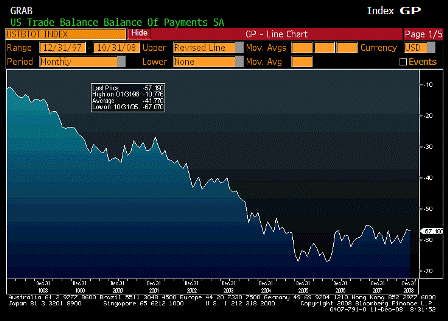
Trade Balance (Mar)

Survey -$29.0B
Actual -$27.6B
Prior -$26.0B
Revised -$26.1B

[top][end]

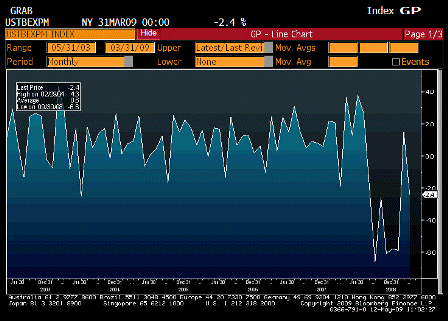
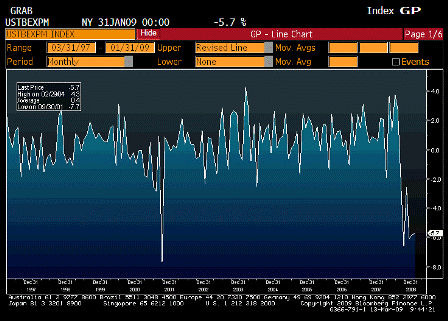
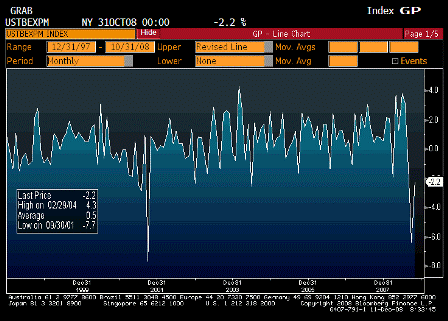
Exports MoM (Mar)

Survey n/a
Actual -2.4%
Prior 1.5%
Revised n/a

[top][end]

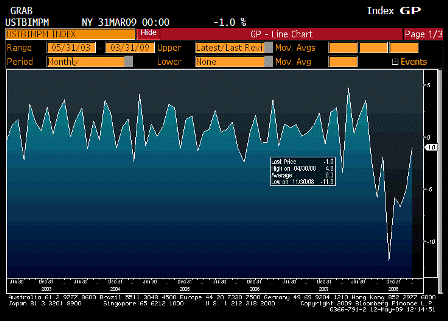
Imports MoM (Mar)

Survey n/a
Actual -1.0%
Prior -5.1%
Revised n/a

[top][end]

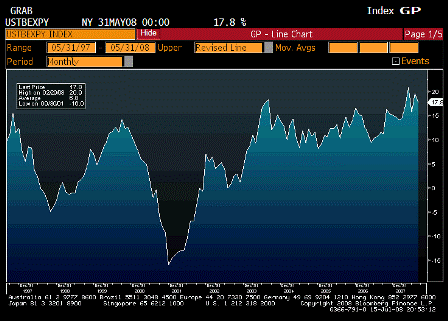
Exports YoY (Mar)

Survey n/a
Actual -17.0%
Prior -17.4%
Revised n/a

[top][end]

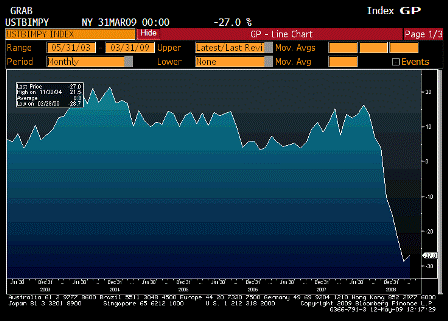
Imports YoY (Mar)

Survey n/a
Actual -27.0%
Prior -28.7%
Revised n/a

[top][end]

Trade Balance ALLX (Mar)

[top][end]


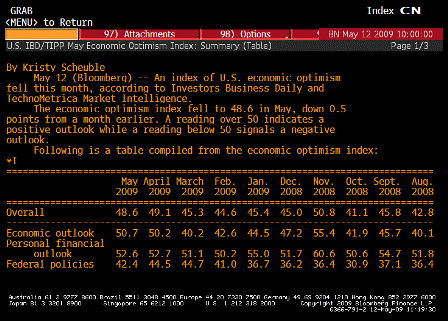
IBD TIPP Economic Optimism (May)

Survey 51.0
Actual 48.6
Prior 49.1
Revised n/a

[top][end]


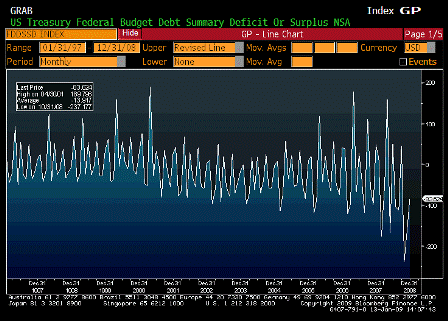
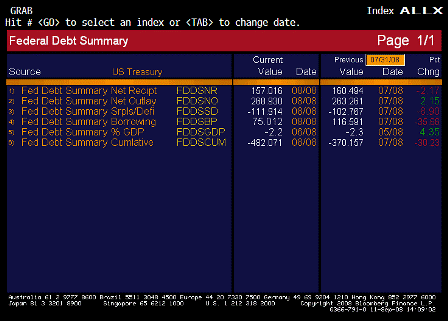
Monthly Budget Statement (-)

Survey
Actual
Prior
Revised

[top][end]

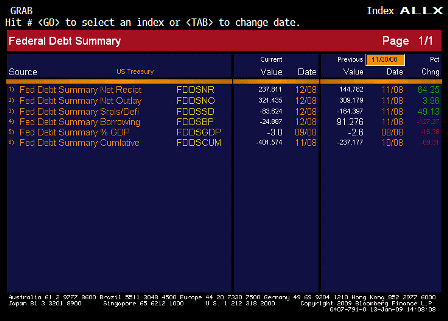
Monthly Budget Statement ALLX (-)


[top]

2009-04-09 USER


[Skip to the end]

Karim writes:

View on US EconomySharp drawdown of inventories to lead to restocking to lead to positive contribution to Q2 growth (which will still be negative overall). This has reduced ‘depression’ view in markets. But fact remains that consumer spending (70% of GDP) will remain dire for some time as: labor market remains in tatters, massive household wealth loss from equities/housing, and savings rate continues to climb.

Savings is being fed by the growing deficit spending so that consumption and savings can now be sustained, as some of the recent consumption numbers seem to indicate. So flat consumption (off a low base) and any inventory build (off an extremely low base) has a chance of getting q2 to modestly positive gdp.

Fiscal policy will help.

Yes, adding more than 6% to gdp in q2 from where it would have been other wise.
That’s historically been sufficient to restore gdp to positive territory and fuel the next credit boom.

But with massive output gap (-7% according to CBO last week), economy faces deflationary threat for period ahead (see Fed minutes from yesterday). Fed to keep rates near zero through at least 2010.

Europe

  • German industrial production -2.9% in Feb (after -6.1% in Jan) and Italian industrial production -3.5% in Feb
  • Looks like Q1 at least -6 to -7% for European GDP

Yes, they recover only well after we do.

Report today calling for another 25bp cut to 1% in May, plan to announce framework to buy corporates, no clarity if 1% to be the low for o/n money.

ECB also ‘low for long’: Austrian Governor Nowotny today stated he expects inflation to remain below the ECB’s 2% target over the ‘medium term’, giving the bank room to keep rates at historically low levels for ‘some time’.

Other labor markets weakening sharply as well:

  • Chief Economist of Economic and Social Institute (affiliated with Japanese Cabinet Office) stated unemployment in Japan could climb from 3milllion to 5million between July and December this year
  • Canadian employment down 61k in March (was down over 90k prior month) and unemployment rate up from 7.7% to 8.0%
  • Australian employment down 34k in March, with unemployment rate rising from 5.2% to 5.7%
  • Both looking to substantial fiscal support as well.
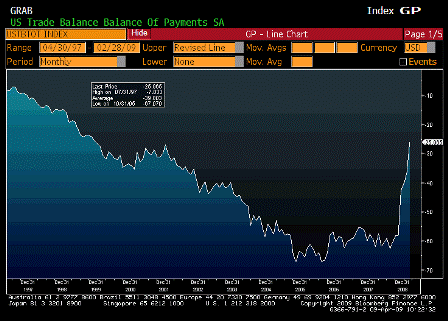

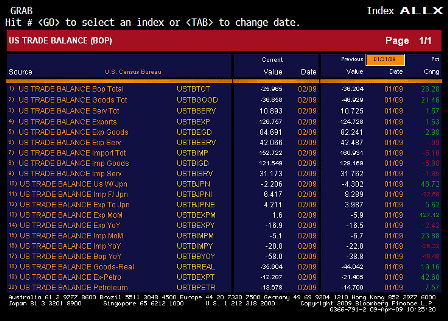
    Trade Balance (Feb)

    Survey -$36.0B
    Actual -$26.0B
    Prior -$36.0B
    Revised -$36.2B

     
    Karim writes:

    • Surprise was trade balance improving from -36.bn to -26bn (-44bn to -35bn in real terms)
    • But cause for improvement was 5.1% collapse in imports (not caused by energy); capital goods imports -6%; industrial supplies -9.3%; consumer goods -3.9% and not a sign of a healthy economy

    Right, imports should be picking back up with April numbers which won’t be out for quite a while as the additional fiscal adjustments pile on to the automatic stabilizers which already may have the deficit north of 6$ of gdp annually.

    [top][end]
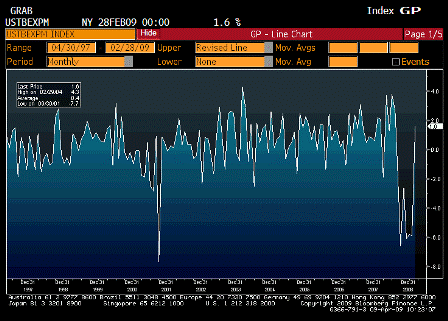
    Exports MoM (Feb)

    Survey n/a
    Actual 1.6%
    Prior -5.9%
    Revised n/a

     
    Karim writes:

  • Exports up 1.6% after 20% fall in prior 4mths
  • [top][end]

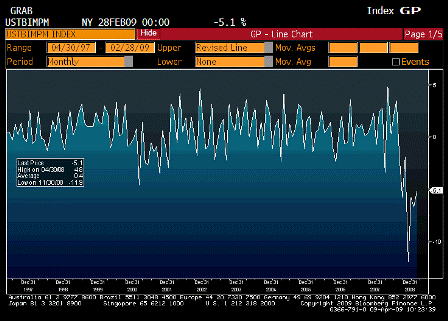
    Imports MoM (Feb)

    Survey n/a
    Actual -5.1%
    Prior -6.7%
    Revised n/a

    [top][end]

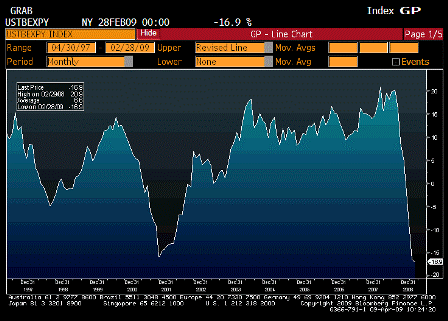
    Exports YoY (Feb)

    Survey n/a
    Actual -16.9%
    Prior -16.5%
    Revised n/a

    [top][end]

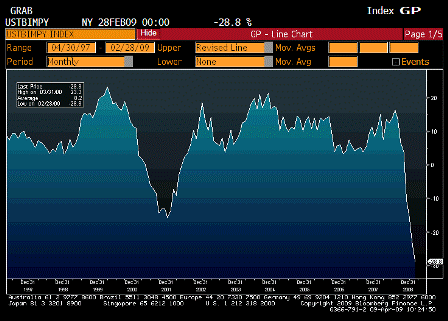
    Imports YoY (Feb)

    Survey n/a
    Actual -28.8%
    Prior -22.8%
    Revised n/a

    [top][end]

    Trade Balance ALLX (Feb)

    [top][end]
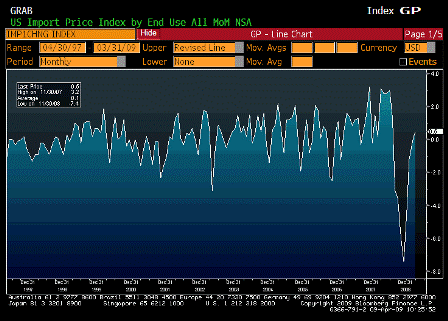

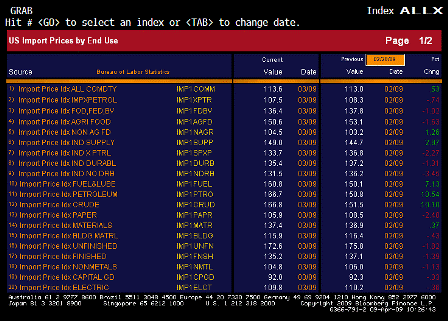
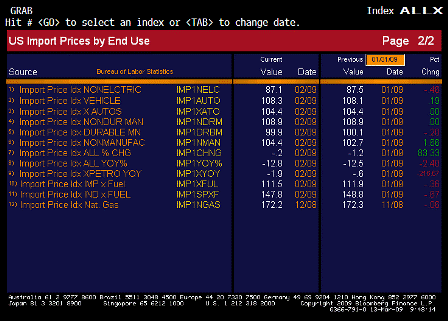
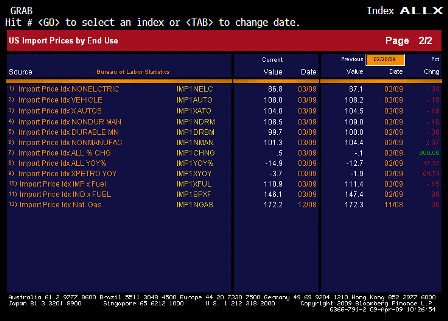
    Import Price Index MoM (Mar)

    Survey 0.9%
    Actual 0.5%
    Prior -0.2%
    Revised -0.1%

     
    Karim writes:

  • Import prices up 0.5%, -0.7% ex-petroleum, and -0.6% from China.
  • Yes, any recovery will see crude prices pushing up the inflation indicators, however recent Saudi price cuts may indicate this could be delayed some.

    [top][end]
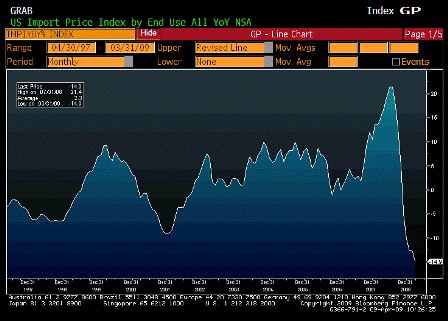
    Import Price Index YoY (Mar)

    Survey -14.7%
    Actual -14.9%
    Prior -12.8%
    Revised -12.7%

    [top][end]

    Import Price Index ALLX 1 (Mar)

    [top][end]
    Import Price Index ALLX 2 (Mar)

    [top][end]
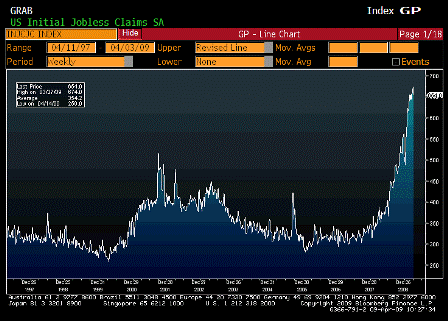

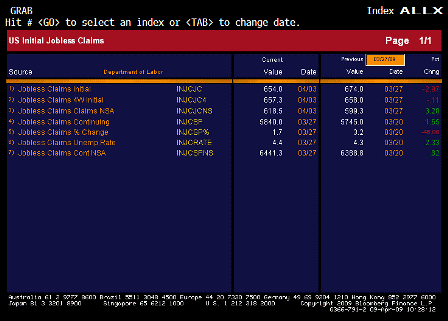
    Initial Jobless Claims (Apr 4)

    Survey 660K
    Actual 654K
    Prior 669K
    Revised 674K

     
    Karim writes:

  • Initial claims down 20k to 654k from upwardly revised prior week 674k; continuing claims continue to defy gravity, rising another 112k
  • While unemployment will continue to go up until nominal growth exceeds productivity increases, claims should start falling soon.

    [top][end]
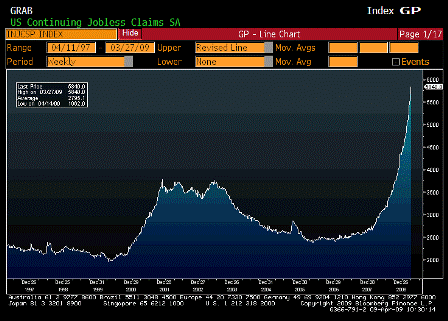
    Continuing Claims (Mar 28)

    Survey 5800K
    Actual 5840K
    Prior 5728K
    Revised 5745K

    [top][end]

    Jobless Claims ALLX (Apr 4)


    [top]
2009-03-13 USER


[Skip to the end]


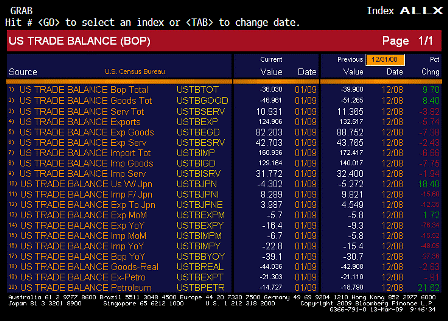
Trade Balance (Jan)

Survey -$38.0B
Actual -$36.0B
Prior -$39.9B
Revised n/a

[top][end]

Exports MoM (Jan)

Survey n/a
Actual -5.7%
Prior -5.8%
Revised n/a

[top][end]

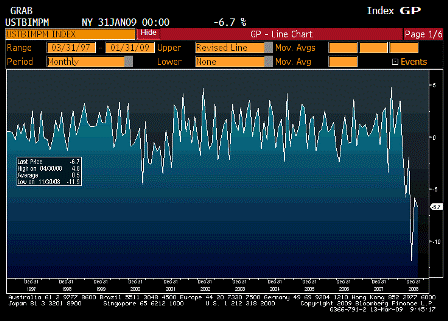
Imports MoM (Jan)

Survey n/a
Actual -6.7%
Prior -5.8%
Revised n/a

[top][end]

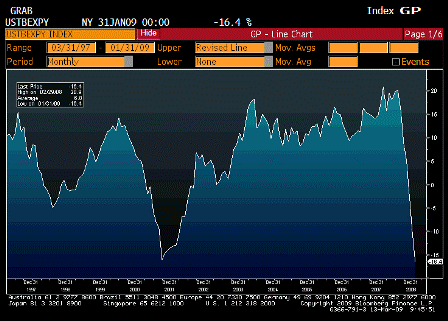
Exports YoY (Jan)

Survey n/a
Actual -16.4%
Prior -9.3%
Revised n/a

[top][end]

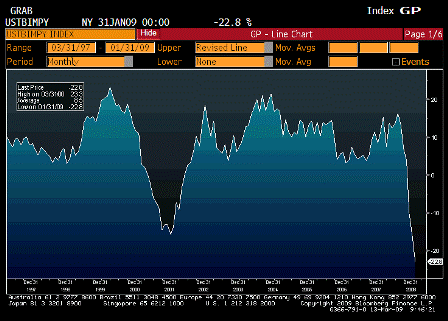
Imports YoY (Jan)

Survey n/a
Actual -22.8%
Prior -15.4%
Revised n/a

[top][end]

Trade Balance ALLX (Jan)

[top][end]


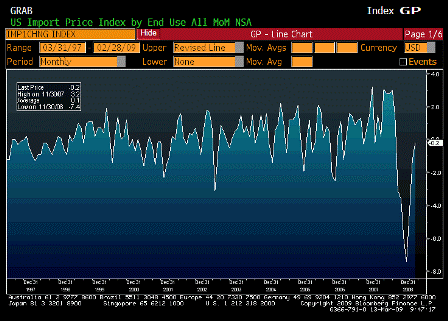
Import Price Index MoM (Feb)

Survey -0.7%
Actual -0.2%
Prior -1.1%
Revised -1.2%

[top][end]

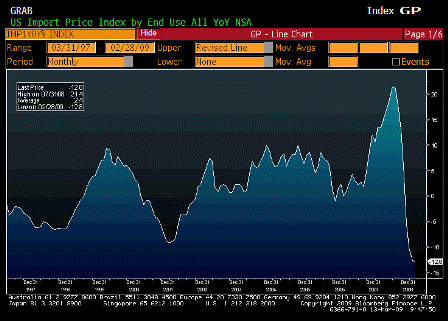
Import Price Index YoY (Feb)

Survey -13.5%
Actual -12.8%
Prior -12.5%
Revised -12.5%

[top][end]

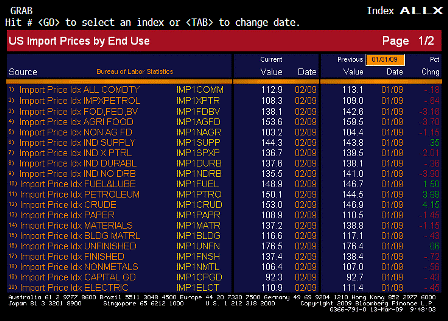
Import Price Index ALLX 1 (Feb)

[top][end]

Import Price Index ALLX 2 (Feb)

[top][end]


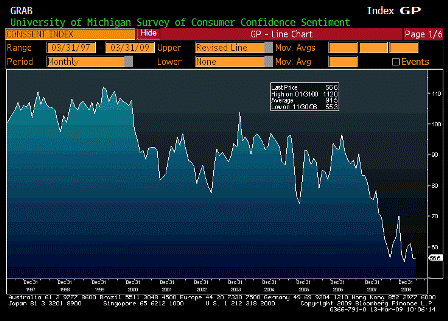
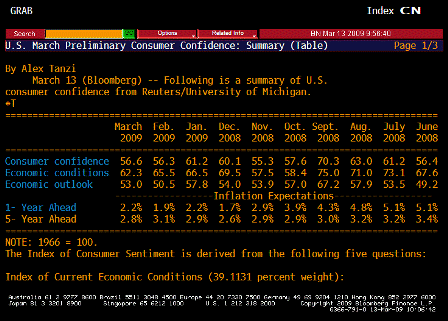
U of Michigan Confidence (Mar P)

Survey 55.0
Actual 56.6
Prior 56.3
Revised n/a

[top][end]

U of Michigan TABLE Inflation Expectations (Mar P)


[top]
2009-02-11 USER


[Skip to the end]


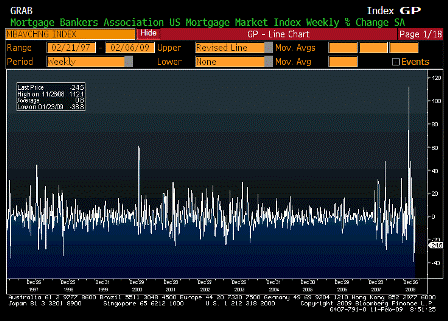
MBA Mortgage Applications (Feb 6)

Survey n/a
Actual -24.5%
Prior 8.6%
Revised n/a

[top][end]

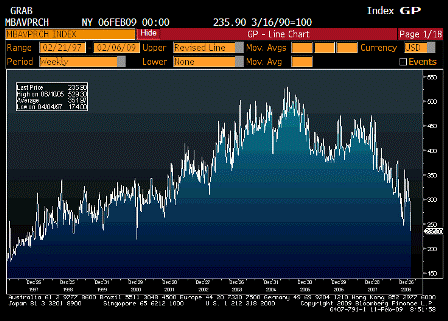
MBA Purchasing Applications (Feb 6)

Survey n/a
Actual 235.90
Prior 261.40
Revised n/a

[top][end]

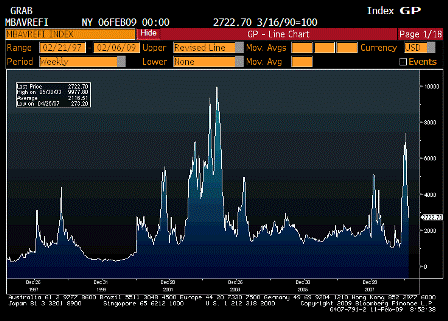
MBA Refinancing Applications (Feb 6)

Survey n/a
Actual 2722.70
Prior 3906.30
Revised n/a

[top][end]

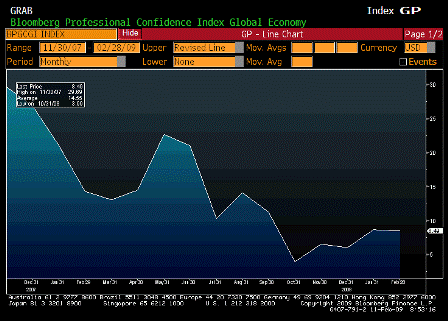
Bloomberg Global Confidence (Feb)

Survey n/a
Actual 8.49
Prior 8.72
Revised n/a

[top][end]

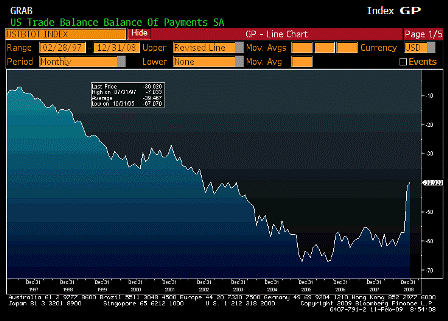
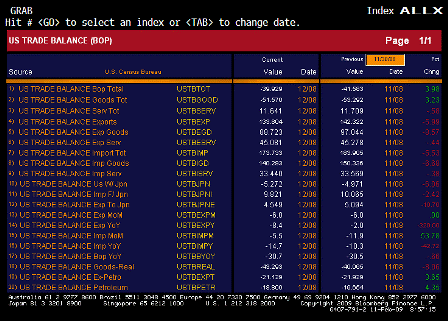
Trade Balance (Dec)

Survey -$35.7B
Actual -$39.9B
Prior -$40.4B
Revised -$41.6B

[top][end]

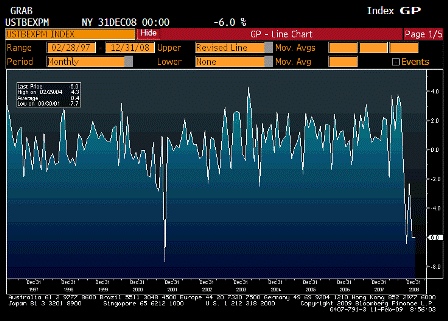
Exports MoM (Dec)

Survey n/a
Actual -6.0%
Prior -6.0%
Revised n/a

[top][end]

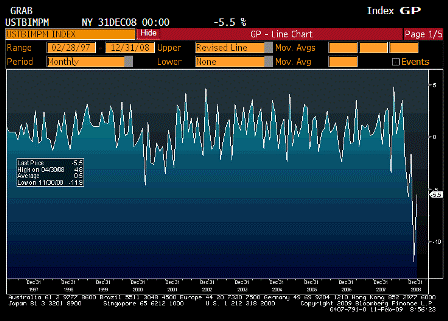
Imports MoM (Dec)

Survey n/a
Actual -5.5%
Prior -11.9%
Revised n/a

[top][end]

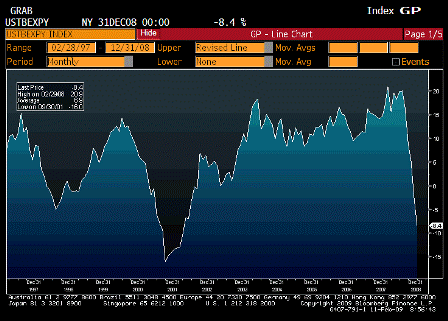
Exports YoY (Dec)

Survey n/a
Actual -8.4%
Prior -2.0%
Revised n/a

[top][end]

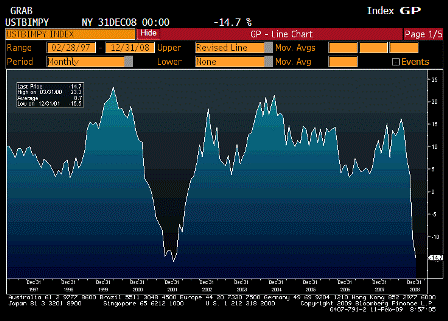
Imports YoY (Dec)

Survey n/a
Actual -14.7%
Prior -10.3%
Revised n/a

[top][end]

Trade Balance ALLX (Dec)


[top]
2009-01-13 USER


[Skip to the end]

 
Even with lower fuel prices it keeps getting worse.


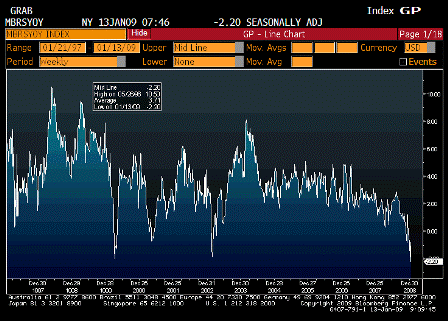
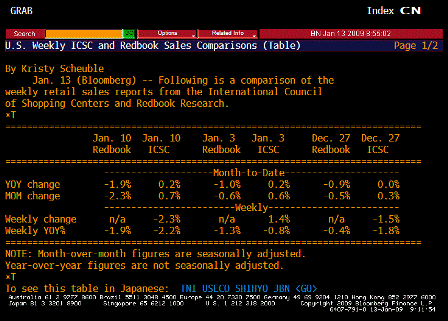
ICSC UBS Store Sales YoY (Jan 13)

Survey n/a
Actual -2.20%
Prior -0.80%
Revised n/a

[top][end]

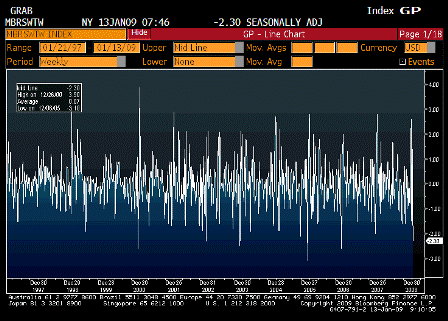
ICSC UBS Store Sales WoW (Jan 13)

Survey n/a
Actual -2.30%
Prior 1.40%
Revised n/a

[top][end]

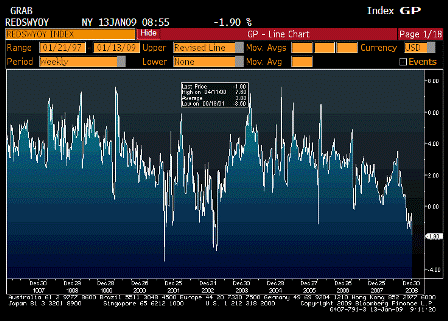
Redbook Store Sales Weekly YoY (Jan 13)

Survey n/a
Actual -1.90%
Prior -1.30%
Revised n/a

[top][end]

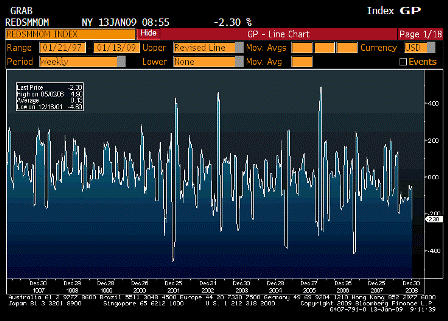
Redbook Store Sales MoM (Jan 13)

Survey n/a
Actual -2.30%
Prior -0.60%
Revised n/a

[top][end]

ICSC UBS Redbook Comparison TABLE (Jan 13)

[top][end]


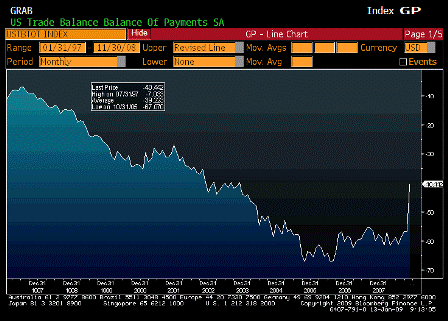
Trade Balance (Nov)

Survey -$51.0B
Actual -$40.4B
Prior -$57.2B
Revised -$56.7B

[top][end]

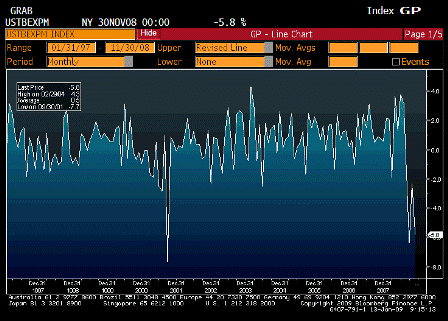
Exports MoM (Nov)

Survey n/a
Actual -5.8%
Prior -2.3%
Revised n/a

[top][end]

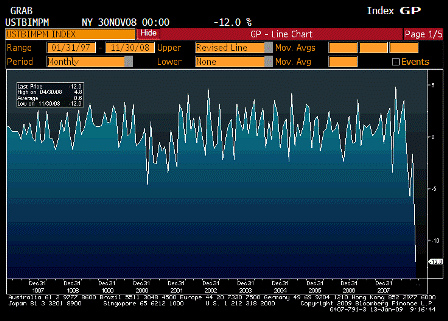
Imports MoM (Nov)

Survey n/a
Actual -12.0%
Prior -1.6%
Revised n/a

[top][end]

Exports YoY (Nov)

Survey n/a
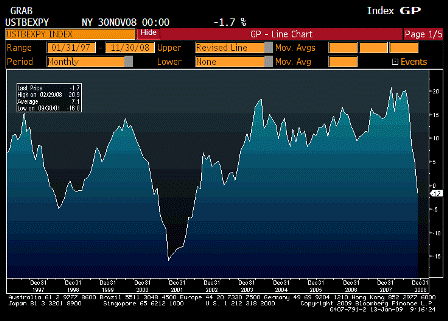
Actual -1.7%
Prior 5.2%
Revised n/a

[top][end]

Imports YoY (Nov)

Survey n/a
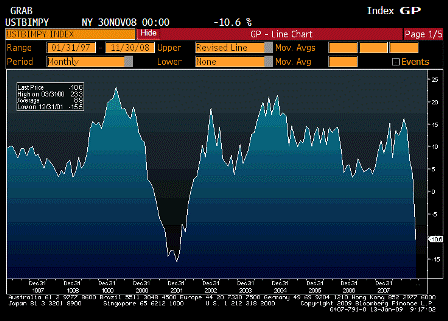
Actual -10.6%
Prior 3.9%
Revised n/a

[top][end]

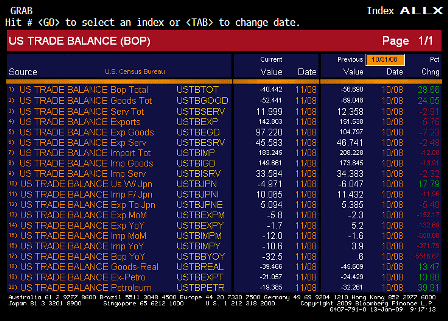
Trade Balance ALLX (Nov)

[top][end]


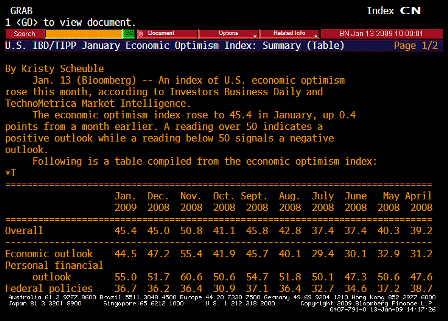
IBD TIPP Economic Optimism (Jan)

Survey 44.0
Actual 45.4
Prior 45.0
Revised n/a

[top][end]


Monthly Budget Statement (Dec)

Survey -$83.0B
Actual -$83.6B
Prior -$48.3B
Revised n/a

[top][end]

Monthly Budget Statement ALLX (Dec)


[top]
2008-12-11 USER


[Skip to the end]


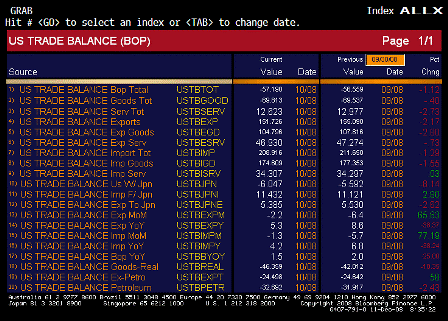
Trade Balance (Oct)

Survey -$53.5B
Actual -$57.2B
Prior -$56.5B
Revised -$56.6B

[top][end]

Exports MoM (Oct)

Survey n/a
Actual -2.2%
Prior -6.4%
Revised n/a

[top][end]

Imports MoM (Oct)

Survey n/a
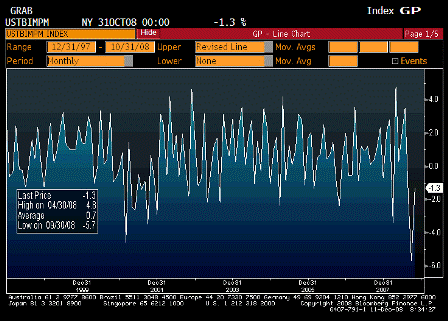
Actual -1.3%
Prior -5.7%
Revised n/a

[top][end]

Exports YoY (Oct)

Survey n/a
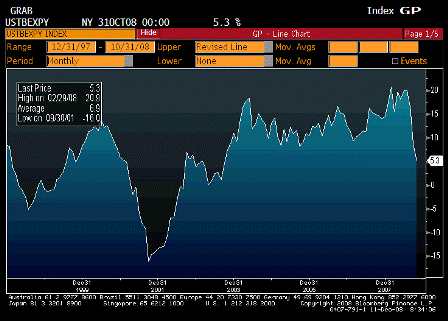
Actual 5.3%
Prior 8.6%
Revised n/a

[top][end]

Imports YoY (Oct)

Survey n/a
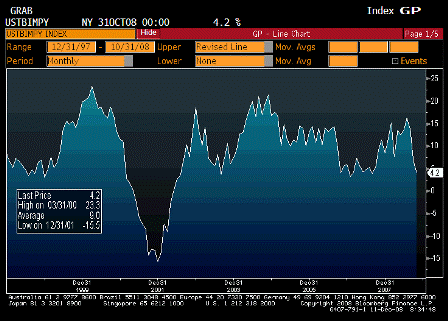
Actual 4.2%
Prior 6.8%
Revised n/a

[top][end]

Trade Balance ALLX (Oct)

[top][end]

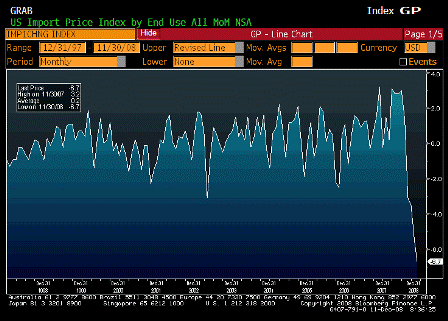
Import Price Index MoM (Nov)

Survey -4.9%
Actual -6.7%
Prior -4.7%
Revised -5.4%

[top][end]

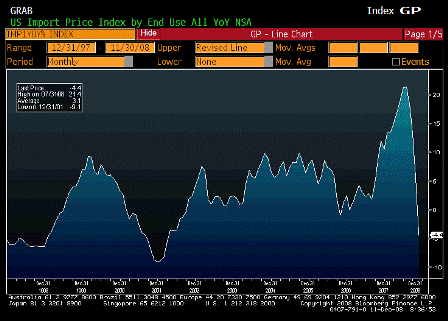
Import Price Index YoY (Nov)

Survey -2.0%
Actual -4.4%
Prior 6.7%
Revised 5.7%

[top][end]

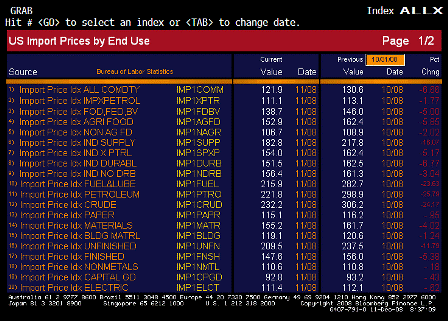
Import Price Index ALLX 1 (Nov)

[top][end]

Import Price Index ALLX 2 (Nov)

[top][end]

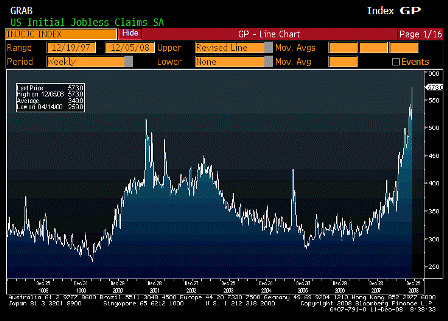
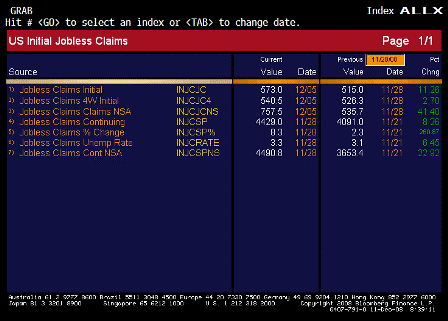
Initial Jobless Claims (Dec 6)

Survey 525K
Actual 573K
Prior 509K
Revised 515K

[top][end]

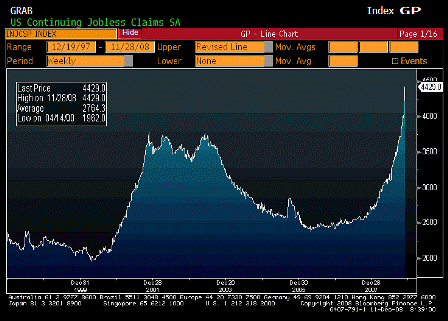
Continuing Jobless Claims (Dec 15)

Survey 4100K
Actual 4429K
Prior 4087K
Revised 4091K

[top][end]

Jobless Claims ALLX (Dec 6)


[top]
2008-11-13 USER


[Skip to the end]


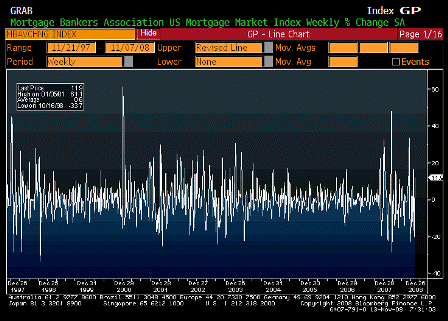
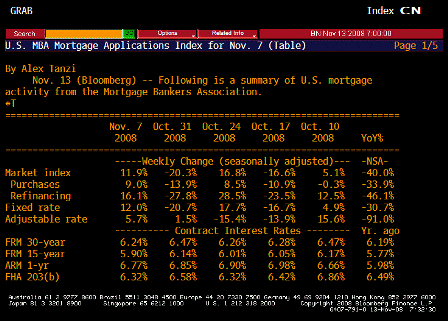
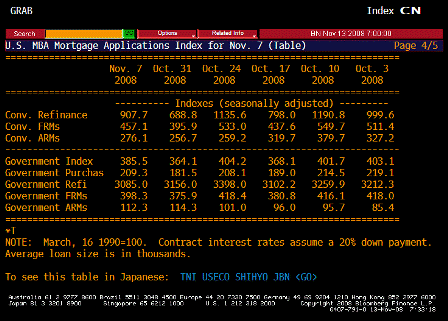
MBA Mortgage Applications (Nov 7)

Survey n/a
Actual 11.9%
Prior -20.3%
Revised n/a

[top][end]

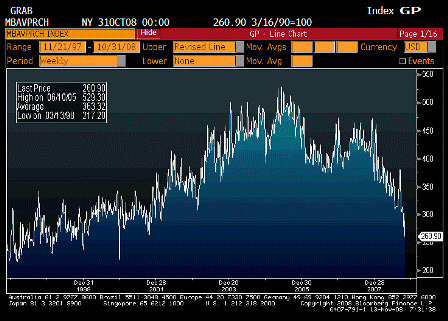
MBA Purchasing Applications (Nov 7)

Survey n/a
Actual 260.90
Prior 303.10
Revised n/a

 
Up some, but still very low.

[top][end]

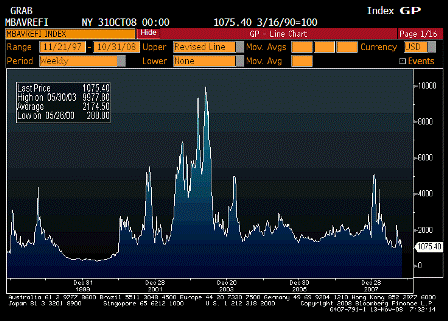
MBA Refinancing Applications (Nov 7)

Survey n/a
Actual 1075.40
Prior 1489.40
Revised n/a

[top][end]

MBA TABLE 1 (Nov 7)

[top][end]

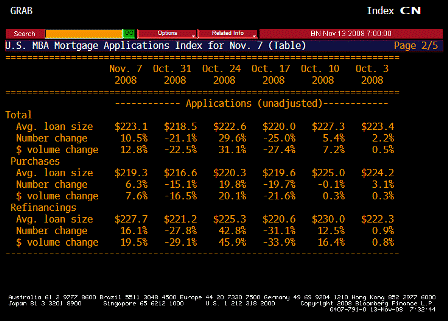
MBA TABLE 2 (Nov 7)

[top][end]

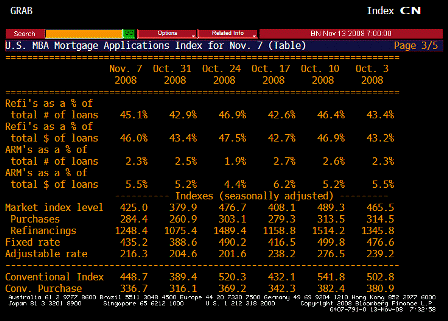
MBA TABLE 3 (Nov 7)

[top][end]

MBA TABLE 4 (Nov 7)

[top][end]

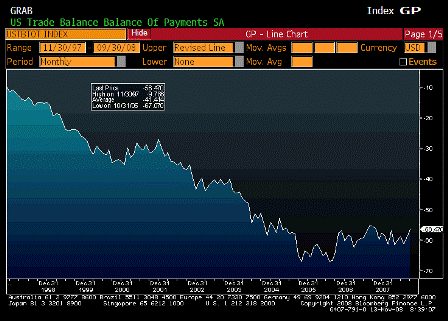
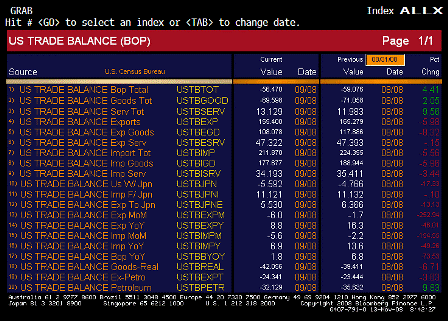
Trade Balance (Sep)

Survey -$57.0B
Actual -$56.5B
Prior -$59.1B
Revised n/a

 
Slowly falling as crude prices came down.

Karim writes:

  • Trade deficit improves from -59.1bn to -56.5 bn,
  • BUT, real trade balance actually worsened by about 3bn due to underlying price moves (so negative impact on real GDP)
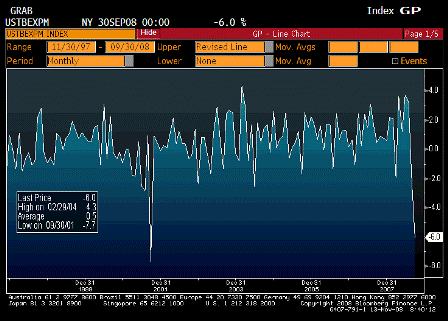
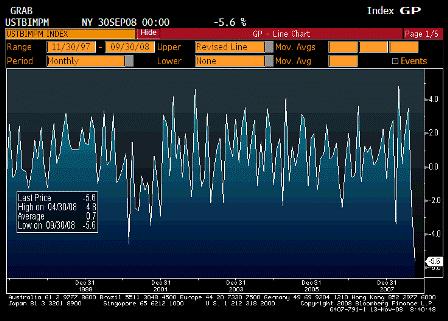
  • Also, exports down 6% m/m and imports down 5.6% m/m

[top][end]

Exports MoM (Sep 8)

Survey n/a
Actual -6.0%
Prior -1.7%
Revised n/a

 
Exports and imports (below) down as world economy slows.

[top][end]

Imports MoM (Sep 8)

Survey n/a
Actual -5.6%
Prior -2.2%
Revised n/a

[top][end]

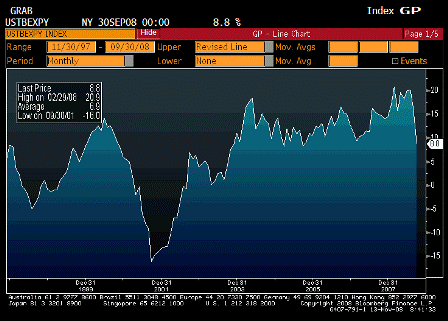
Exports YoY (Sep 8)

Survey n/a
Actual 8.8%
Prior 16.3%
Revised n/a

 
Exports and imports (below) still up year over year but probably not for long.

[top][end]

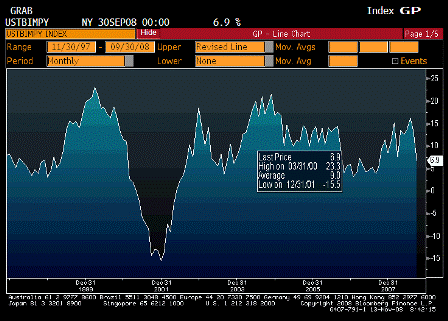
Imports YoY (Sep 8)

Survey n/a
Actual 6.9%
Prior 13.6%
Revised n/a

[top][end]

Trade Balance ALLX (Sep)

[top][end]

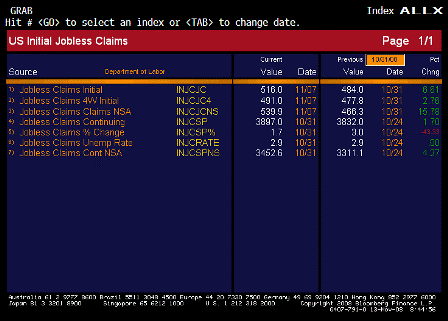
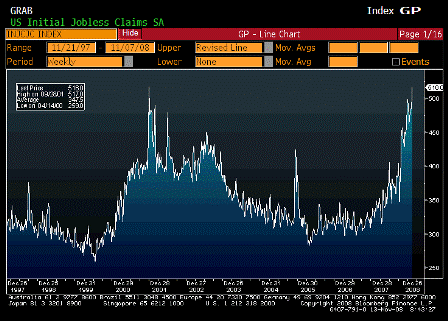
Initial Jobless Claims (Nov 8)

Survey 480K
Actual 516K
Prior 481K
Revised 484K

 
In to recession territory as expected.

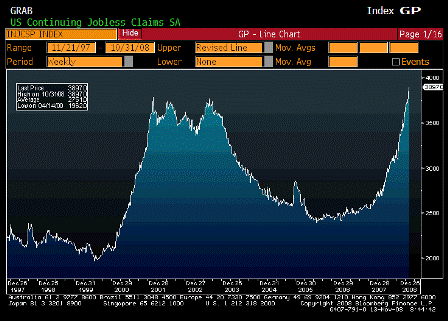
Karim writes:

These are truly awful numbers

  • Initial claims rise from 484k (revised up from 480k) to new cycle high of 516k
  • Continuing claims rise from 3832k (revised down from 3843k) to new cycle high of 3897k
  • These reflect step-up in layoffs and continued lack of hiring

[top][end]

Continuing Claims (Nov 1)

Survey 3825K
Actual 3897K
Prior 3843K
Revised 3832K

 
Moving into recession levels as expected.

[top][end]

Jobless Claims ALLX (Nov 8)


[top]
2008-10-10 USER


[Skip to the end]


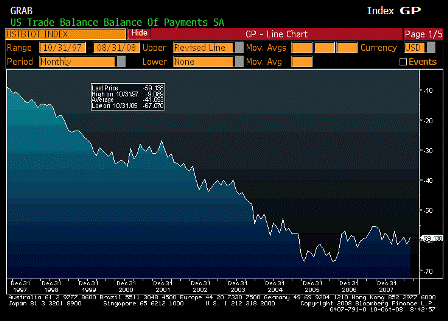
Trade Balance (Aug)

Survey -$59.0B
Actual -$59.1B
Prior -$62.2B
Revised -$61.3B

 
If oil prices don’t rise and the foreign sector’s desire to accumulate $US stays down this will go a lot lower.

[top][end]

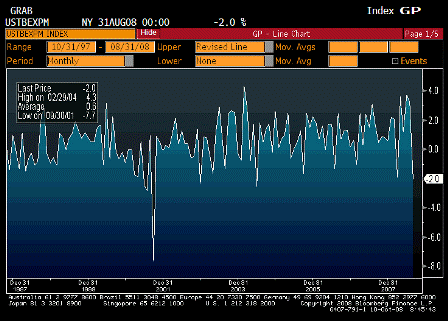
Exports MoM (Aug)

Survey n/a
Actual -2.0%
Prior 3.3%
Revised n/a

 
World economy takes pause.

[top][end]

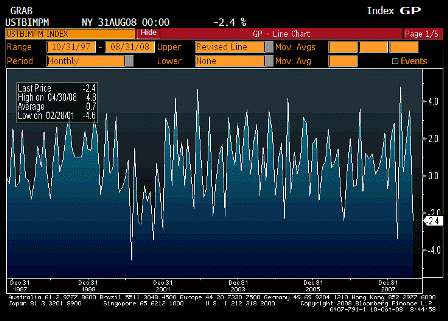
Imports MoM (Aug)

Survey n/a
Actual -2.4%
Prior 3.5%
Revised n/a

 
US economy pauses.

[top][end]

Exports YoY (Aug)

Survey n/a
Actual 15.9%
Prior 20.1%
Revised n/a

 
Still way high.

[top][end]

Imports YoY (Aug)

Survey n/a
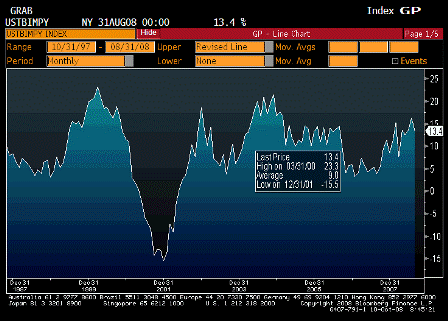
Actual 13.4%
Prior 16.3%
Revised n/a

 
Still growing fast, but largely oil prices.

[top][end]

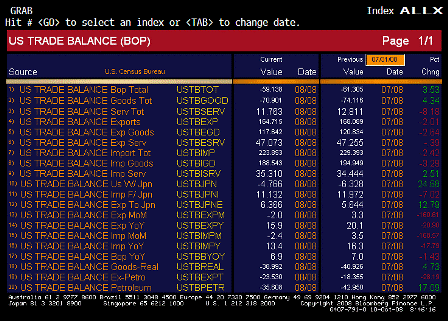
Trade Balance ALLX (Aug)

[top][end]


Import Price Index MoM (Sep)

Survey -2.8%
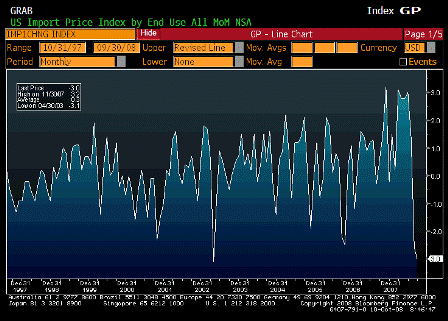
Actual -3.0%
Prior -3.7%
Revised -2.6%

 
Big drop.

[top][end]

Import Price Index YoY (Sep)

Survey 12.2%
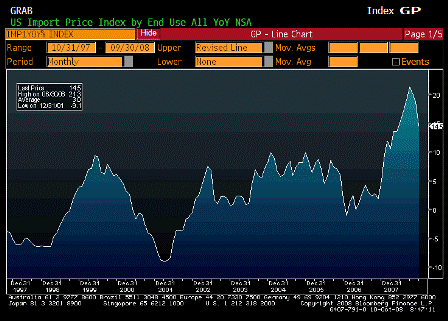
Actual 14.5%
Prior 16.0%
Revised 18.7%

 
Still very high.

[top][end]

Import Price Index ALLX 1 (Sep)

[top][end]

Import Price Index ALLX 2 (Sep)


[top]
2008-09-11 USER


[Skip to the end]

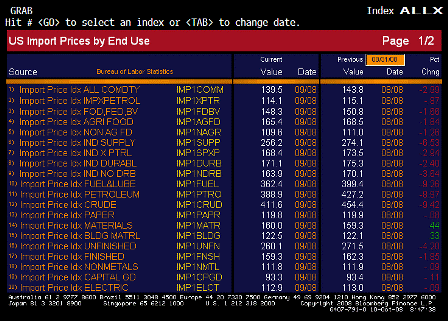
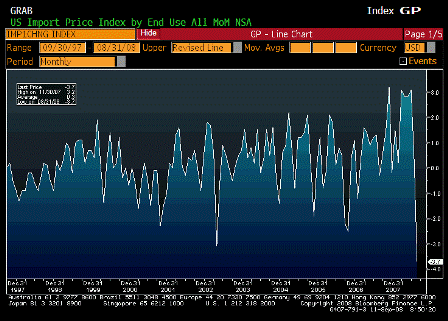
Import Price Index MoM (Aug)

Survey -1.8%
Actual -3.7%
Prior 1.7%
Revised 0.2%

 
A welcome drop, thanks to Mike Masters!

Like the goldman drop of Aug 2006.

[top][end]

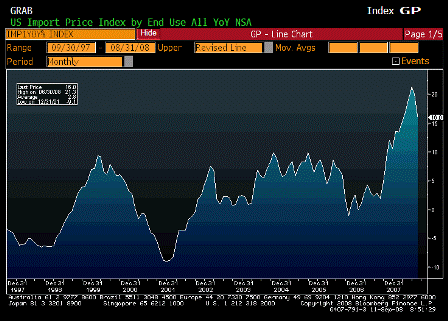
Import Price Index YoY (Aug)

Survey 20.2%
Actual 16.0%
Prior 21.6%
Revised 20.1%

 
Lower than expected, though still up big year over year, which most influences core CPI.

[top][end]

Import Price Index ALLX 1 (Aug)

 
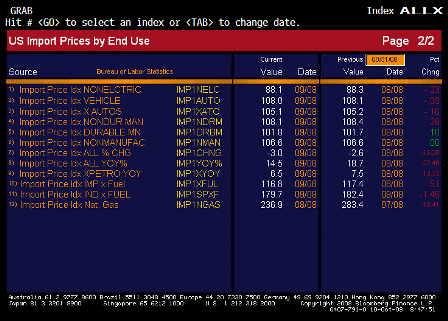
Interesting details this month.

[top][end]

Import Price Index ALLX 2 (Aug)

[top][end]


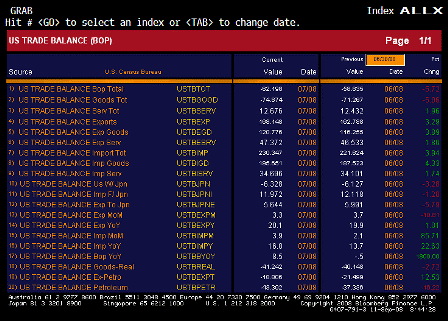
Trade Balance (Jul)

Survey -$58.0B
Actual -$62.2B
Prior -$56.8B
Revised -$58.8B

 
Deficit higher than expected, due to July oil prices. This should more than reverse in August and, so far, September as sharply lower oil prices reduce the cost of imports.

[top][end]

Exports MoM (Jul)

Survey n/a
Actual 3.3
Prior 3.7
Revised n/a

 
Still increasing, though at a slightly lower rate.

[top][end]

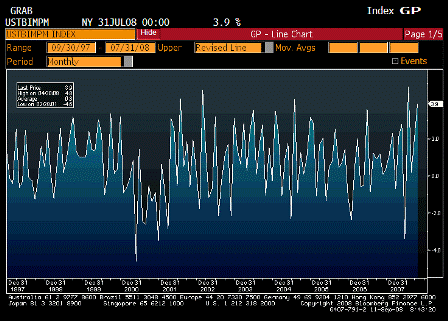
Imports MoM (Jul)

Survey n/a
Actual 3.9
Prior 2.1
Revised n/a

 
This should drop next month with lower oil prices.

[top][end]

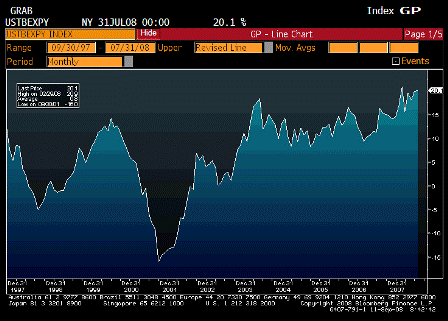
Exports YoY (Jul)

Survey n/a
Actual 20.1
Prior 19.9
Revised n/a

 
Still climbing rapidly. next month’s numbers will indicate effects of any global slowdown.

[top][end]

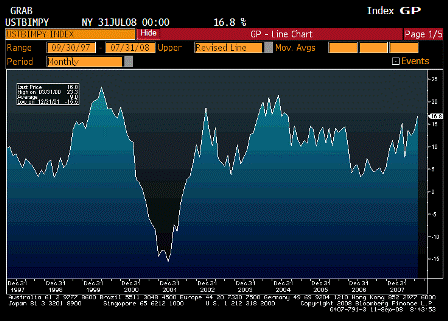
Imports YoY (Jul)

Survey n/a
Actual 16.8
Prior 13.7
Revised n/a

 
Still up big, falling oil prices should cut this down.

[top][end]

Trade Balance ALLX (Jul)

 
Worth reading through these.

[top][end]


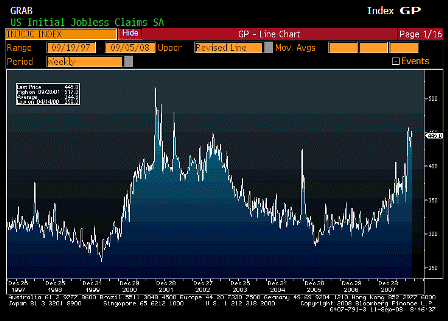
Initial Jobless Claims (Sep 6)

Survey 440K
Actual 445K
Prior 444K
Revised 451K

 
Holding steady at higher levels, and getting closer to recession levels.

[top][end]

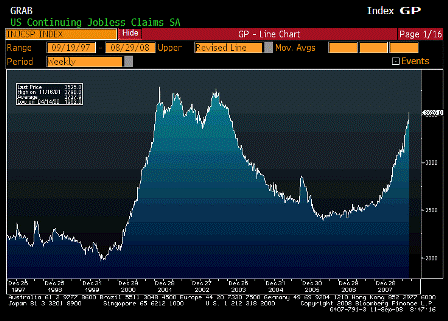
Continuing Jobless Claims (Aug 30)

Survey 3460K
Actual 3525K
Prior 3435K
Revised 3403K

 
This continues to move up and is getting closer to recession levels.

Not clear how much new extended benefit.

[top][end]

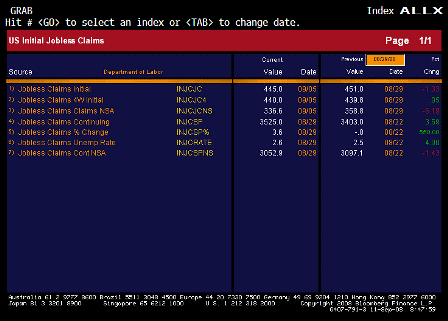
Jobless Claims ALLX (Aug 30)

 
Interesting that claims were only 336,600 before the seasonal adjustment.
With seasonals this large improvement is more likely to show up when they reverse.

[top][end]

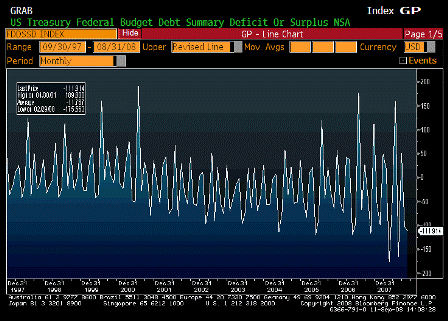
Monthly Budget Statement (Aug)

Survey -$108.0B
Actual -$111.9B
Prior -$117.0B
Revised

 
A bit higher than expected, receipts falling some, but nothing serious yet.

[top][end]

Monthly Budget Statement ALLX (Aug)


[top]
2008-08-12 US Economic Releases


[Skip to the end]
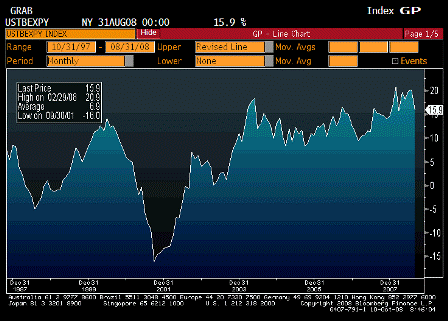

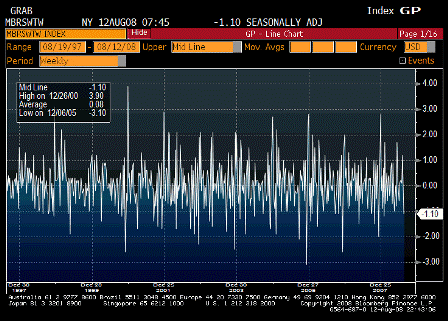
ICSC-UBS Store Sales WoW (Aug 12)

Survey n/a
Actual -1.1%
Prior 0.0%
Revised n/a

[top][end]

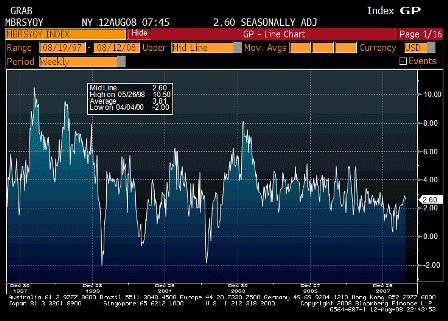
ICSC-UBS Store Sales YoY (Aug 12)

Survey n/a
Actual 2.6%
Prior 2.9%
Revised n/a

Year over year looking fine.

[top][end]

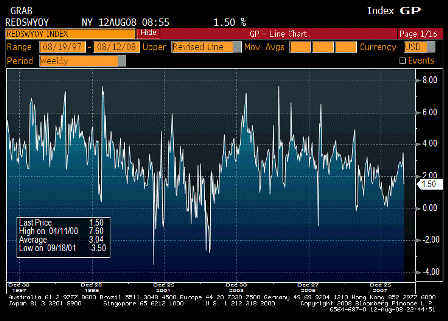
Redbook Store Sales Weekly YoY (Aug 12)

Survey n/a
Actual 1.5%
Prior 3.5%
Revised n/a

Softer but no collapse.

[top][end]

ICSC-UBS Redbook Comparisson TABLE (Aug 12)

[top][end]


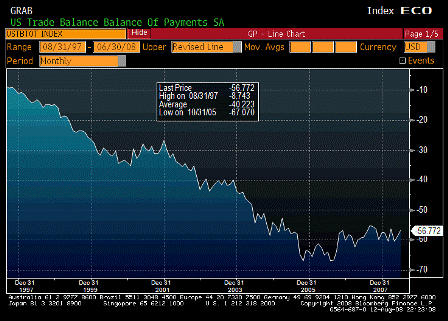
Trade Balance (Jun)

Survey -$62.0B
Actual -$56.8B
Prior -$59.8B
Revised -$59.2B

Lower than expected and moving lower even with crude prices up in June.

I still think last months number was too high which is part of the reason for the June drop.

[top][end]

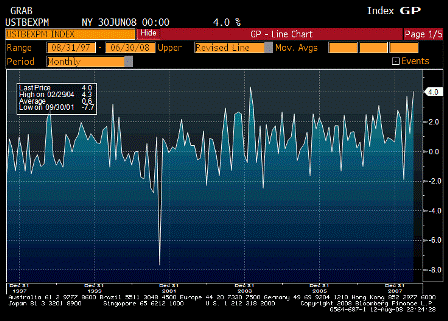
Exports MoM (Jun)

Survey n/a
Actual 4.0%
Prior 1.2%
Revised n/a

Government and exports continue to support GDP.

Q2 now looking to be revised to maybe north of 3%.

[top][end]

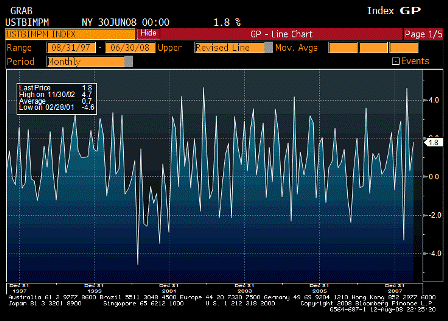
Imports MoM (Jun)

Survey n/a
Actual 1.8%
Prior 0.3%
Revised n/a

Up due to crude and gasoline prices.

[top][end]

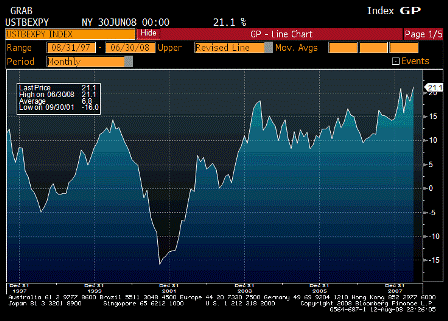
Exports YoY (Jun)

Survey n/a
Actual 21.1%
Prior 18.2%
Revised n/a

Looking more like an export economy every day. Weak domestic consumption and ok employment.

Workers earn enough to drive to work and eat, and the rest of their output gets exported to someone else.

[top][end]

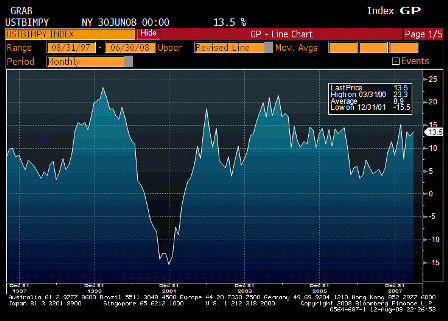
Imports YoY (Jun)

Survey n/a
Actual 13.5%
Prior 12.5%
Revised n/a

Mostly petro and product prices.

Other imports are down.

[top][end]

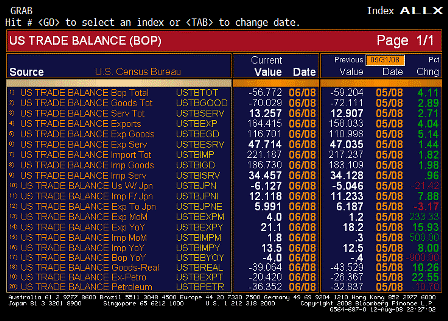
Trade Balance ALLX (Jun)

Ex petro down to about 20 billion.

[top][end]


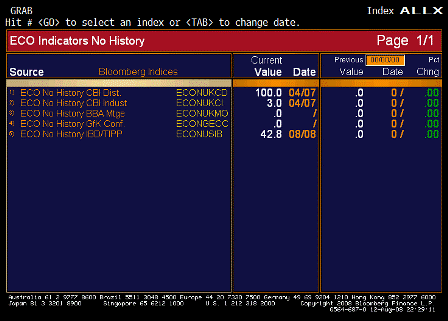
IBD-TIPP Economic Optimism (Aug)

Survey 39.0
Actual 42.8
Prior 37.4
Revised n/a

Up some, but less than expected.

[top][end]


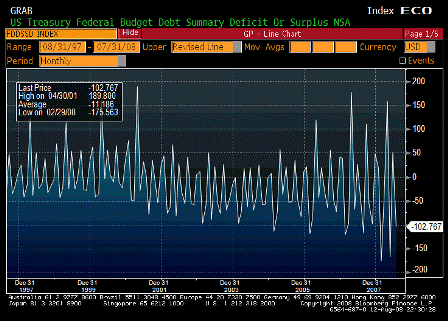
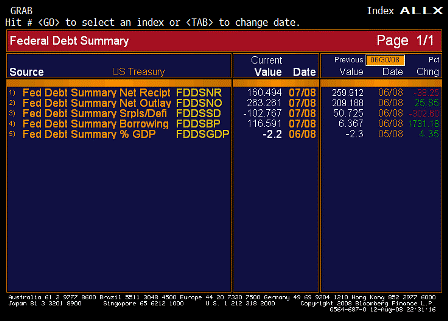
Monthly Budget Statement (Jul)

Survey -$95.0B
Actual -$102.8B
Prior -$36.4B
Revised n/a

Government spending and exports supporting GDP more than most anticipate.

[top][end]

Monthly Budget Statement ALLX (Jul)

[top][end]


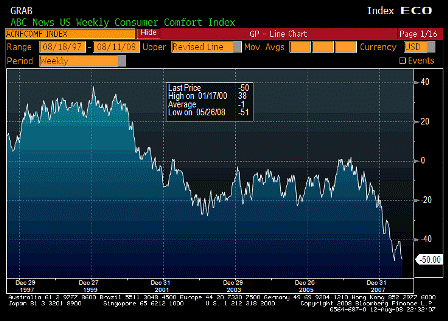
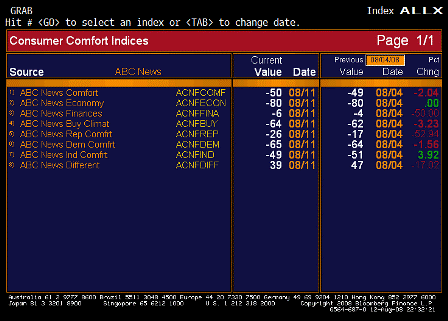
ABC Consumer Confidence (Aug 10)

Survey n/a
Actual -50
Prior -49
Revised n/a

Bumping along the bottom.

Inflation hurting confidence as wages remain ‘well contained’.

[top][end]

ABC Consumer Confidence ALLX (Aug 10)


[top]