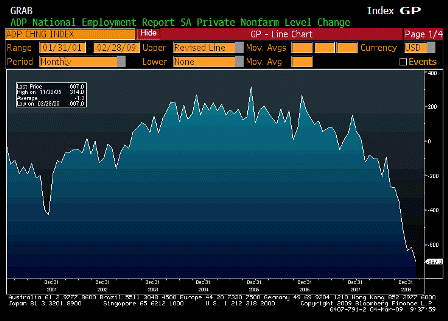
- Change in Nonfarm Payrolls (Released 8:30 EST)
- Change in Nonfarm Payrolls YoY (Released 8:30 EST)
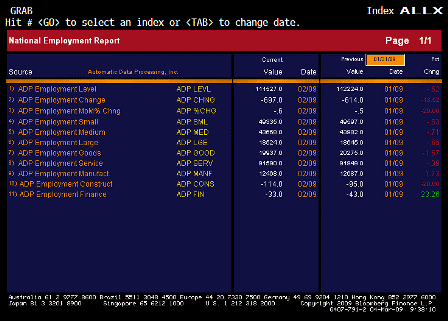
- Nonfarm Payrolls ALLX (Released 8:30 EST)
- Unemployment Rate (Released 8:30 EST)
- Unemployment Rate ALLX 1 (Released 8:30 EST)
- Unemployment Rate ALLX 2 (Released 8:30 EST)
- Change in Manufacturing Payrolls (Released 8:30 EST)
- Change in Manufacturing Payrolls YoY (Released 8:30 EST)
- Average Hourly Earnings MoM (Released 8:30 EST)
- Average Hourly Earnings YoY (Released 8:30 EST)
- Average Hourly Earnings ALLX 1 (Released 8:30 EST)
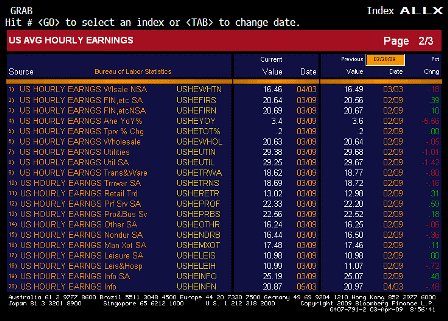
- Average Hourly Earnings ALLX 2 (Released 8:30 EST)
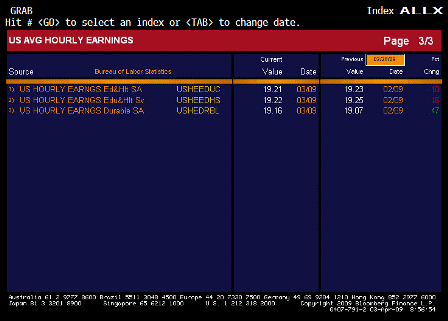
- Average Hourly Earnings ALLX 3 (Released 8:30 EST)
- Average Weekly Hours (Released 8:30 EST)
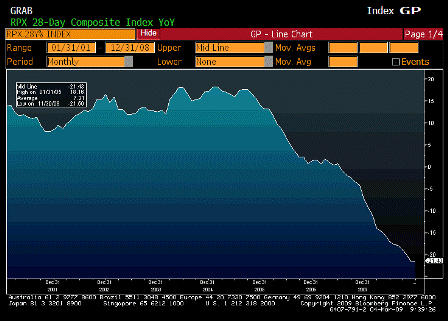
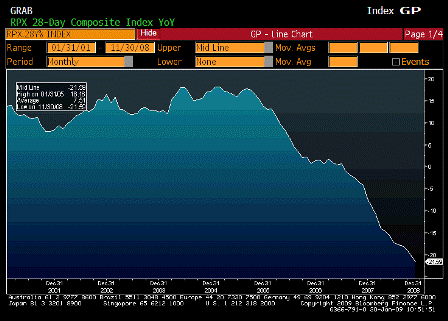
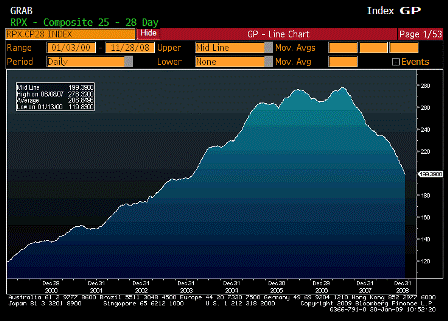
- RPX Composite 28dy YoY (Released 9:00 EST)
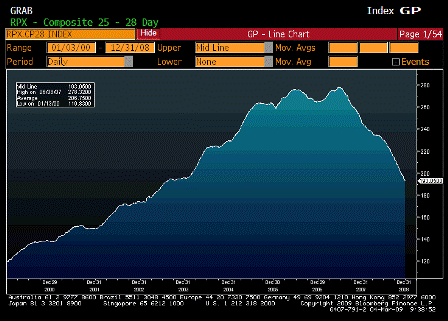
- RPX Composite 28dy Index (Released 9:00 EST)
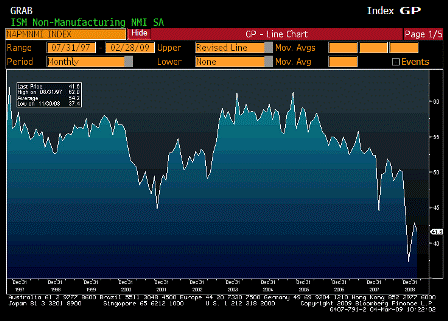
- ISM Non Manufacturing Composite (Released 10:00 EST)
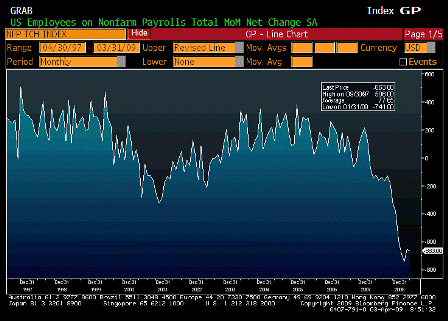
Change in Nonfarm Payrolls (Mar)
| Survey | -660K |
| Actual | -663K |
| Prior | -651K |
| Revised | n/a |
Karim writes:
- A 663k drop in payrolls and -86k in net revisions is bad enough
- The worst of it is the ongoing collapse in hours-the index of aggregate hours down another 1% last month
- On a work force of 130mm, a 1% drop in hours has the same impact on labor income as a 1.3mm fall in payrolls if total hours were unch
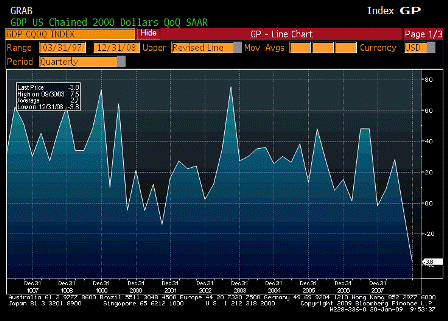
- The annualized drop in hours in Q1 was -8.7%-assuming 2-3% productivity growth; likely leaves real GDP in -5.5% to -6.5% area
- Total unemployed, plus marginally attached workers, plus part-time for economic reasons up from 14.8% to 15.4% (16% to 16.2% unadjusted)
- Only positive was diffusion index up from 21.4 to 22
- But looking at industry breakdown, hard to find where that improvement came from
- Manufacturing -161k
- Construction -126k
- Retail -48k
- Finance -43k
- Temp -72k
- Govt -5k
- Education +8k
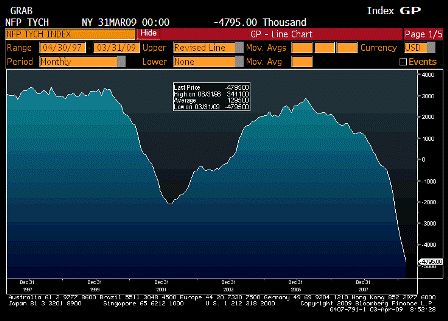
Change in Nonfarm Payrolls YoY (Mar)
| Survey | n/a |
| Actual | -4795.00 |
| Prior | -4254.00 |
| Revised | n/a |
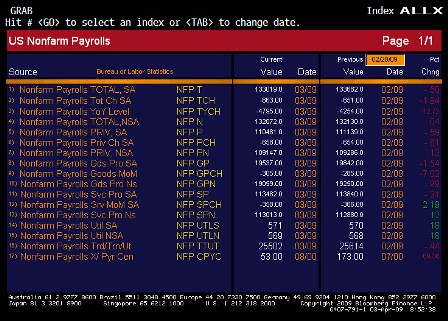
Nonfarm Payrolls ALLX (Mar)
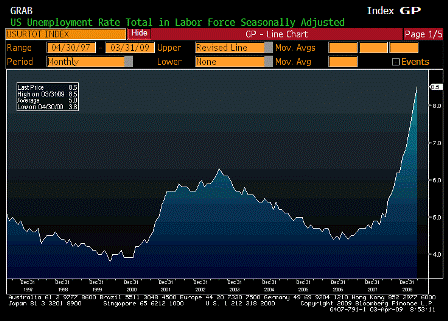
Unemployment Rate (Mar)
| Survey | 8.5% |
| Actual | 8.5% |
| Prior | 8.1% |
| Revised | n/a |
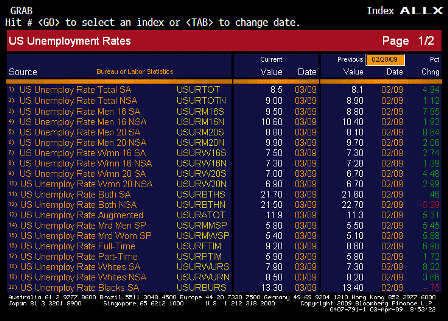
Unemployment Rate ALLX 1 (Mar)
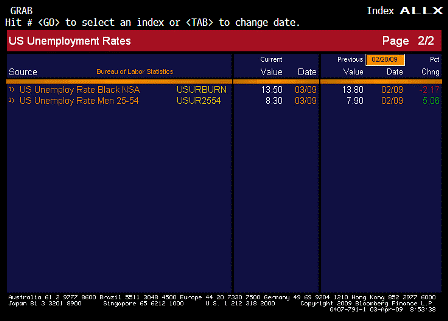
Unemployment Rate ALLX 2 (Mar)
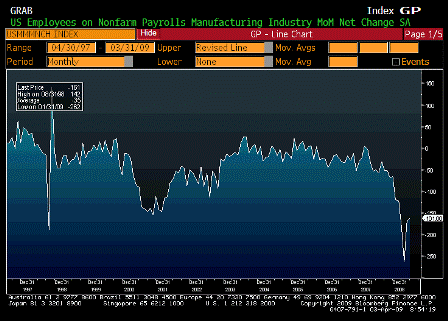
Change in Manufacturing Payrolls (Mar)
| Survey | -162K |
| Actual | -161K |
| Prior | -168K |
| Revised | -169K |
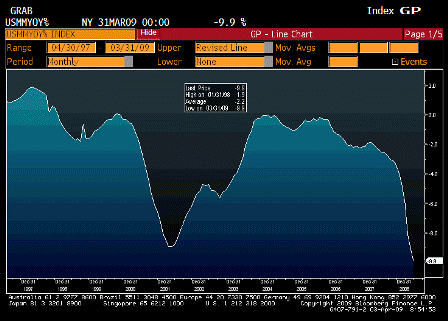
Change in Manufacturing Payrolls YoY (Mar)
| Survey | n/a |
| Actual | -9.9% |
| Prior | -9.1% |
| Revised | n/a |
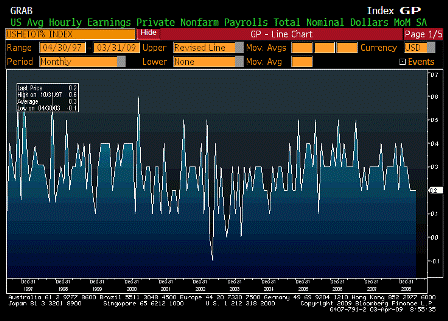
Average Hourly Earnings MoM (Mar)
| Survey | 0.2% |
| Actual | 0.2% |
| Prior | 0.2% |
| Revised | n/a |
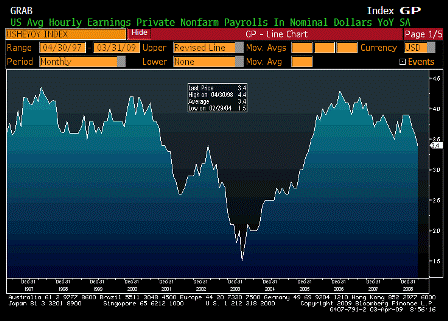
Average Hourly Earnings YoY (Mar)
| Survey | 3.5% |
| Actual | 3.4% |
| Prior | 3.6% |
| Revised | n/a |
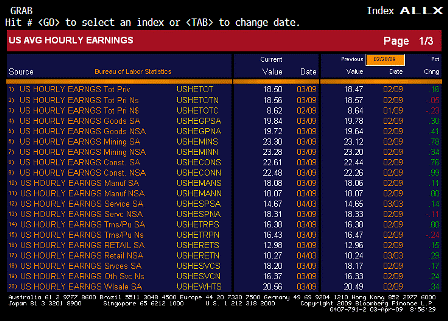
Average Hourly Earnings ALLX 1 (Mar)
Average Hourly Earnings ALLX 2 (Mar)
Average Hourly Earnings ALLX 3 (Mar)
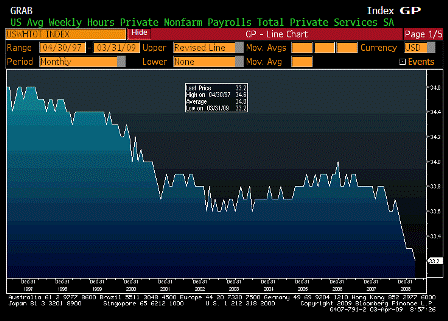
Average Weekly Hours (Mar)
| Survey | 33.3 |
| Actual | 33.2 |
| Prior | 33.3 |
| Revised | n/a |
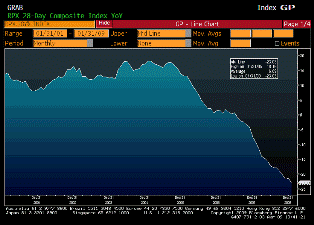
RPX Composite 28dy YoY (Jan)
| Survey | n/a |
| Actual | -23.03% |
| Prior | -21.43% |
| Revised | n/a |
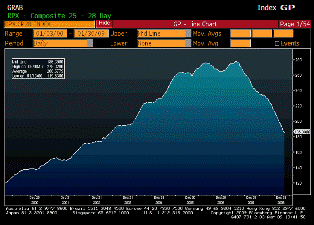
RPX Composite 28dy Index (Jan)
| Survey | n/a |
| Actual | 186.39 |
| Prior | 193.05 |
| Revised | n/a |
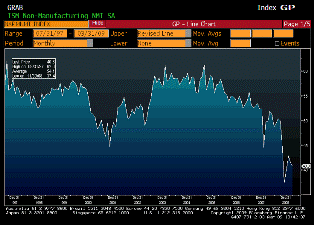
ISM Non Manufacturing Composite (Mar)
| Survey | 42.0 |
| Actual | 40.8 |
| Prior | 41.6 |
| Revised | n/a |
[top]


