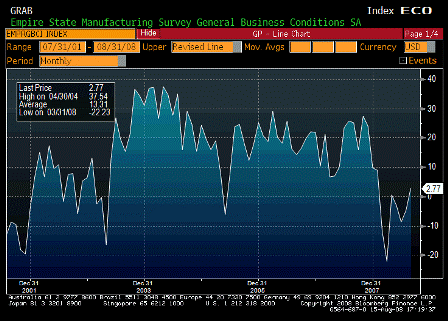
- Empire State Manufacturing Survey (Released 8:30 EST)
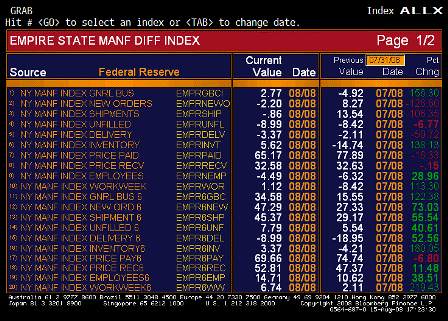
- Empire State Manufacturing Survey ALLX 1 (Released 8:30 EST)
- Empire State Manufacturing Survey ALLX 2 (Released 8:30 EST)
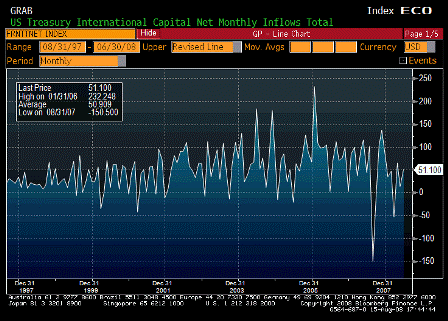
- Net Long Term TIC Flows (Released 9:00 EST)
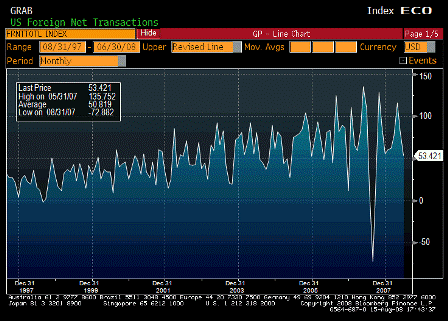
- Total Net TIC Flows (Released 9:00 EST)
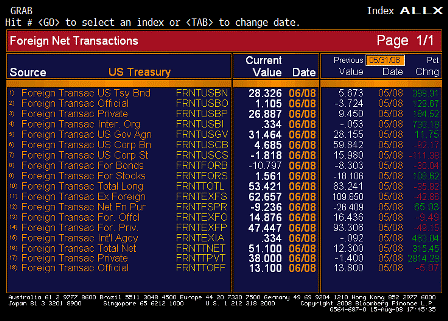
- TIC ALLX (Released 9:00 EST)
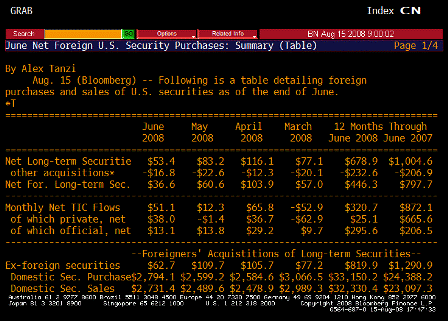
- TIC TABLE 1 (Released 9:00 EST)
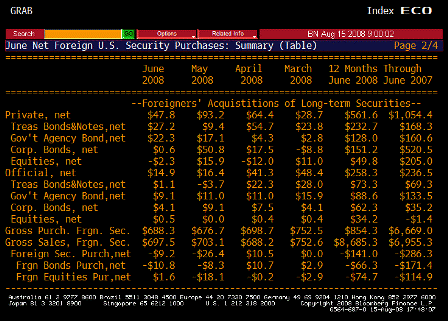
- TIC TABLE 2 (Released 9:00 EST)
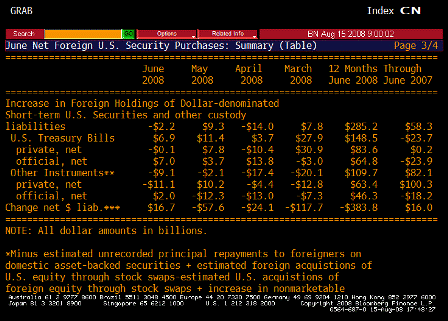
- TIC TABLE 3 (Released 9:00 EST)
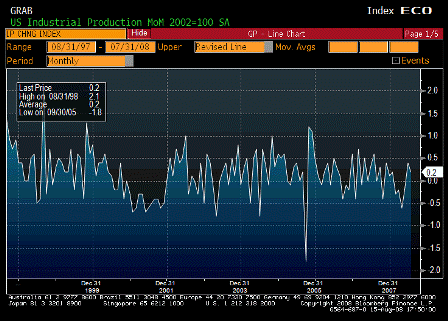
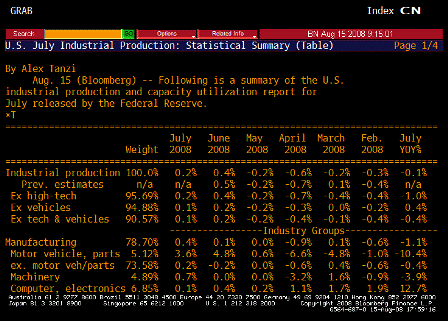
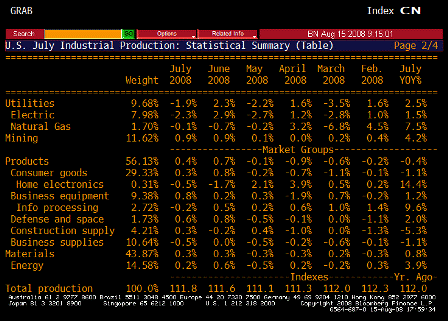
- Industrial Production MoM (Released 9:15 EST)
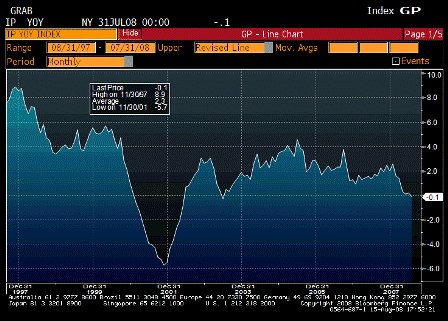
- Industrial Production YoY (Released 9:15 EST)
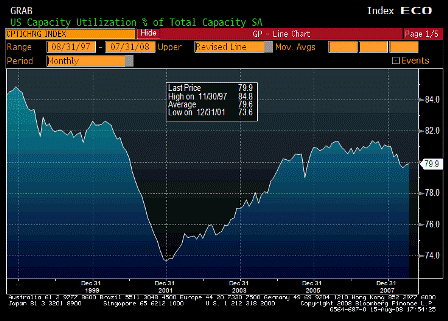
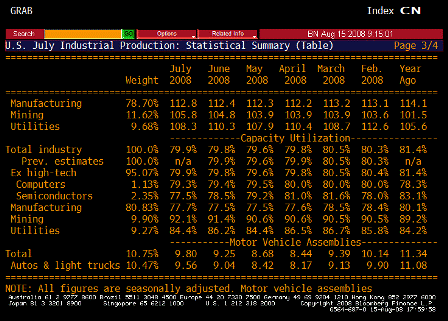
- Capacity Utilization (Released 9:15 EST)
- Capacity Utilization TABLE 1 (Released 9:15 EST)
- Capacity Utilization TABLE 2 (Released 9:15 EST)
- Capacity Utilization TABLE 3 (Released 9:15 EST)
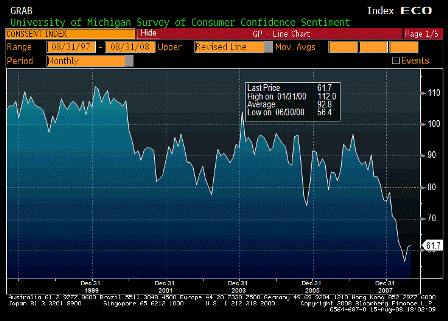
- NAHB Housing Market Index (Released 13:00 EST)
- NAHB Housing Market Index TABLE 1 (Released 13:00 EST)
- NAHB Housing Market Index TABLE 2 (Released 13:00 EST)
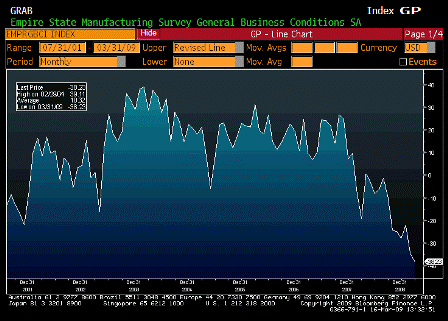
Empire State Manufacturing Survey (Mar)
| Survey | -30.80 |
| Actual | -38.23 |
| Prior | -34.65 |
| Revised | n/a |
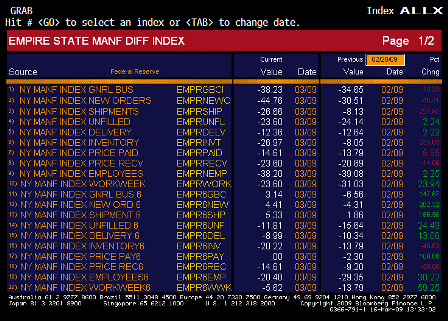
Empire State Manufacturing Survey ALLX 1 (Mar)
the
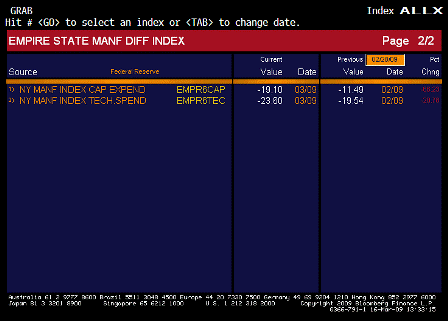
Empire State Manufacturing Survey ALLX 2 (Mar)
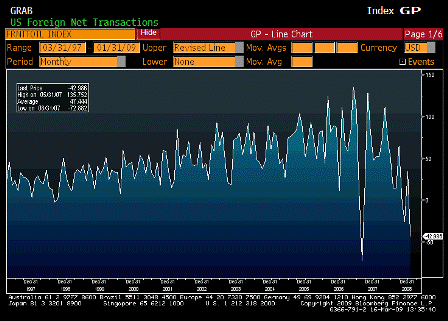
Net Long Term TIC Flows (Jan)
| Survey | $45.0B |
| Actual | -$43.0B |
| Prior | $34.8B |
| Revised | $34.7B |
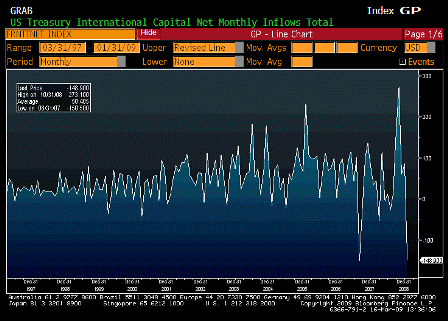
Total Net TIC Flows (Jan)
| Survey | n/a |
| Actual | -$148.9B |
| Prior | $74.0B |
| Revised | $86.2B |
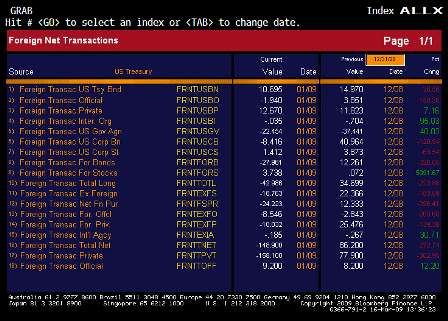
TIC ALLX (Jan)
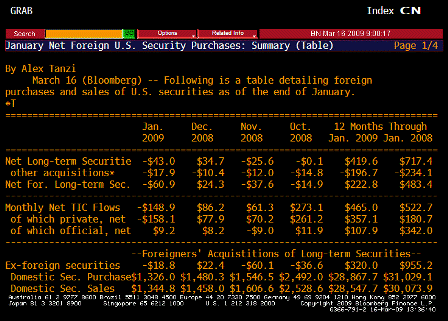
TIC TABLE 1 (Jan)
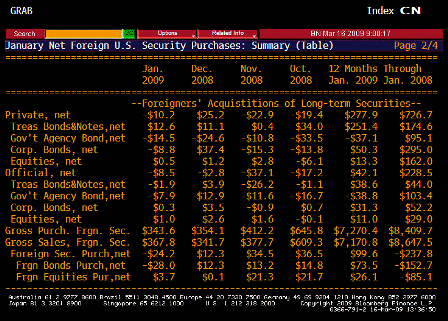
TIC TABLE 2 (Jan)
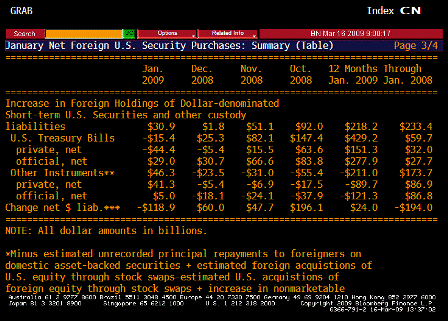
TIC TABLE 3 (Jan)
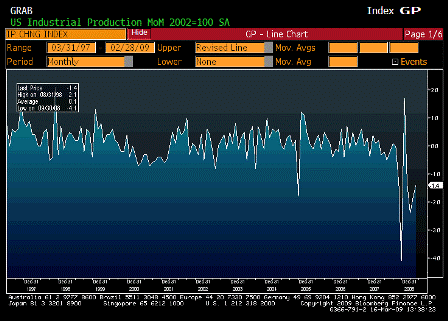
Industrial Production MoM (Feb)
| Survey | -1.3% |
| Actual | -1.4% |
| Prior | -1.8% |
| Revised | -1.9% |
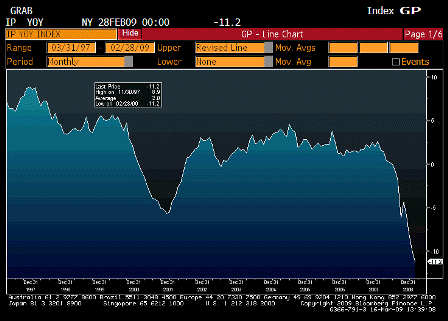
Industrial Production YoY (Feb)
| Survey | n/a |
| Actual | -11.2% |
| Prior | -10.1% |
| Revised | n/a |
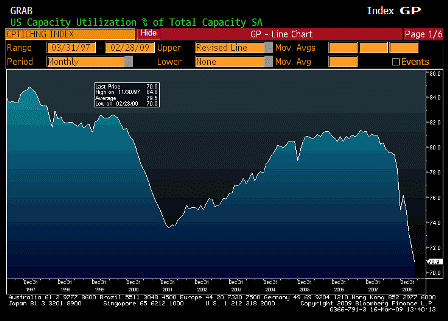
Capacity Utilization (Feb)
| Survey | 71% |
| Actual | 70.9% |
| Prior | 72.0% |
| Revised | 71.9% |
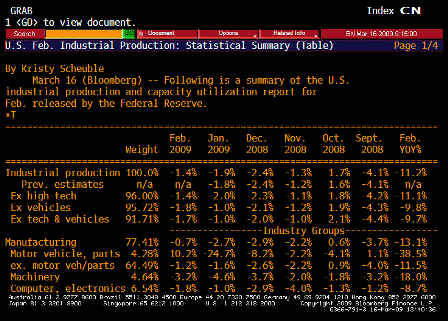
Capacity Utilization TABLE 1 (Feb)
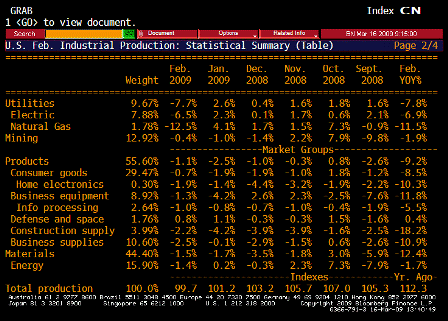
Capacity Utilization TABLE 2 (Feb)
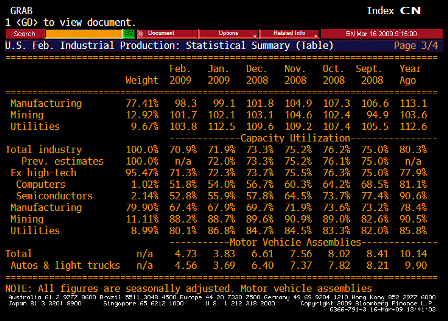
Capacity Utilization TABLE 3 (Feb)
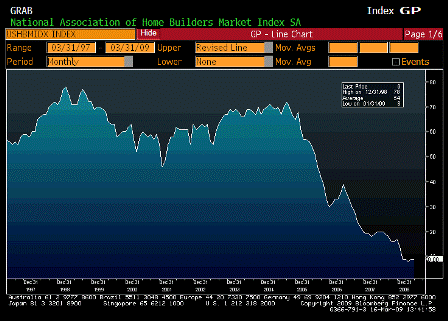
NAHB Housing Market Index (Mar)
| Survey | 9 |
| Actual | 9 |
| Prior | 9 |
| Revised | n/a |
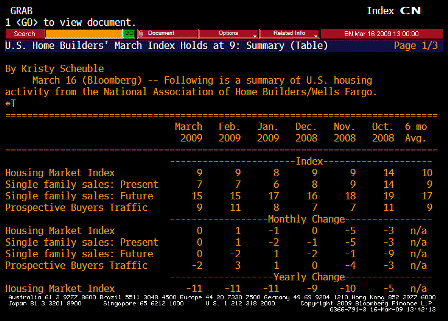
NAHB Housing Market Index TABLE 1 (Mar)
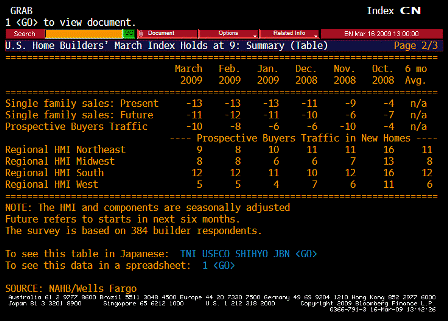
NAHB Housing Market Index TABLE 2 (Mar)
[top]


