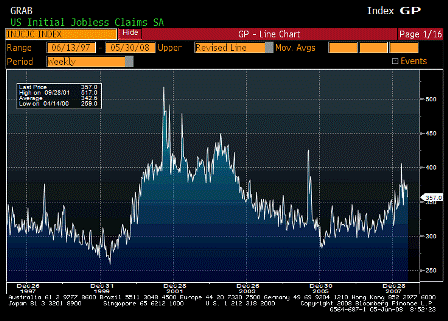
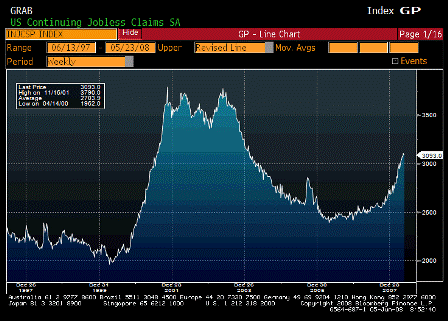
US Economic Releases
- Unemployment Rate (Released 8:30 EST)
- Unemployment Rate ALLX 1 (Released 8:30 EST)
- Unemployment Rate ALLX 2 (Released 8:30 EST)
- Change in Nonfarm Payrolls (Released 8:30 EST)
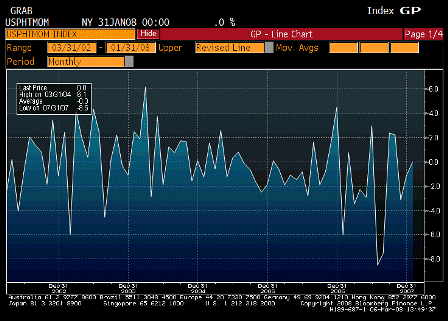
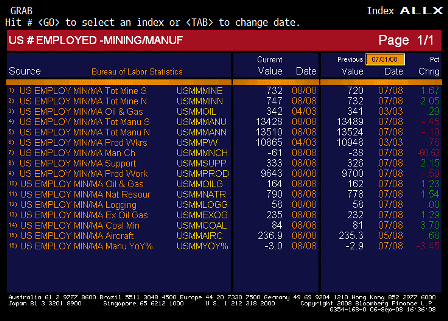
- Change in Manufacturing Payrolls (Released 8:30 EST)
- Mining-Manufacturing Employment ALLX (Released 8:30 EST)
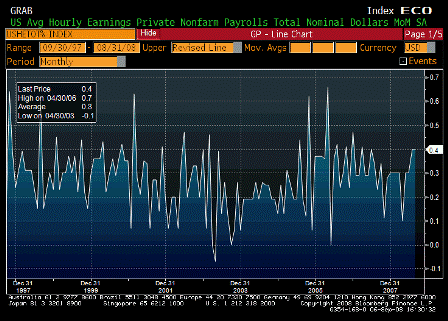
- Average Hourly Earnings MoM (Released 8:30 EST)
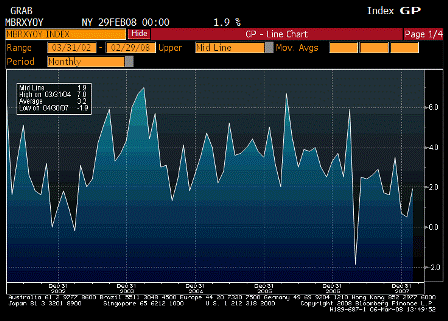
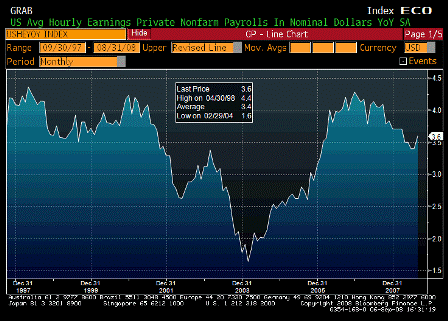
- Average Hourly Earnings YoY (Released 8:30 EST)
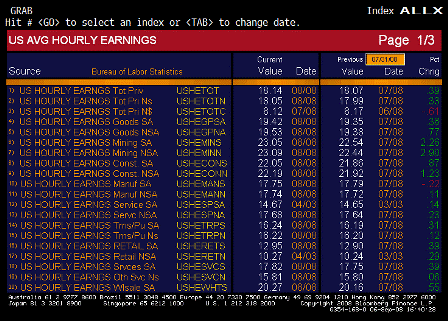
- Average Hourly Earnings ALLX 1 (Released 8:30 EST)
- Average Hourly Earnings ALLX 2 (Released 8;30 EST)
- Average Hourly Earnings ALLX 3 (Released 8:30 EST)
- Average Weekly Hours (Released 8:30 EST)
- Average Weekly Hours ALLX 1 (Released 8:30 EST)
- Average Weekly Hours ALLX 2 (Released 8:30 EST)
- Mortgage Delinquencies (Released 10:00 EST)
- Mortgage Delinquencies ALLX (Released 10:00 EST)
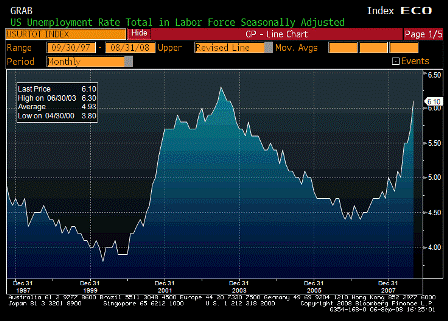
Unemployment Rate (Aug)
| Survey | 5.7% |
| Actual | 6.1% |
| Prior | 5.7% |
| Revised | n/a |
Another big gap up.
Quite a bit of the run up is due to new people entering the labor force to find work.
Could be due to new extended benefits program.
Could be due to more people looking to earn some extra money.
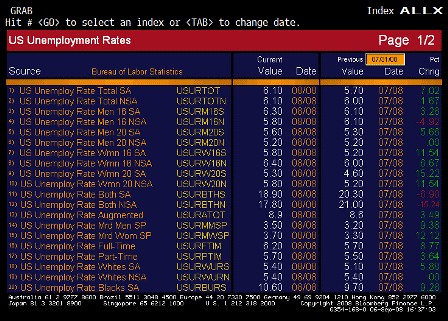
Unemployment Rate ALLX 1 (Aug)
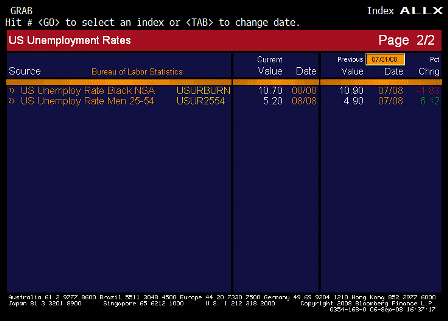
Unemployment Rate ALLX 2 (Aug)
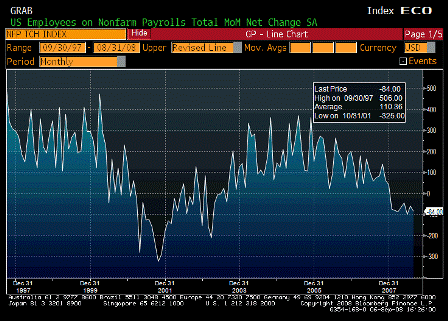
Change in Nonfarm Payrolls (Aug)
| Survey | -75K |
| Actual | -84K |
| Prior | -51K |
| Revised | -60K |
A bit worse than expected and previous months revised up some, mainly due to state and local government reductions.
Weakness but still not recession type losses.
Cesar writes:
weak report
- NFP down 84k; net revisions down another 58k, 8th straight mthly decline
Yes, continuing weakness in employment, but not at 200,000+ recession type levels.
Also, negative revisions for previous months means productivity was even higher.
- Unemployment rate jumps from 5.682% to 6.055% (household employment down 342k and labor force up 250k)
Yes, big numbers entering the labor force have been contributing to the higher unemployment rate.
Some of this could be due to extended benefit programs and some could be to high pricers driving people out of ‘retirement’ and back into the labor force.
- Diffusion index improves from 41.4 to 48.9
- Index of aggregate hours drops 0.1% (3 months annualized rate down 1.8%)
- Average duration of unemployment rises 17.1 to 17.4 weeks (median actually improved from 9.7 to 9.2)
- Average hourly earnings rise 0.4% and increased from 3.4% y/y to 3.6% y/y
- By sector:
- Mfg down 61k
- Construction down 8k
- Retail down 20k
- Temp down 37k
- Education & Health care up 55k
- Govt up 17k
The last two are the largest sectors and where the trend of growth generally comes from.
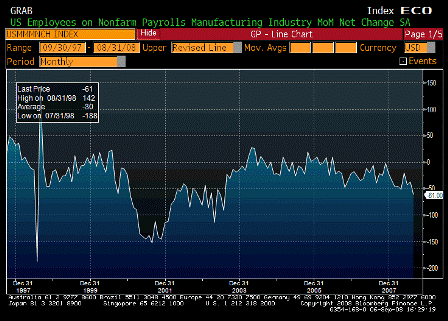
Change in Manufacturing Payrolls (Aug)
| Survey | -35K |
| Actual | -61K |
| Prior | -35K |
| Revised | -38K |
Mining-Manufacturing Employment ALLX (Aug)
Average Hourly Earnings MoM (Aug)
| Survey | 0.3% |
| Actual | 0.4% |
| Prior | 0.3% |
| Revised | 0.4% |
A bit of an uptick, but not problematic at this point.
Average Hourly Earnings YoY (Aug)
| Survey | 3.4% |
| Actual | 3.6% |
| Prior | 3.4% |
| Revised | n/a |
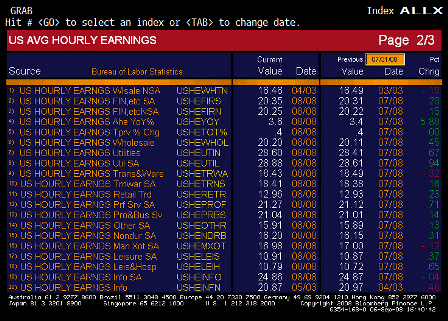
Average Hourly Earnings ALLX 1 (Aug)
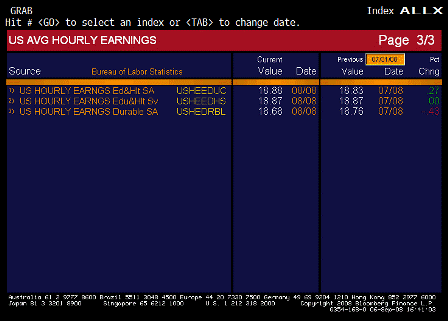
Average Hourly Earnings ALLX 2 (Aug)
Average Hourly Earnings ALLX 3 (Aug)
Average Weekly Hours (Aug)
| Survey | 33.6 |
| Actual | 33.7 |
| Prior | 33.6 |
| Revised | 33.7 |
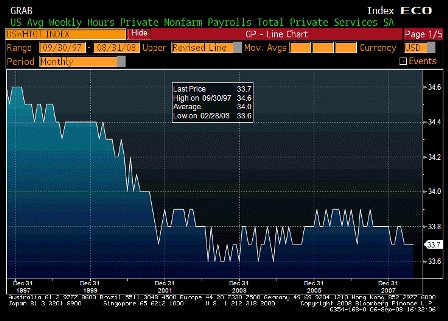
Hours per worker up, but total hours worked down due to job losses.
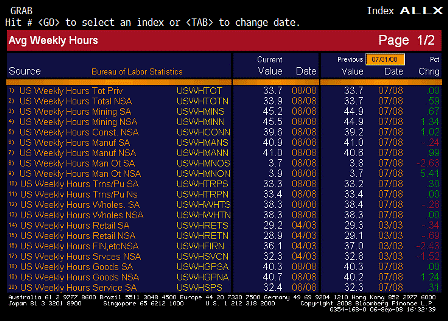
Average Weekly Hours ALLX 1 (Aug)
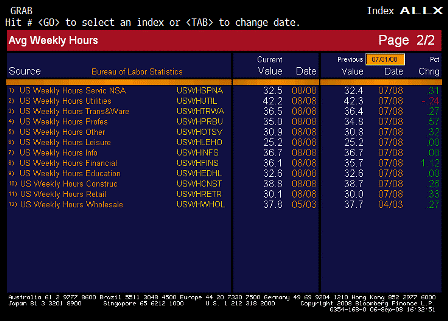
Average Weekly Hours ALLX 2 (Aug)
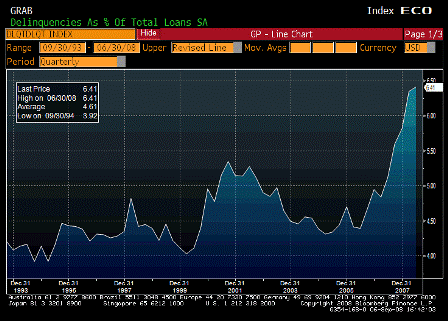
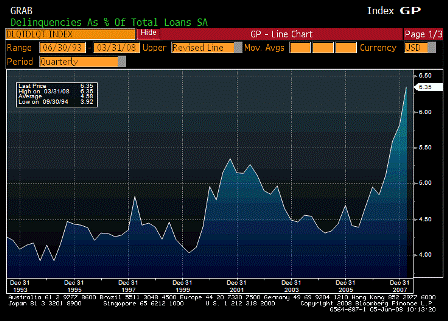
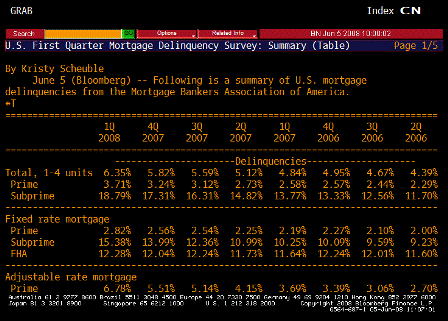
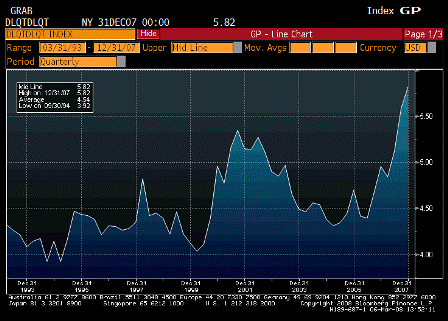
Mortgage Delinquencies (2Q)
| Survey | n/a |
| Actual | 6.41% |
| Prior | 6.35% |
| Revised | n/a |
Still going up, but possibly the rate of increase has slowed.
Should level off as mortgages granted on fraudulent applications were largely eliminated over a year ago.
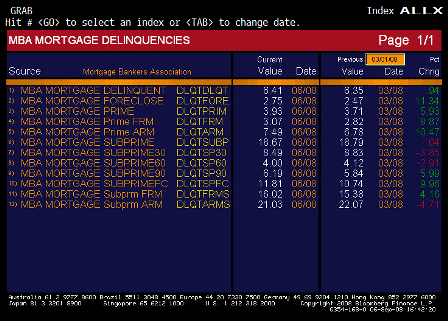
Mortgage Delinquencies ALLX (2Q)
[top]


