2008-05-15 US Economic Releases


[Skip to the end]


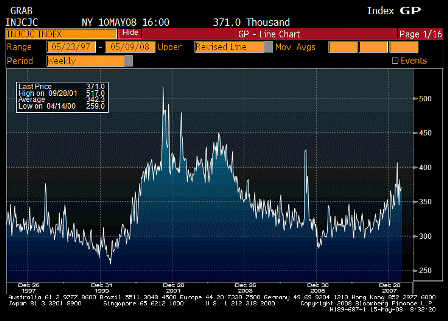
2008-05-15 Initial Jobless Claims

Initial Jobless Claims (May 10)

Survey 370K
Actual 371K
Prior 365K
Revised n/a

Looks like it’s past the peak.

[top][end]


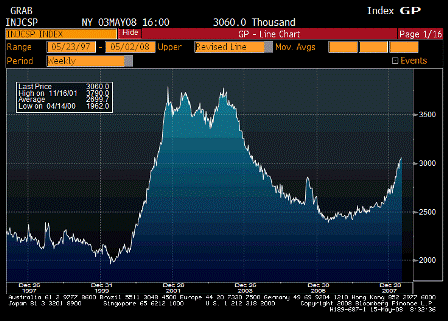
2008-05-15 Continuing Claims

Continuing Claims (May 3)

Survey 3035K
Actual 3060K
Prior 3020K
Revised 3032K

Looks like it’s not past the peak.

[top][end]


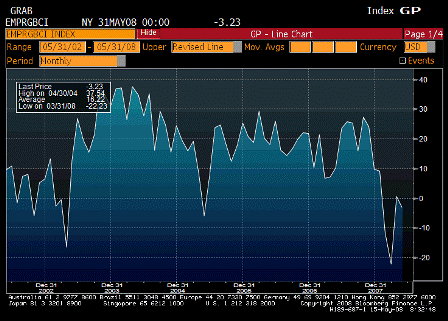
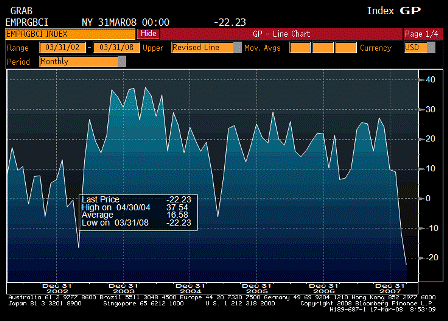
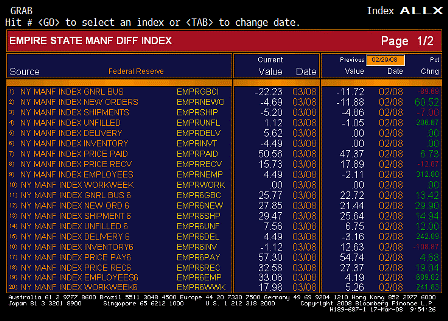
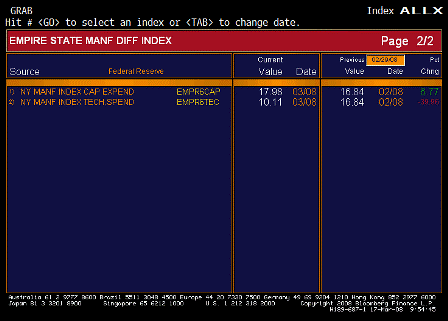
2008-05-15 Empire Manufacturing

Empire Manufacturing (May)

Survey 0.0
Actual -3.2
Prior 0.6
Revised n/a

Still off the bottom, needs another month to see where it’s going.

[top][end]


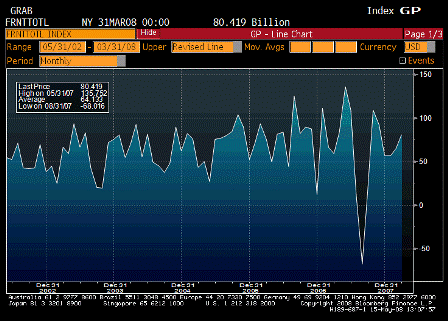
2008-05-15 Net Long-term TIC Flows

Net Long-term TIC Flows (Mar)

Survey $62.5B
Actual $80.4B
Prior $72.5B
Revised $64.9B

[top][end]


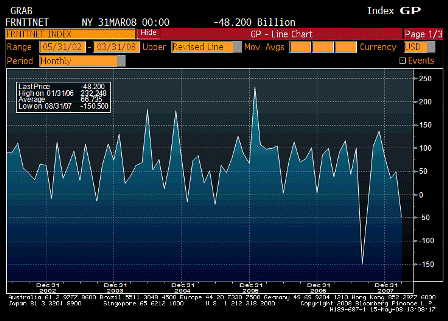
2008-05-15 Total Net TIC Flows

Total Net TIC Flows (Mar)

Survey $67.5B
Actual -$48.2B
Prior $64.1B
Revised $48.9B

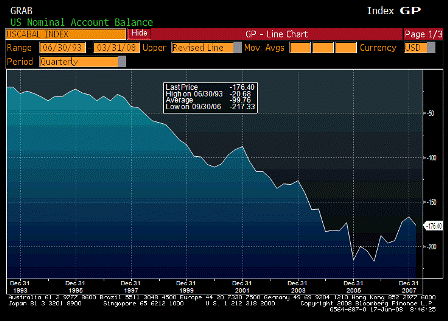
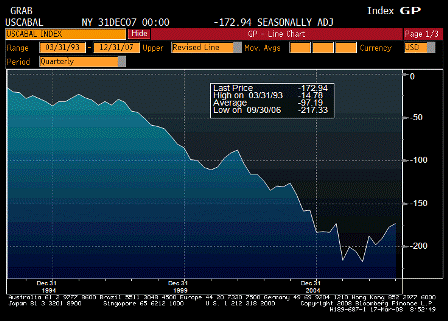
In general I expect these types of numbers to follow the trade gap down.

[top][end]


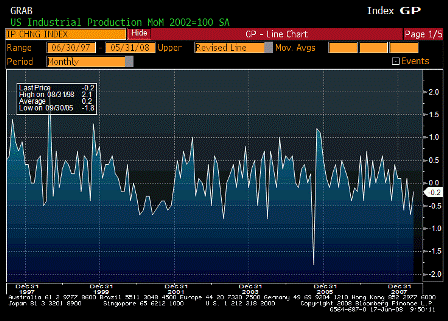
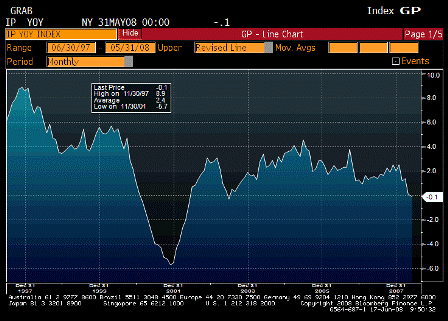
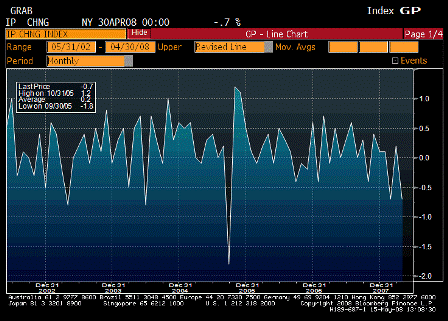
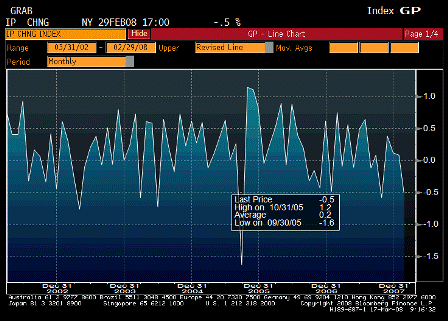
2008-05-15 Industrial Production

Industrial Production (Apr)

Survey -0.3%
Actual -0.7%
Prior 0.3%
Revised 0.2%

Still weak. Been weak for 50 years.

[top][end]


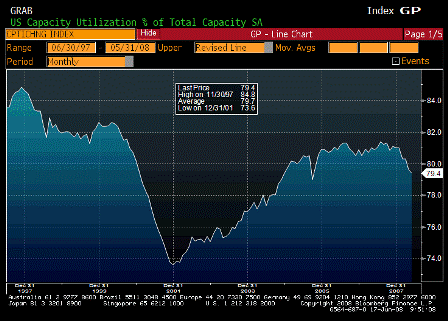
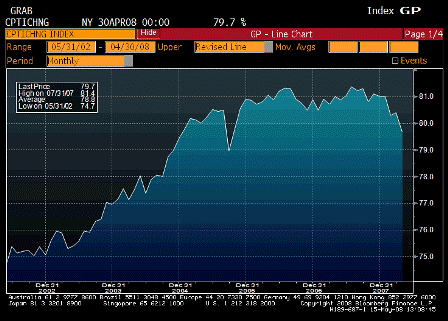
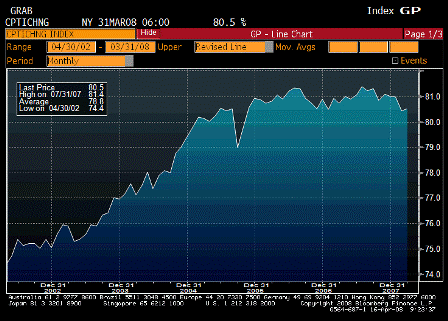
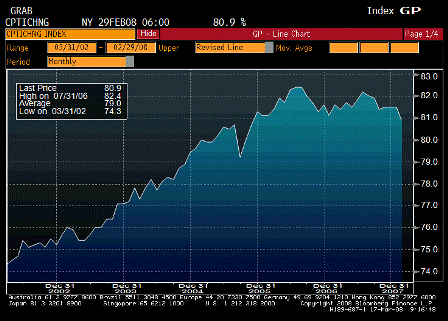
2008-05-15 Capacity Utilization

Capacity Utilization (Apr)

Survey 80.1%
Actual 79.7%
Prior 80.5%
Revised 80.4%

Weak, but not recession levels yet.

[top][end]


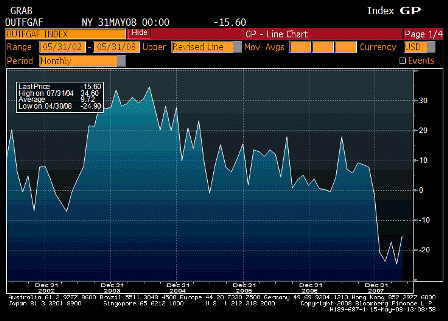
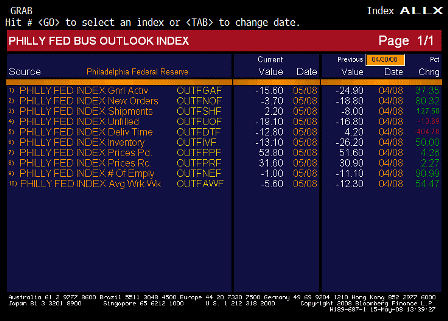
2008-05-15 Philadelphia Fed.

Philadelphia Fed. (May)

Survey -19.0
Actual -15.6
Prior -24.9
Revised n/a

2008-05-15 Philadelphia Fed. TABLE

Philadelphia Fed. TABLE

Perking up from low levels,
prices high and moving higher

[top][end]


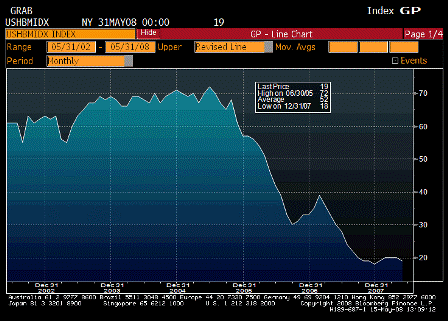
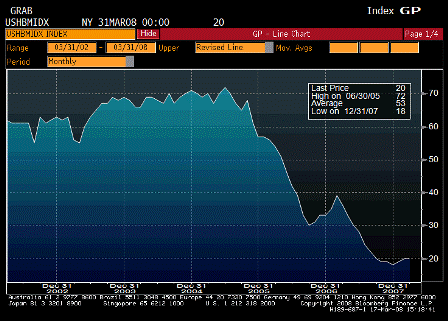
2008-05-15 NAHB Housing Market Index

NAHB Housing Market Index (May)

Survey 20
Actual 19
Prior 20
Revised n/a

Still off the lows and looking like a bottom to me.


[top]
2008-04-16 US Economic Releases

  • MBA Mortgage Applications
  • Bloomberg Global Confidence
  • Consumer Price Index
  • Housing Starts
  • Building Permits
  • Industrial Production
  • Capacity Utilization

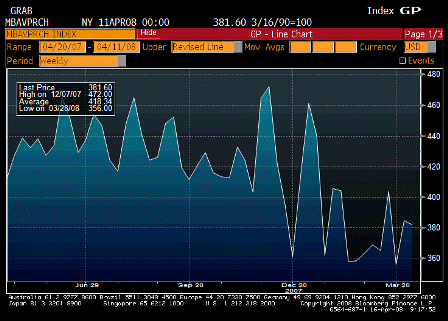
2008-04-16 MBAVPRCH Index

MBAVPRCH Index (Apr 11)

Survey n/a
Actual 381.6
Prior 384.7
Revised n/a

Holding in its new, lower range.


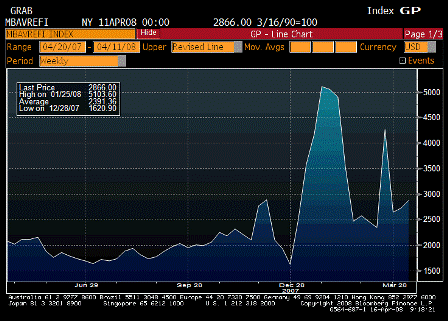
2008-04-16 MBAVREFI Index

MBAVREFI Index (Apr 11)

Survey n/a
Actual 2866.0
Prior 2724.7
Revised n/a

Doing ok in this prime time for resets, which are peaking and then falling off.


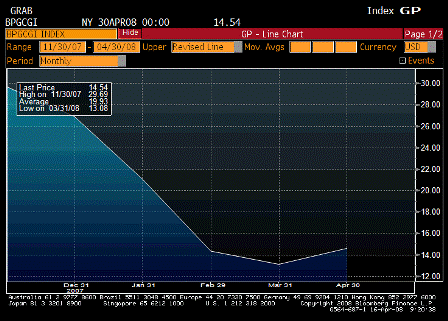
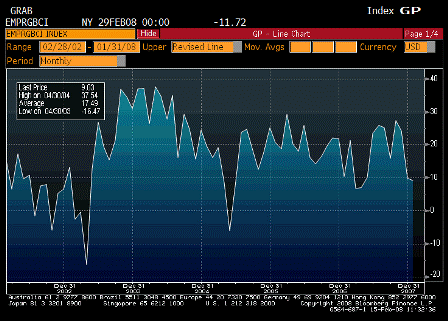
2008-04-16 Bloomberg Global Confidence

Bloomberg Global Confidence (Apr)

Survey n/a
Actual 14.54
Prior 13.08
Revised n/a

Still down, but signs of a bottom.


In my humble opinion, inflation is ripping, and the Fed’s in a very bad place. April’s food and energy price hikes, along with hosts of others, and the weaker USD all are pointing to an upward surge for prices on a forward looking basis.The Fed’s forecasting models should be showing higher inflation as well.And futures markets continue to be an unreliable forecasting tool for the Fed.

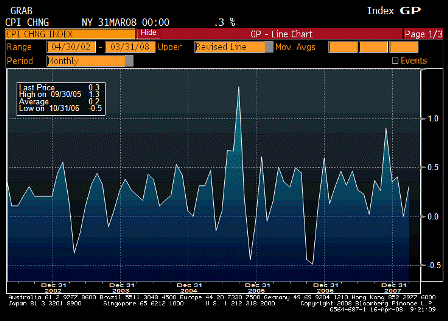
2008-04-16 Consumer Price Index MoM

Consumer Price Index MoM (Mar)

Survey 0.3%
Actual 0.3%
Prior 0.0%
Revised n/a

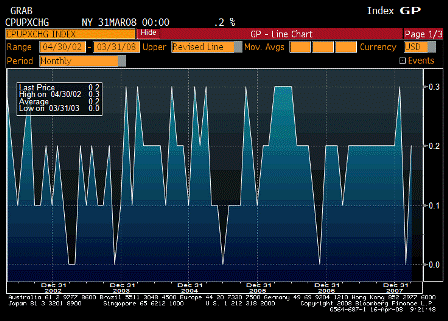
2008-04-16 CPI Ex Food & Energy MoM

CPI Ex Food & Energy MoM (Mar)

Survey 0.2%
Actual 0.2%
Prior 0.0%
Revised n/a

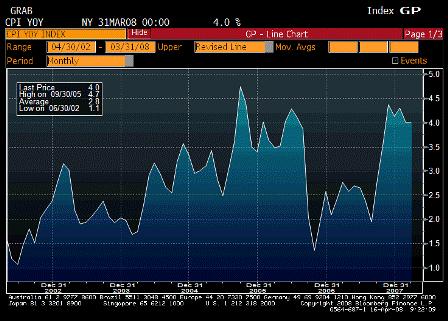
2008-04-16 Consumer Price Index YoY

Consumer Price Index YoY (Mar)

Survey 4.0%
Actual 4.0%
Prior 4.0%
Revised n/a

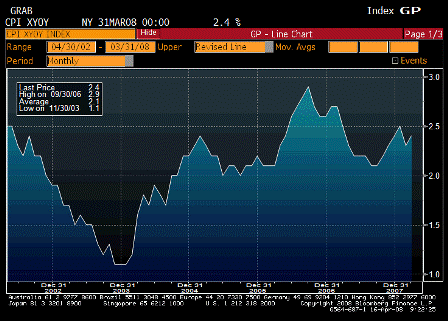
2008-04-16 CPI Ex Food & Energy YoY

CPI Ex Food & Energy YoY (Mar)

Survey 2.4%
Actual 2.4%
Prior 2.3%
Revised n/a

From Karim:

Headline/Core divergence->limited passthrough

  • Headline 0.343% and stays at 4% y/y

  • Core rises 0.152% (after 0.04% last month), showing limited pass-through from headline and even more limited pass-through from wholesale level (PPI from yday).

  • Core rises from 2.3% to 2.4%, equates to about 1.9-2.0% on core PCE basis due to measurement differences

  • Food up 0.2% and gas up 1.3%

  • OER up 0.2%, apparel down 1.3%, vehicles down 0.1%

  • Lodging away from home down 0.6% and medical up only 0.1%, a bit below trend

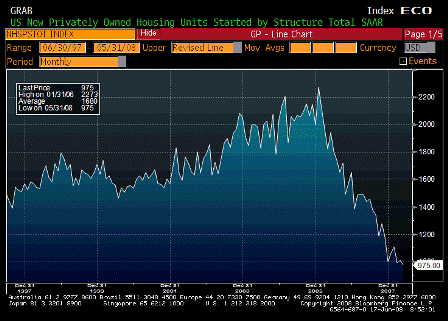
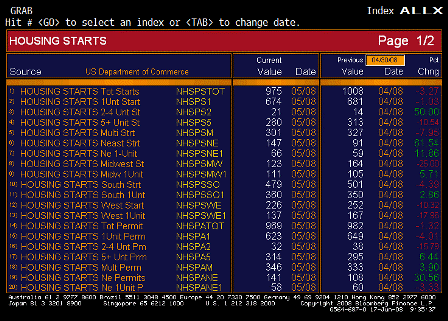
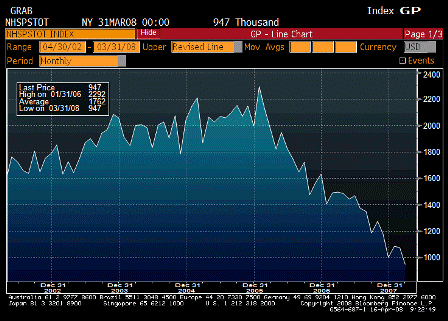
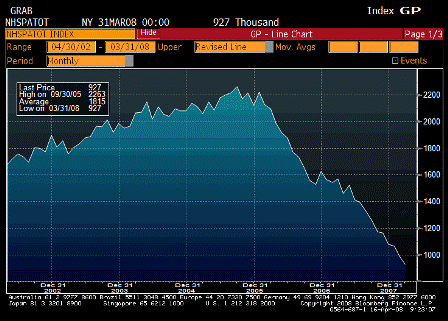
Housing starts not looking good. The glimmer of hope is that prior months have been revised up for the last two reports, so there’s a chance this number could be revised substantially as well.

2008-04-16 Housing Starts

Housing Starts (Mar)

Survey 1010K
Actual 947K
Prior 1065K
Revised 1075K

2008-04-16 Building Permits

Building Permits (Mar)

Survey 970K
Actual 927K
Prior 978K
Revised 984K

From Karim:

Housing data shows drag continuing with at least the same intensity

  • Starts down 11.9%, boding poorly for current GDP

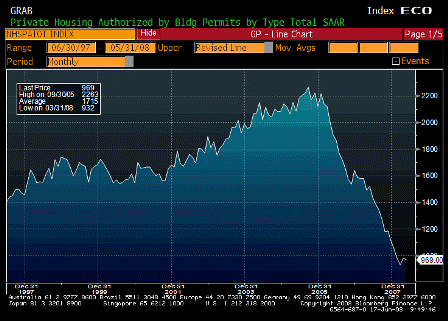
  • Permits down 5.8%, boding poorly for future GDP

  • Best news is not adding to inventories

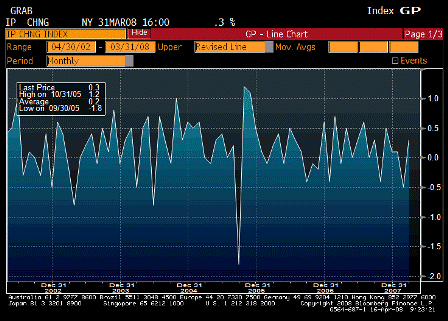
2008-04-16 Industrial Production

Industrial Production (Mar)

Survey -0.1%
Actual 0.3%
Prior -0.5%
Revised -0.7%

May be due to exports, which are keeping GDP and employment muddling through


2008-04-16 Capacity Utilization

Capacity Utilization (Mar)

Survey 80.3%
Actual 80.5%
Prior 80.9%
Revised 80.3%

Staying too high for the typical recession.

2008-02-15 US Economic Releases

2008-02-15 Empire Manufacturing

Empire Manufacturing (Feb)

Survey 6.5
Actual -11.7
Prior 9.0
Revised n/a

Down, but it has been lower, not yet to previous recession levels.


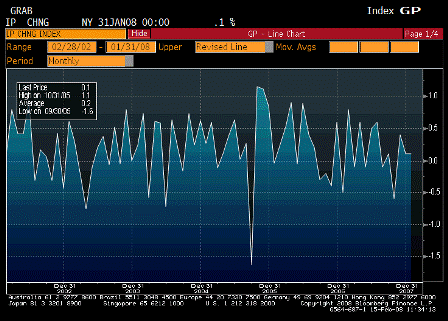
2008-02-15 Industrial Production

Industrial Production (Jan)

Survey 0.1%
Actual 0.1%
Prior 0.0%
Revised 0.1%

Modestly positive, and not at recession levels.


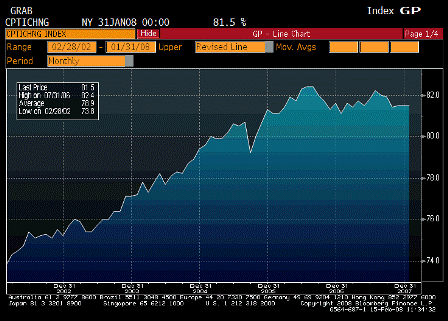
2008-02-15 Capacity Utilization

Capacity Utilization (Jan)

Survey 81.3%
Actual 81.5%
Prior 81.4%
Revised 81.5%

Holding up reasonably well.


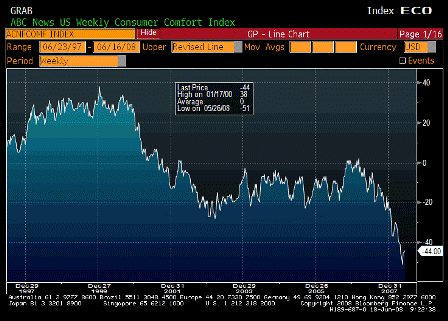
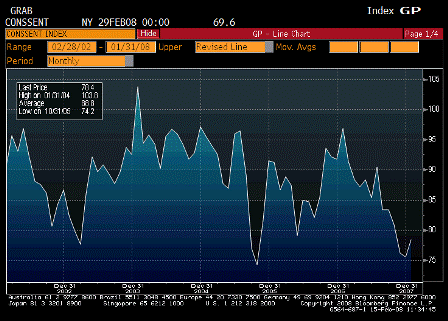
2008-02-15 U. of Michigan Confidence

U. of Michigan Confidence (Feb P)

Survey 76.0
Actual 69.6
Prior 78.4
Revised n/a

The CNBC effect keeping expectations down.

One year inflation expectations jumped to 3.7% putting the Fed on high alert.


♥

2008-01-16 US Economic Releases

2008-01-16 Mortgage Applications

Average Mortgage Purchasing Index (Jan 11)

Survey n/a
Actual 461.20
Prior 414.00
Revised n/a

2008-01-16 Mortgage Applications

Mortgage Refi’s (Jan 11)

Survey n/a
Actual 3575.50
Prior 2494.20
Revised n/a

Purchase index back on uptrend, refi way up. Lower rates and return of market functioning coming together nicely.

Still looks like housing could have bottomed October/November, but jury is still out pending data and revisions.

JP Morgan mtg revenue spiked up as JPM gains market share in mtg markets.

Houses are cheaper, lenders aggressive with real buyers, and income has continued higher.

See Mortgage applications soar.


2008-01-16 Consumer Price Index MoM

Consumer Price Index MoM (Dec)

Survey 0.2%
Actual 0.3%
Prior 0.8%
Revised n/a

2008-01-16 CPI Ex Food & Energy MoM

CPI Ex Food & Energy MoM (Dec)

Survey 0.2%
Actual 0.2%
Prior 0.3%
Revised n/a

2008-01-16 Consumer Price Index YoY

Consumer Price Index YoY (Dec)

Survey 4.1%
Actual 4.1%
Prior 4.3%
Revised n/a

2008-01-16 CPI Ex Food & Energy YoY

CPI Ex Food & Energy YoY (Dec)

Survey 2.4%
Actual 2.4%
Prior 2.3%
Revised n/a

See Food/fuel/$ bakes in core.


2008-01-16 Industrial Production

Industrial Production (Dec)

Survey -0.2%
Actual 0.0%
Prior 0.3%
Revised n/a

Graph looks OK – holding its own!


2008-01-16 Capacity Utilization

Capacity Utilization (Dec)

Survey 81.2%
Actual 81.4%
Prior 81.5%
Revised 81.6%

Drifting off some, but still at a relatively high level.


2008-01-16 NAHB Housing Market Index

NAHB Housing Market Index (Jan)

Survey 19
Actual 19
Prior 19
Revised 18

Rounding bottom?


♥