2008-12-16 USER


[Skip to the end]


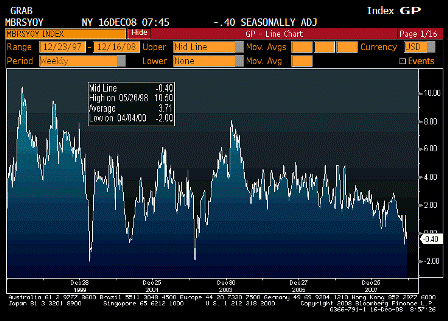
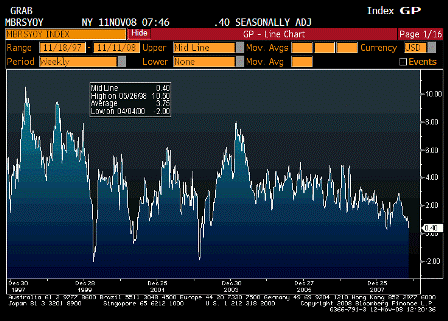
ICSC UBS Store Sales YoY (Dec 16)

Survey n/a
Actual -0.40%
Prior 0.40%
Revised n/a

 
Continues to move lower.

[top][end]

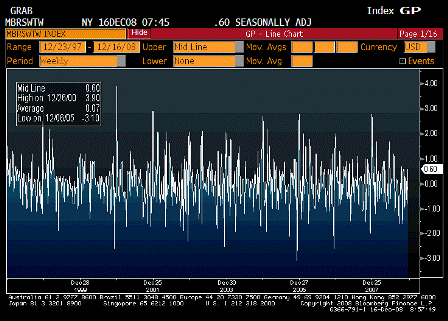
ICSC UBS Store Sales WoW (Dec 16)

Survey n/a
Actual 0.60%
Prior -0.80%
Revised n/a

[top][end]

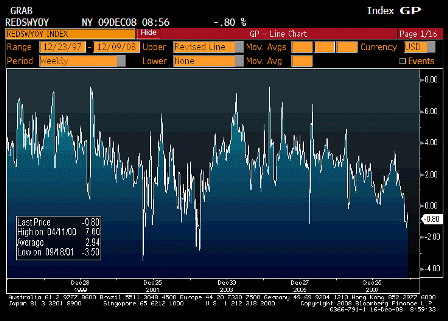
Redbook Store Sales Weekly YoY (Dec 9)

Survey n/a
Actual -0.80%
Prior -0.40%
Revised n/a

 
Continues to move lower.

[top][end]

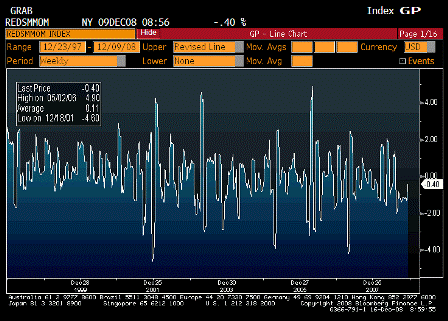
Redbook Store Sales MoM (Dec 9)

Survey n/a
Actual -0.40%
Prior -1.10%
Revised n/a

[top][end]

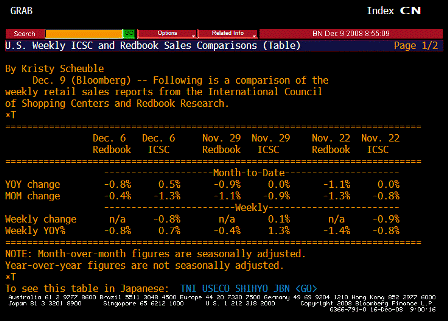
ICSC UBS Redbook Comparison TABLE (Dec 9)
[top][end]

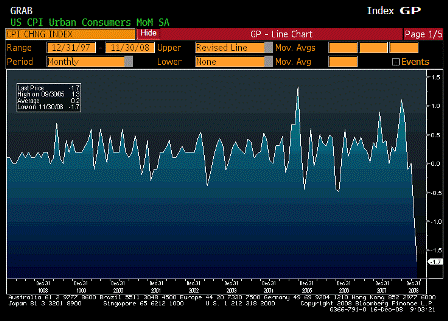
Consumer Price Index MoM (Nov)

Survey -1.3%
Actual -1.7%
Prior -1.0%
Revised n/a


Karim writes:

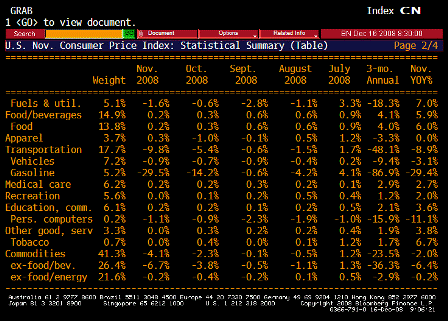
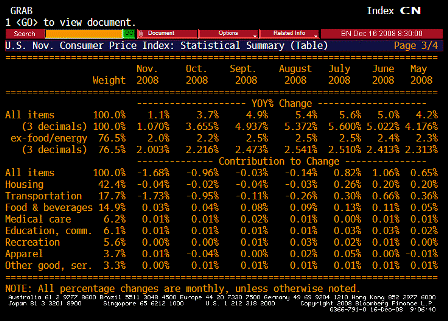
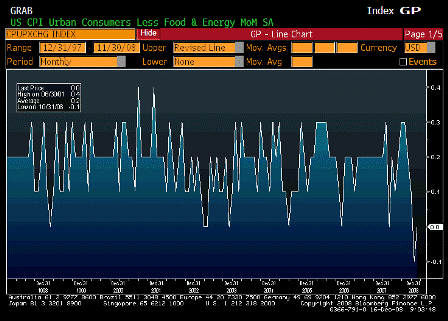
  • Headline CPI dropped 1.7% M/M in November after 1.0% decline last month (Y/Y now at +1.1%)
  • Core was flat in November after 0.1% decline (Y/Y at 2.0% and 3 month annualized at 0.4%… core is decelerating quickly and inflation certainly not a concern for Fed at this point)
  • OER was up 0.3% M/M, but partly due to a decline in utility prices that increases economic rents
[top][end]

CPI Ex Food and Energy MoM (Nov)

Survey 0.1%
Actual 0.0%
Prior -0.1%
Revised n/a

[top][end]

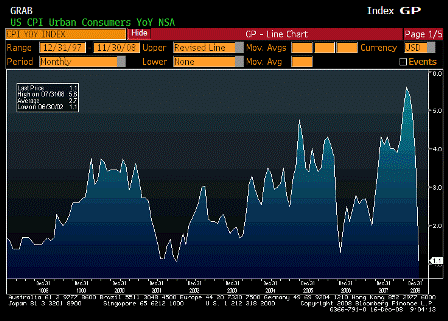
Consumer Price Index YoY (Nov)

Survey 1.5%
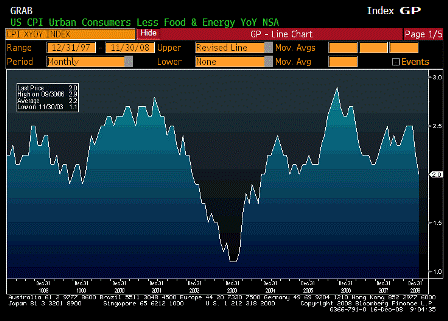
Actual 1.1%
Prior 3.7%
Revised n/a

 
Way down, as crude oil and gasoline are lower than they were last year.
[top][end]

CPI Ex Food and Energy YoY (Nov)

Survey 2.1%
Actual 2.0%
Prior 2.2%
Revised n/a

 
Core drifting lower though owner equivalent rent went up .30% as utility costs fell and rents stayed about the same.
[top][end]

CPI Core Index SA (Nov)

Survey n/a
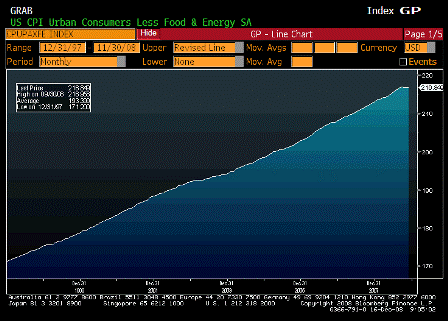
Actual 216.849
Prior 216.801
Revised n/a

[top][end]

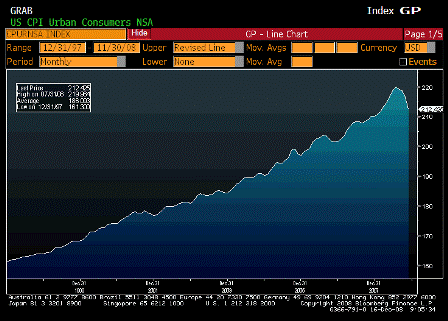
Consumer Price Index NSA (Nov)

Survey 212.699
Actual 212.425
Prior 216.573
Revised n/a

[top][end]

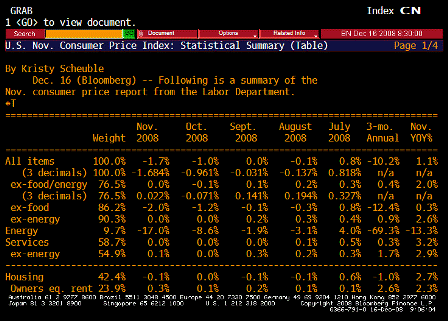
Consumer Price Index TABLE 1 (Nov)

[top][end]

Consumer Price Index TABLE 2 (Nov)

[top][end]

Consumer Price Index TABLE 3 (Nov)

[top][end]

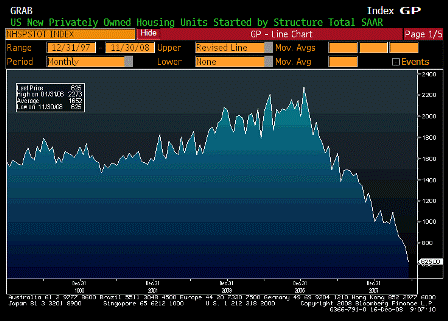
Housing Starts (Nov)

Survey 763K
Actual 625K
Prior 791K
Revised 771K

 
Keeps falling as the headlines have the public and financial institutions scared stiff.

Karim writes:

  • Housing Starts dropped to 625k in November (record low with about 50 years of data!) from 771k last month and 1,179k last year (this should put more downward pressure on residential investment in GDP through early 2009)
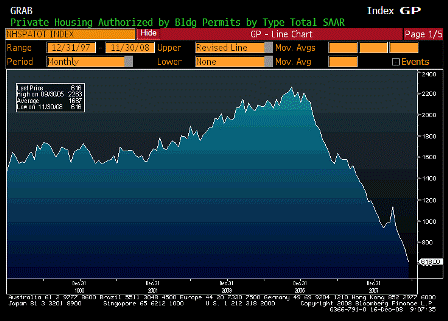
  • Permits dropped to 616k in November (record low with about 50 years of data!) from 730k last month and 1,111k last year
  • Token “Sliver” lining- less pressure on inventories from new homes
[top][end]

Building Permits (Nov)

Survey 700K
Actual 616K
Prior 708K
Revised 730K

[top][end]


[top]
2008-11-12 USER


[Skip to the end]


ICSC UBS Store Sales YoY (Nov 11)

Survey n/a
Actual 0.4%
Prior 0.9%
Revised n/a

[top][end]

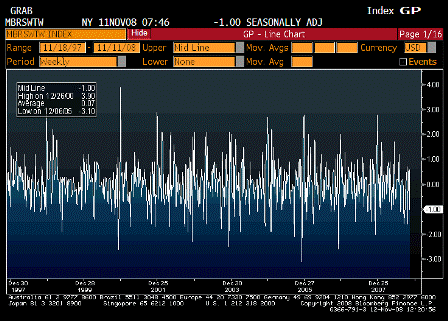
ICSC UBS Store Sales WoW (Nov 11)

Survey n/a
Actual -1.0%
Prior 0.6%
Revised n/a

[top][end]

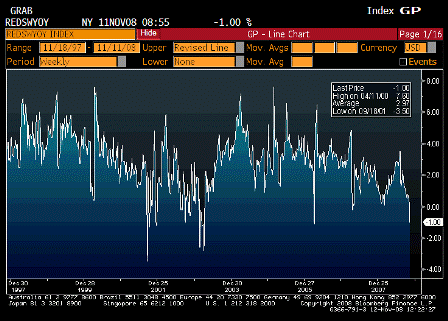
Redbook Store Sales Weekly YoY (Nov 11)

Survey n/a
Actual -1.0%
Prior 0.3%
Revised n/a

[top][end]

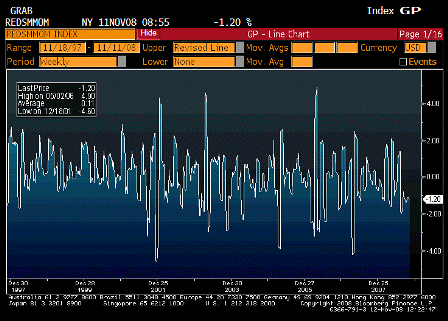
Redbook Store Sales MoM (Nov 11)

Survey n/a
Actual -1.2%
Prior -1.2%
Revised n/a

[top][end]

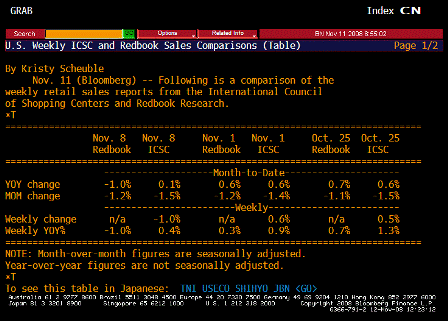
ICSC UBS Redbook Comparison TABLE (Nov 11)


[top]
Chain Store Sales


[Skip to the end]

Doesn’t look as bad as many would expect.

Maybe it’s being supported by lower fuel prices.

TABLE-US chain store sales fell 1.0 pct last week-ICSC

(Reuters) The International Council of Shopping Centers and Goldman Sachs on Tuesday released the following seasonally adjusted weekly data on U.S. chain store retail sales.
 

WEEK ENDING INDEX 1977=100 YEAR/YEAR CHANGE WEEKLY CHANGE
(percent) (percent)
Nov 8 477.2 0.4 -1.0
Nov 1 482.0 0.9 0.6
Oct 25 479.3 1.3 0.5
Oct 18 477.0 0.9 -1.6

 
The ICSC weekly U.S. retail chain store sales index is a joint publication between ICSC and Goldman Sachs Group Inc. It measures nominal same-store sales, excluding restaurant and vehicle demand, and represents about 75 retail chain stores.


[top]
2008-10-07 USER


[Skip to the end]


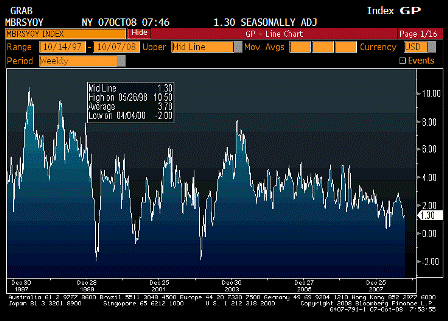
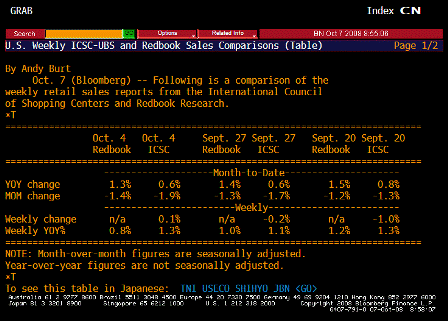
ICSC UBS Store Sales YoY (Oct 7)

Survey n/a
Actual 1.30%
Prior 1.10%
Revised n/a

 
No collapse here yet.

[top][end]

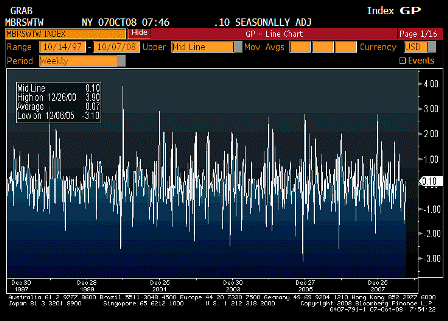
ICSC UBS Store Sales WoW (Oct 7)

Survey n/a
Actual 0.10%
Prior -0.20%
Revised n/a

 
Muddling through here as well.

[top][end]


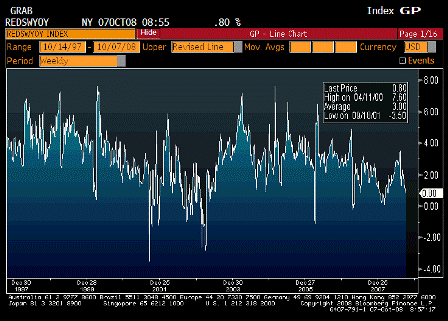
Redbook Store Sales Weekly YoY (Oct 7)

Survey n/a
Actual 0.80%
Prior 1.00%
Revised n/a

 
Still weak, but not yet a collapse.

[top][end]

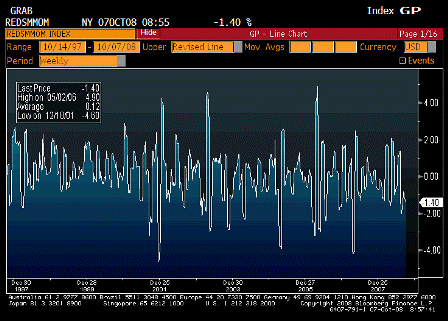
Redbook Store Sales MoM (Oct 7)

Survey n/a
Actual -1.40%
Prior -1.30%
Revised n/a

 
Also weakening.

[top][end]

ICSC UBS Redbook Comparison TABLE (Oct 7)

[top][end]


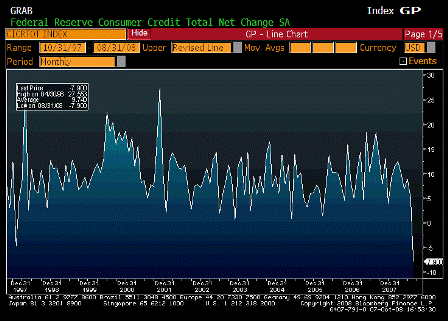
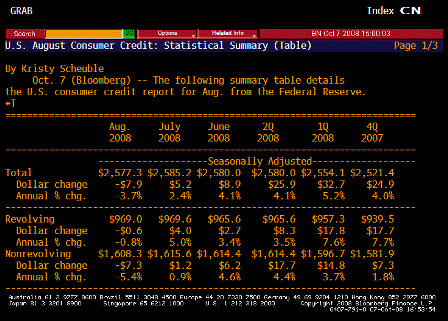
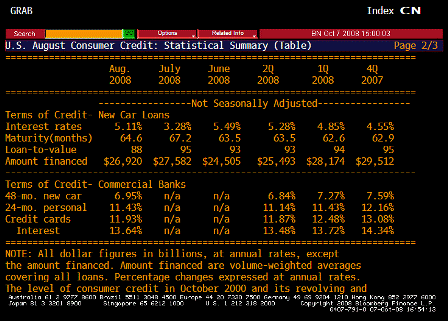
Consumer Credit (Aug)

Survey $5.0B
Actual -$7.9B
Prior $4.6B
Revised $5.2B

 
This is a collapse!

Consumers petrified from daily drubbing of the stock market and news media.

Payroll tax holiday now!

[top][end]

Consumer Credit TABLE 1 (Aug)

[top][end]

Consumer Credit TABLE 2 (Aug)


[top]
2008-08-07 US Economic Releases


[Skip to the end]


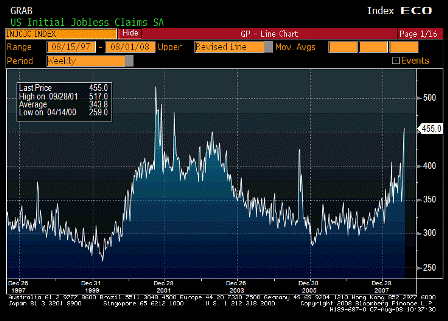
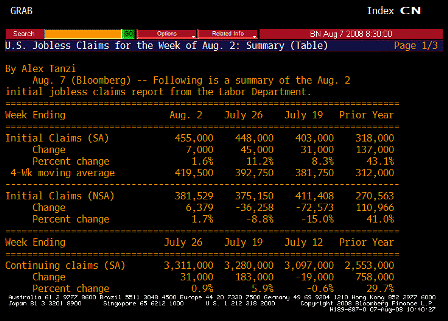
Initial Jobless Claims (Aug 2)

Survey 425K
Actual 455K
Prior 448K
Revised n/a

Karim writes:

  • Initial claims rise 7k to new cycle high of 455k with 4wk moving avg up from 393k to 420k

[top][end]

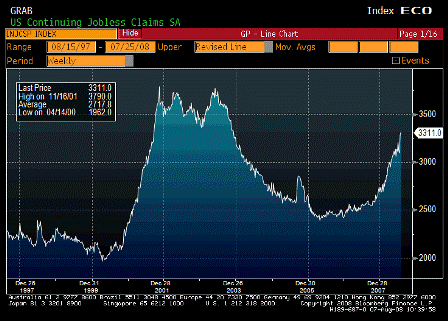
Continuing Jobless Claims (Jul 26)

Survey 3255K
Actual 3311K
Prior 3282K
Revised 3280K

Karim writes:

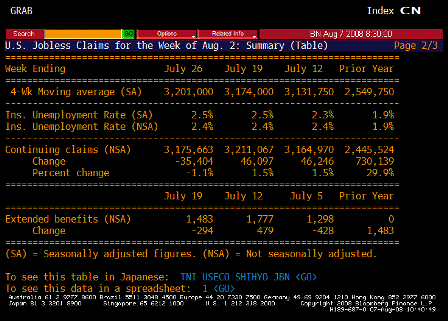
  • Continuing claims rise from 3280k to 3311k and 4wk moving avg up from 3174k to 3201k

[top][end]

Jobless Claims TABLE 1 (Jul 26)

[top][end]

Jobless Claims TABLE 2 (Jul 26)

Cesar writes:

A year ago we were at 4.7% unemployment rate (7,137 unemployed/ 153,182 labor force)

We are currently at 5.7% unemployment rate (8,784 unemployed/ 154,603 labor force)

Seems nearly the entire jump in unemployment is due to labor force increases.

Total employed is about flat.

In that case, GDP growth is about equal to productivity growth.

Karim writes:

  • Initial claims somewhat distorted by new program to extend benefits where those filing extensions are considered first time filers (double counted); this should have an effect for the first 2-3 weeks of the program before initial claims fall back to trend level (same happened back in 2001). Last week was first week of program, so numbers for next 2 weeks should reflect underlying trend (last number before extension program was 403k). Of concern would be if numbers don’t fall back much.
  • This program does not effect continuing claims, which reflects ability to find a job once laid off. This is at a new cycle high.

[top][end]


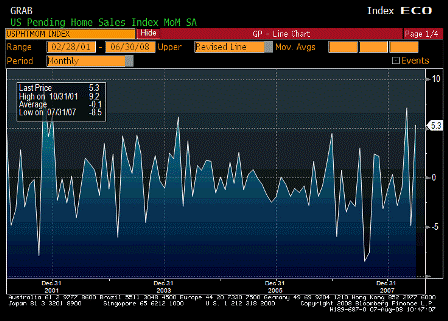
Pending Home Sales MoM (Jun)

Survey -1.0%
Actual 5.3%
Prior -4.7%
Revised -4.9%

Karim writes:

  • Rise 5.3% m/m, continuing recent see-saw pattern (-4.9%, +7.1% prior 2mths).

Q2 GDP for Japan and Germany are out next week. A German newspaper yesterday leaked German GDP growth likely to be -1 to -1.5%. Much of this is a giveback for a strong Q1 of +1.5% but definitely weaker than expected. Of concern to the ECB is that Spain (industrial production now down 10% y/y) and Italy already written off, so much depends on Germany. Moreover, German PMIs have gotten off to a very weak start for Q3. I imagine that was at the root of Trichet’s more dovish tone today.

Estimates for Japanese Q2 GDP are in the -1% to -3.5% range. The July Tankan and the foreign orders component of last night’s machinery orders data also don’t bode too well for Q3.

[top][end]

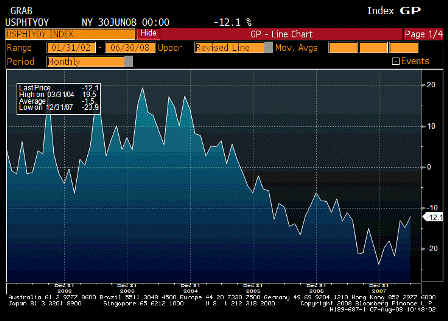
Pending Home Sales YoY (Jun)

Survey n/a
Actual -12.1%
Prior -14.8%
Revised n/a

Looks like it has bottomed and moving up as prices have adjusted and GDP has improved.

Housing my no longer be subtracting from GDP.

[top][end]

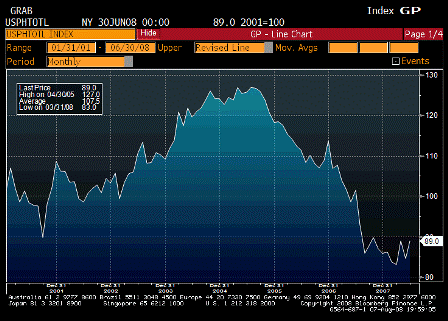
Pending Home Sales Total SA (Jun)

Survey n/a
Actual 89.0
Prior 84.5
Revised n/a

Looks to have found support and probably bottomed albeit at very low levels.

[top][end]

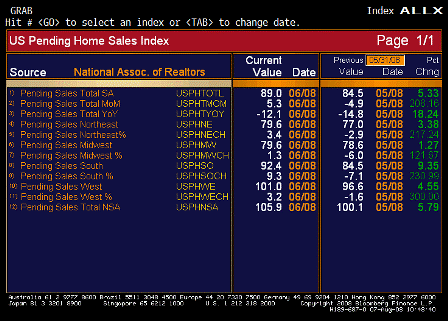
Pending Home Sales ALLX (Jun)

[top][end]


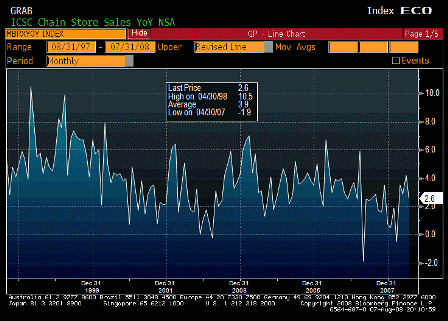
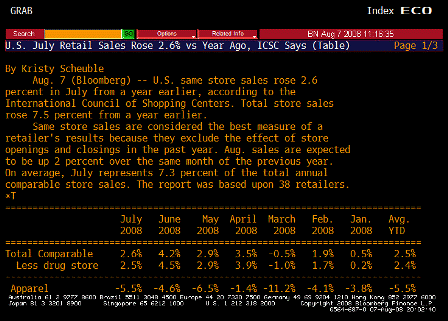
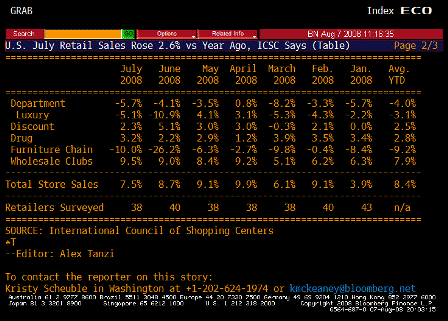
ICSC Chain Store Sales YoY (Jul)

Survey 3.4%
Actual 2.6%
Prior 4.3%
Revised 4.2%

Less then expected but not bad.

[top][end]

ICSC TABLE 1 (Jul)

[top][end]

ICSC TABLE 2 (Jul)

[top][end]


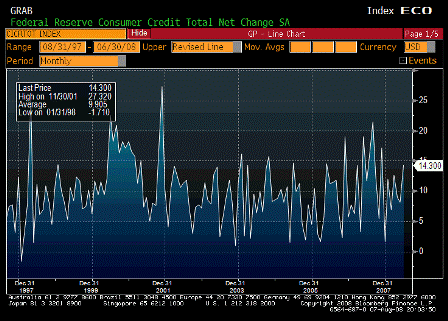
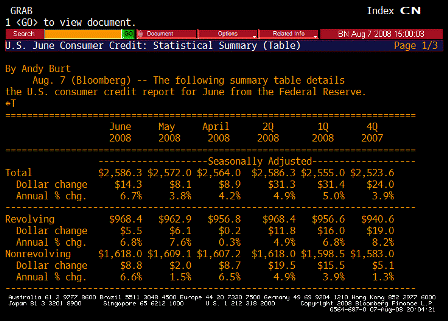
Consumer Credit (Jun)

Survey $6.3B
Actual $14.3B
Prior $7.8B
Revised $8.1B

Volatile series. Moving up some to support higher levels of spending.

[top][end]

Consumer Credit TABLE 1 (Jun)

[top][end]

Consumer Credit TABLE 2 (Jun)

Note from the graph the improving position of the domestic sector as the government deficit and net exports rise and support domestic ‘savings’ and spending. The US budget deficit is expected to exceed 3% this year and exports should remain firm even with slowing foreign economies. In fact, that’s one of the primary reasons those economies are slowing.

U.S. June Consumer Credit Up $14.3 Billion, More Than Forecast

by Shobhana Chandra

(Bloomberg) U.S. consumers borrowed more than twice as much as economists forecast in June as the slump in real-estate prices prevented American homeowners from tapping into home-equity lines of credit.

Consumer credit rose by $14.3 billion, the most since November, to $2.59 trillion, the Federal Reserve said today in Washington. In May, credit rose by $8.1 billion, previously reported as an increase of $7.8 billion. The Fed’s report doesn’t cover borrowing secured by real estate.

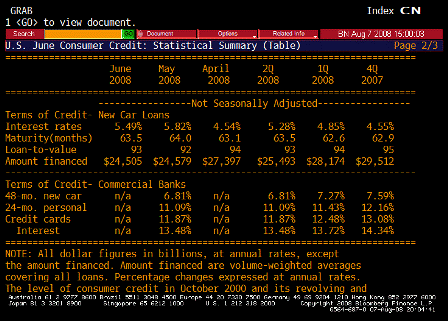
Consumers are using credit cards and loans to cover expenses as falling home values cause banks to restrict access to home- equity lines. The Bush administration sent out tax rebate checks in the past three months to help support spending, which accounts for more than two-thirds of the economy.

“Consumers are stressed, and some who are short of cash are relying more on credit cards,” Joseph Brusuelas, chief economist at Merk Investments LLC in Palo Alto, California, said before the report.


[top]
2008-07-10 US Economic Releases


[Skip to the end]

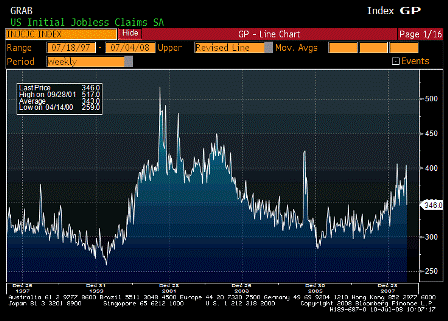
Initial Jobless Claims (Jul 5)

Survey 395K
Actual 346K
Prior 404K
Revised n/a

[top][end]

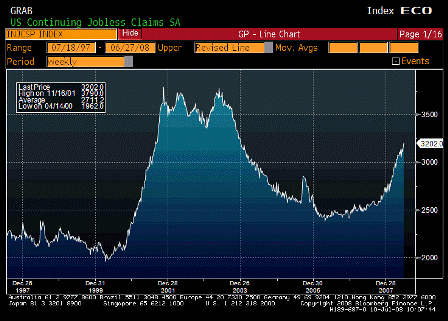
Continuing Jobless Claims (Jun 28)

Survey 3140K
Actual 3202K
Prior 3116K
Revised 3111K

Karim writes:

Initial claims down 58k to 346k; number distorted by seasonal adjustments related to expected annual maintenance at auto factories.

Claims number was adjusted to anticipate more seasonal layoffs in autos than occurred. When the expected add back doesn’t occur as expected, claims should return to prior level, all else being equal. Labor department official states the decline ‘a question of timing’,

Yes, it all comes out in the wash, but it takes a while; so, the 4 week moving average is a more useful indicator.

4wk avg drops to 380.5k from 390.5k.

Continuing claims jumps 91k to new cycle high of 3.202 million, highest since 12/03.

Higher continuing claims reflects lack of hiring and is related to longer duration of unemployment (and likely more tepid wage demands from those looking to find a job).

Also, with productivity running higher than GDP growth, by definition that means the growing real output can be accomplished with slightly fewer workers.

Twin themes remain: weakness due to lack of demand and higher prices due to higher costs of fuel/food/imports.

The numbers also show business would rather hire people already working than the unemployed, so the long term trend of more and more persistent long-term unemployment continues.

See ‘Full Employment and Price Stability‘ for ‘the answer’ and also the ‘base case’ for analysis.

[top][end]


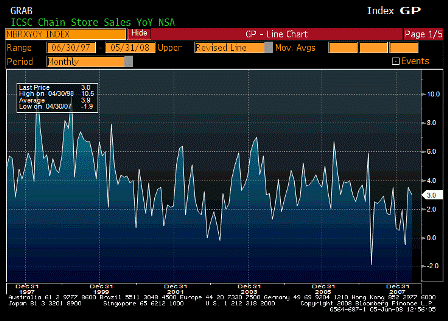
ICSC Chain Store Sales YoY (Jun)

Survey 3.3%
Actual 4.3%
Prior 3.0%
Revised 2.9%

Way better than expected. Hard for mainstream economists to believe fiscal policy will do much. They put their faith in interest rates, which never have done much, at least not in the intended direction.


[top]

2008-06-05 US Economic Releases


[Skip to the end]


2008-06-05 Initial Jobless Claims

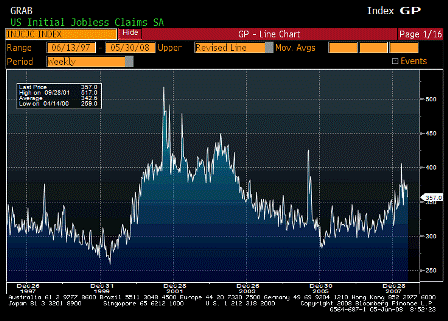
Initial Jobless Claims (May 31)

Survey 375K
Actual 357K
Prior 372K
Revised 375K

Whoops, no recession here – the ‘better than expected’ trend continues.

[top][end]


2008-06-05 Continuing Jobless Claims

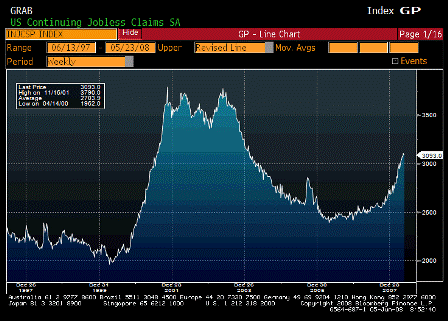
Continuing Claims (May 24)

Survey 3110K
Actual 3093K
Prior 3104K
Revised 3109K

And these are now coming off as well.

The Great Repricing of Risk -‘the worst recession since the Great Depression’- is looking more like a tiny blip for the real economy?

[top][end]


2008-06-05 Mortgage Delinquencies

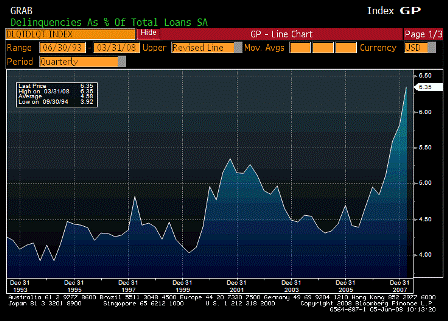
Mortgage Delinquencies (1Q)

Survey n/a
Actual 6.35%
Prior 5.82%
Revised n/a

[top][end]

2008-06-05 Mortgage Delinquencies Survey

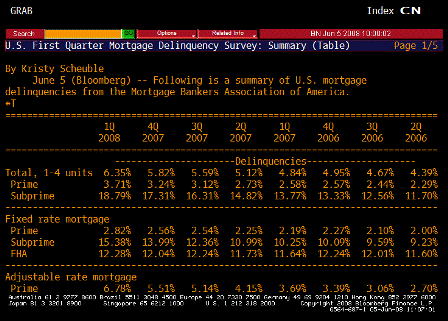
Mortgage Delinquencies Survey

Lagging indicators that shows how bad it was, probably in Q4 2007.
[top][end]


2008-06-05 ICSC Chain Store Sales YoY

ICSC Chain Store Sales YoY (May)

Survey 1.8%
Actual 3.0%
Prior 3.6%
Revised 3.5%

And yet another better than expected number.

The recent numbers are most likely better than Fed forecasters expected as well


[top]

2008-03-06 US Economic Releases

2008-03-06 Initial Jobless Claims

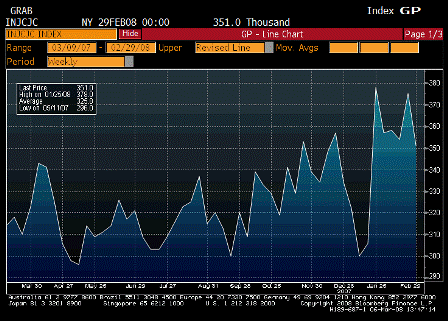
Initial Jobless Claims (Mar 1)

Survey 360K
Actual 351K
Prior 373K
Revised 375K

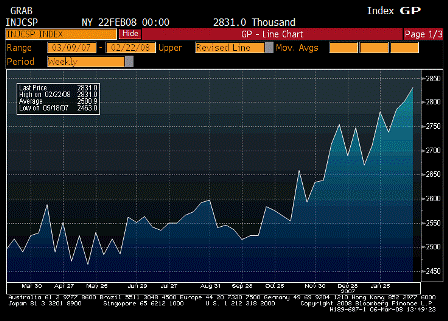
So far staying near the 4 week average of about 360,000. While higher than before, this is no longer high enough for a large enough output gap to address the now elevated rate of inflation and upward creeping inflation expectations.


2008-03-06 Continuing Claims

Continuing Claims (Feb 23)

2008-03-06 Continuing Claims since 1985

Continuing Claims since 1985

Survey 2810K
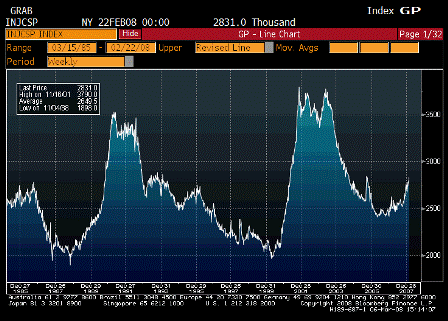
Actual 2831K
Prior 2807K
Revised 2802K

This too, is far to low for an output gap that the Fed may deem necessary to bring down inflation. The longer term chart is more informative in this regard.


2008-03-06 Pending Home Sales MoM

Pending Home Sales MoM (Jan)

Survey -1.0%
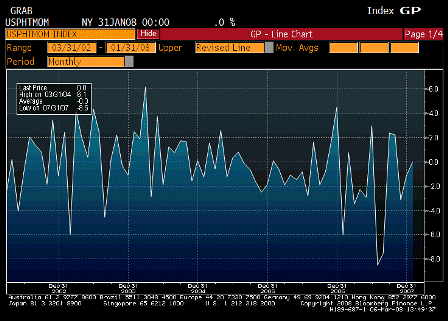
Actual 0.0%
Prior -1.5%
Revised -1.2%

The last thing the Fed needs is for housing to pick up now and shrink the current output gap.
That would put them hundreds of basis points behind the inflation curve.


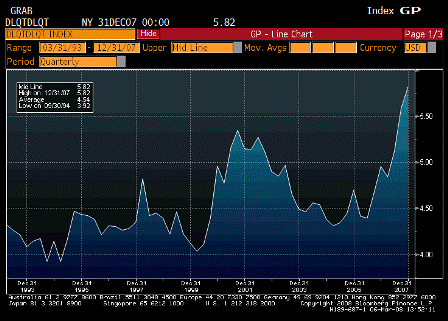
2008-03-06 Mortgage Delinquencies

Mortgage Delinquencies (4Q)

Survey n/a
Actual 5.82%
Prior 5.59%
Revised n/a

Mostly the sub prime buldge, but higher quality mtg delinquencies are up as well. Again, with higher inflation, the Fed needs a larger output gap.


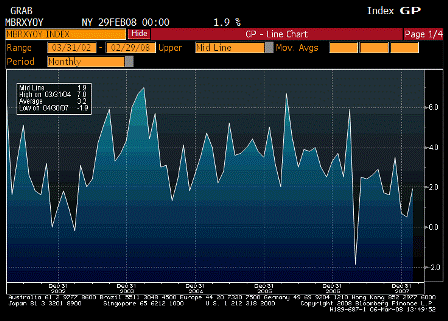
2008-03-06 ICSC Chain Store Sales YoY

ICSC Chain Store Sales YoY (Feb)

Survey 0.6%
Actual 1.9%
Prior 0.5%
Revised n/a

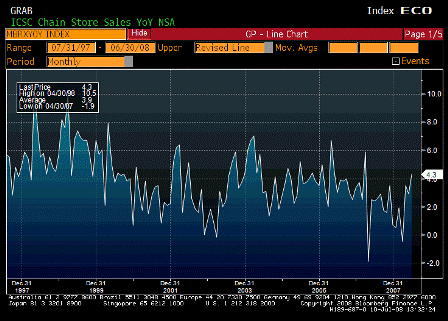
Shows how domestic demand has been moderating over time, but not collapsing to recession levels.

2008-02-07 US Economic Releases

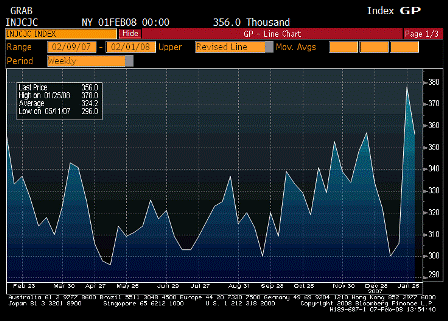
2008-02-07 Initial Jobless Claims

Initial Jobless Claims (Feb 2)

Survey 342K
Actual 356K
Prior 375K
Revised 378K

Moving down, but will need to fall more next week to signal employment is doing reasonably well.


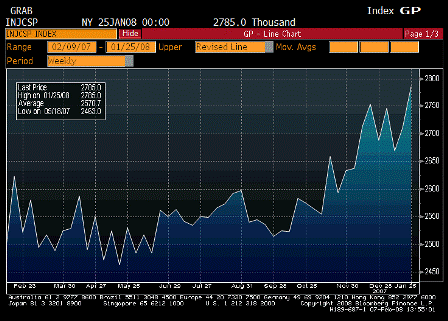
2008-02-07 Continuing Claims

Continuing Claims (Jan 26)

Survey 2715K
Actual 2785K
Prior 2716K
Revised -2710K

Back up a bit, but not through the highs, and reflects lasts weeks higher claims.


2008-02-07 Total Pending Home Sales SA

Total Pending Home Sales SA (Dec)

Survey -1.0%
Actual -1.5%
Prior -2.6%
Revised -3.0%

Down some, but not through the lows. October/November may still have been the bottom of housing.


2008-02-07 ICSC Chain Store Sales YoY

ICSC Chain Store Sales YoY (Jan)

Survey 0.8%
Actual 0.5%
Prior 0.9%
Revised n/a

Been drifting lower for quite a while. Part of the expected softening of domestic demand since Q2 2006.


2008-02-07 Consumer Credit

Consumer Credit (Dec)

Survey $7.4B
Actual $4.5B
Prior $15.4B
Revised $17.1B

♥

2008-01-10 US Economic Releases

2008-01-10 Initial Jobless Claims

Initial Jobless Claims (Jan 5)

Survey 340K
Actual 322K
Prior 336K
Revised 337K

2008-01-10 Continuing Claims

Continuing Claims (Dec 29)

Survey 2730K
Actual 2702K
Prior 2761K
Revised 2754K

Looks like employment for December was pretty good.


2008-01-10 Wholesale Inventories

Wholesale Inventories (Nov)

Survey 0.4%
Actual 0.6%
Prior 0.0%
Revised

November sales look good, and October revised up.

Inventory/sales ratio hits new low:

U.S. Nov wholesale inventories up 0.6 pct

by Lisa Lambert

(Reuters) Inventories at U.S. wholesalers rose 0.6 percent in November, but they did not keep pace with sales, which saw the biggest monthly increase in more than two years on rising petroleum prices, the government reported Thursday.

The Commerce Department said sales rose by 2.2 percent in November, the biggest monthly gain since September 2005. That reflected an 8.9 percent boost in petroleum sales, which a Commerce Department official said reflected higher prices. It was also
the biggest rise since September 2005, when a devastating hurricane season drove up the price of oil.

Analysts polled by Reuters expected a 0.4 percent gain in inventories, after a flat reading in October, which was unrevised. The department had a big revision in sales during October, reporting a 1.4 percent rise instead of the prior estimate of 0.7 percent.

In a sign businesses are not building up stockpiles as the economy slows, the inventory-to-sales ratio — a measure of the number months it would take to deplete existing stocks at the current sales pace — fell to a record low of 1.07 months from October’s downwardly revised 1.08 months.


2008-01-10 ICSC Chain Store Sales YoY

ICSC Chain Store Sales YoY (Dec)

Survey n/a
Actual 0.9%
Prior 3.5%
Revised n/a

Certainly moderating, but not all that bad.