2008-05-29 US Economic Releases


[Skip to the end]


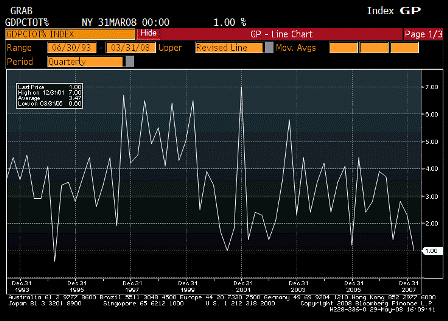
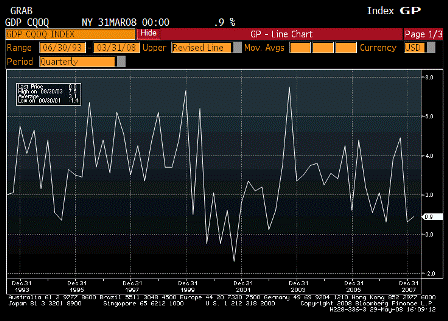
2008-05-29 GDP

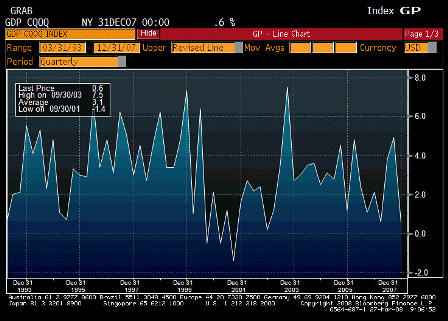
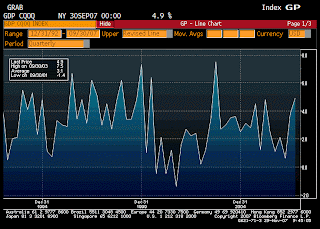
GDP QoQ Annualized (1Q P)

Survey 0.9%
Actual 0.9%
Prior 1.5%
Revised 1.7%

Staying clear of recession levels.
Looking like Q4 was the bottom of this move.

[top][end]


2008-05-29 Personal Consumption

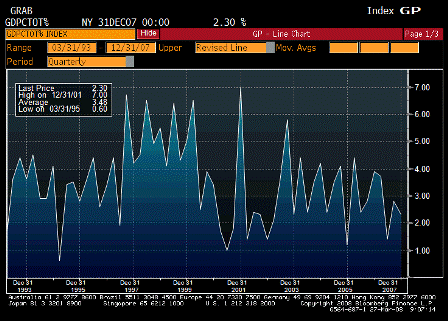
Personal Consumption (1Q P)

Survey 1.0%
Actual 1.0%
Prior 1.0%
Revised n/a

As expected, not collapsing as feared, yet.

[top][end]


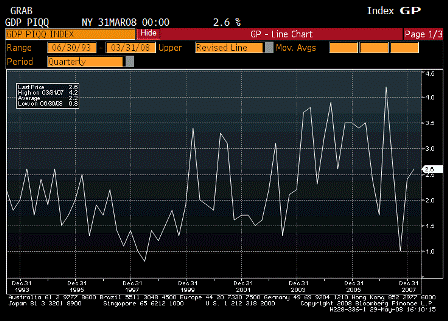
2008-05-29 GDP Price Index

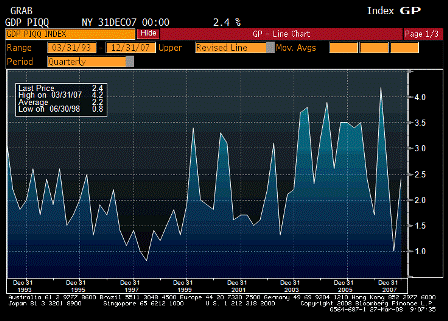
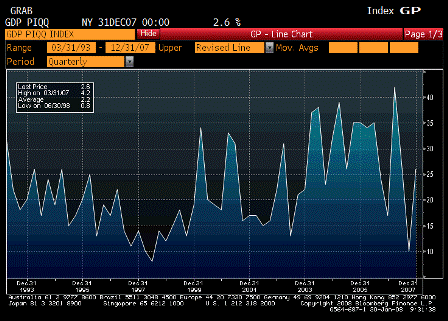
GDP Price Index (1Q P)

Survey 2.6%
Actual 2.6%
Prior 2.6%
Revised n/a

Not good, and pipeline pressures continuing to build.

[top][end]


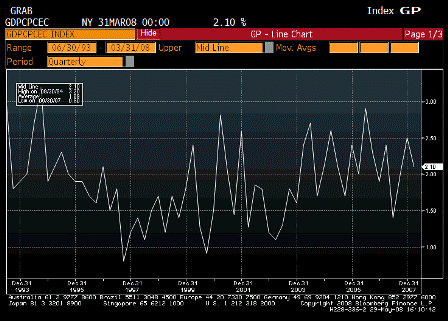
2008-05-29 Core PCE QoQ

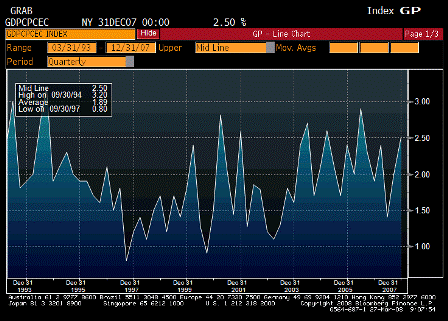
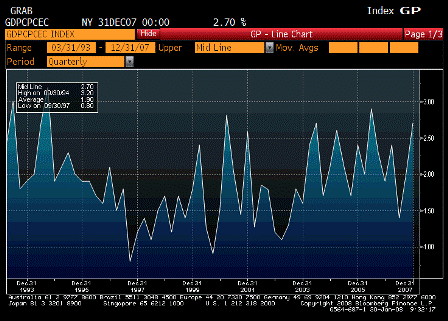
Core PCE QoQ (1Q P)

Survey 2.2%
Actual 2.1%
Prior 2.2%
Revised n/a

A little better than expected.

But trend looking up.
[top][end]


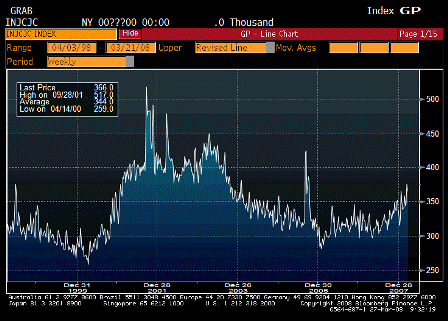
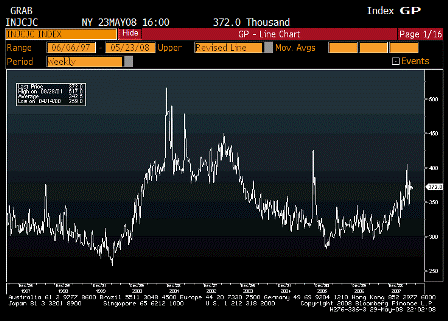
2008-05-29 Initial Jobless Claims

Initial Jobless Claims (May 24)

Survey 370K
Actual 372K
Prior 365K
Revised 368K

Seems to be leveling off.

Fiscal package should help.
[top][end]


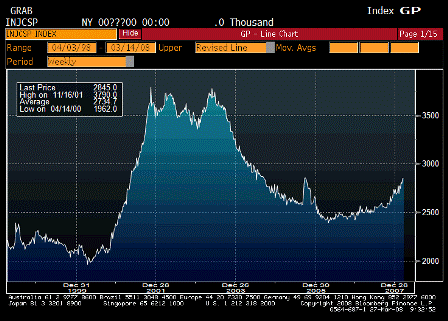
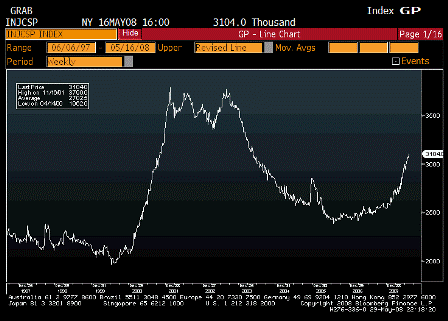
2008-05-29 Continuing Jobless Claims

Continuing Claims (May 17)

Survey 3060K
Actual 3104K
Prior 3073K
Revised 3068K

Lagging indicator, still trending higher, but still far below recession levels.

[top][end]


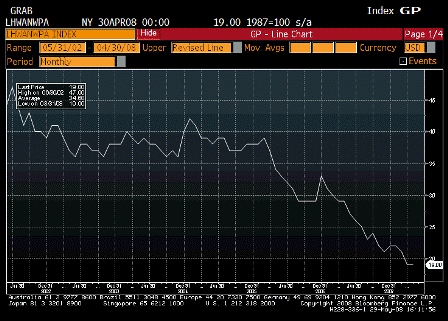
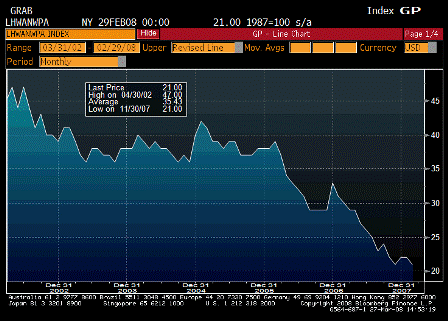
2008-05-29 Help Wanted Index

Help Wanted Index (Apr)

Survey 19
Actual 19
Prior 19
Revised n/a

Indicator of soft jobs markets.


[top]
2008-03-27 US Economic Releases

2008-03-27 GDP Annualized

GDP Annualized (4Q F)

Survey 0.6%
Actual 0.6%
Prior 0.6%
Revised n/a

2008-03-27 Personal Consumption

Personal Consumption (4Q F)

Survey 1.9%
Actual 2.3%
Prior 1.9%
Revised n/a

Revised up to a very respectable number. And income remains positive, and employment is at high levels.


2008-03-27 GDP Price Index

GDP Price Index (4Q F)

Survey 2.7%
Actual 2.4%
Prior 2.7%
Revised n/a

A bit better than previously reported, but prices have subsequently gone much higher.


2008-03-27 Core PCE QoQ

Core PCE QoQ (4Q F)

Survey 2.7%
Actual 2.5%
Prior 2.7%
Revised n/a

The Fed is more concerned about this and the evidence food and energy is getting passed through from headline to core measures.


2008-03-27 Initial Jobless Claims since 1998

Initial Jobless Claims (Mar 22)

Survey 370K
Actual 366K
Prior 378K
Revised 375K

2008-03-27 Continuing Claims since 1998

Continuing Claims (Mar 15)

Survey 2885K
Actual 2845K
Prior 2865K
Revised 2850K

Best guess:

The jobless recovery that morphed into the full employment recession now appears to be over with today’s jobless claims numbers leaning in the same direction as other data released earlier this week.

That does not mean the issues with the financial sector are all behind us – far from it.

It does mean the real economy has figured out how to move on with what’s left of the financial sector.


2008-03-27 Help Wanted Index

Help Wanted Index (Feb)

Survey 20
Actual 21
Prior 21
Revised 22

[comments]
Claims, ECI

From Karim:

  • True to the past 5yrs pattern, claims seem to be reverting to trend after the first few weeks of January.

Right, good call!

  • IJC climbed from 306k to 375k; the trend before the January drop was around 340-350k; this number was for MLK holiday week, so an adjustment issue here as well; bottom line is I think trend is still around 350k.
  • Continuing claims rose from 2685k to 2716k.
  • ECI (both headline and wage component) up 0.8% q/q

Data below is for Dec, so was largely known in yday’s GDP number.

  • Personal income up 0.5%, with wage and salary component up 0.4%
  • Core PCE up 0.2% m/m (2.2% y/y)

Most meaningful data here was continuing claims (little to no hiring taking place) and ECI (wage gwth still tame).

And Fed still looking at this as an indication of ‘inflation expectations’.


♥

2008-01-30 US Economic Releases

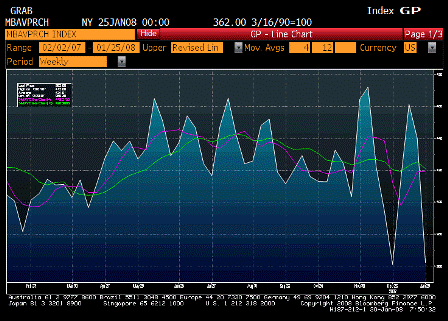
2008-01-30 MBAVPRCH + 4 Wk Ave + 12 Wk Ave

MBAVPRCH Index + 4 Wk Ave + 12 Wk Ave

From Karim:
very volatile series-see chart-white line is purchase index-purple line is 4wk avg and green line is 12wk avg-latter is probably best indicator of trend and looks like still heading lower. Of course this series also reflects multiple applications for same home purchase, which is more likely over the past few months in light of tighter standards for many borrowers, so probably have to adjust for that compared to same series a year ago.


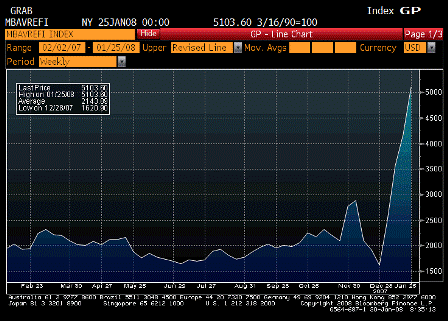
2008-01-30 MBAVREFI

MBA Refinancing Index (Jane 25)

Survey n/a
Actual 5103.6
Prior 4178.2
Revised n/a

Refi index positive for ‘market functioning’, but purchase index could be softening.

As before, winter housing numbers are volatile.


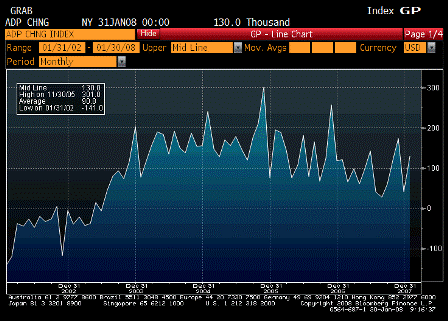
2008-01-30 ADP Employment Change

ADP Employment Change (Jan)

Survey 40K
Actual 130K
Prior 40K
Revised 37K

Not the stuff of recession. While not a reliable predictor of Friday’s payroll report, it is a ‘real’ number as it’s ADP’s report of 392,000 business it services.


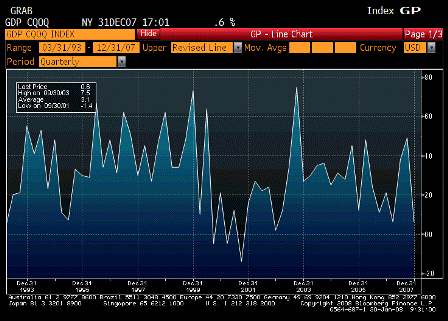
2008-01-30 GDP Annualized

GDP Annualized (4Q A)

Survey 1.2%
Actual 0.6%
Prior 4.9%
Revised n/a

Lower than expected but still positive, consumer up 2% which is far from recession, and final sales for domestic purchases were up 1.4%, and the Dec export number won’t be reported until Feb 14. The durable goods number yesterday may portend a higher than estimated export number for the next Q4 GDP revised report. Inventories were burned off by 1.25% of GDP, which is also generally not indicative of recession.


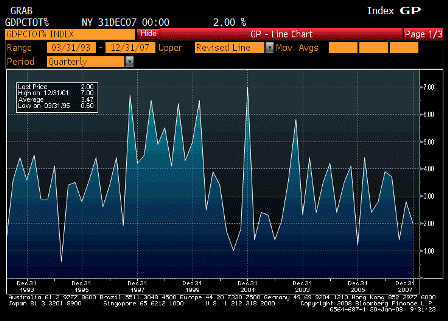
2008-01-30 Personal Consumption

Personal Consumption (4Q A)

Survey 2.6%
Actual 2.0%
Prior 2.8%
Revised n/a

Down but not terrible, and not the stuff of recession


2008-01-30 GDP Price Index

GDP Price Index (4Q A)

Survey 2.6%
Actual 2.6%
Prior 1.0%
Revised n/a

Not good.


2008-01-30 Core PCE QoQ

Core PCE QoQ (4Q A)

Survey 2.5%
Actual 2.7%
Prior 2.0%
Revised n/a

Very troubling to the Fed. Mainstream theory says you can’t let core elevate. The cost to bring it down is much higher than any possible losses due to near term weakness caused by keeping rates high.


2008-01-30 FOMC Rate Decision

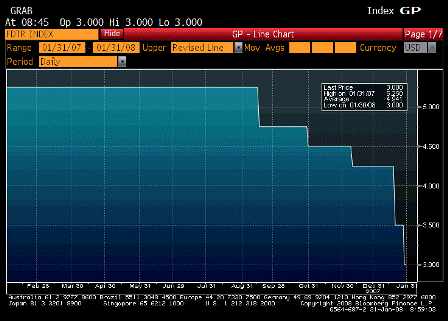
FOMC Rate Decision (Jan 30)

Survey 3.0%
Actual 3.0%
Prior 3.5%
Revised n/a

♥

2007-12-20 US Economic Releases

small 2007-12-20 GPD Annualized

GDP Annualized (3QF)

Survey 4.9%
Actual 4.9%
Prior 4.9%
Revised n/a

small 2007-12-20 Personal Consumption

Personal Consumption (3QF)

Survey 42.8.9%
Actual 2.8%
Prior 2.7%
Revised n/a

2007-12-20 GDP Price Index

GDP Price Index (3QF)

Survey 0.9%
Actual 1.0%
Prior 0.9%
Revised n/a

Above numbers as expected.


small 2007-12-20 Core PCE QoQ

Core PCE QoQ (3QF)

Survey 1.8%
Actual 2.0%
Prior 1.8%
Revised n/a

This is now at the upper bound of the fed’s comfort zone.


2007-12-20 Initial Jobless Claims

Initial Jobless Claims (Dec 15)

Survey 335K
Actual 346K
Prior 333K
Revised 334K

Creeping up.

Fed gets concerned if it gets over 375K.


2007-12-20 Continuing Claims

Continuing Claims (Dec 8)

Survey 2610K
Actual 264K
Prior 2639K
Revised 2634K

Creeping up as well, but not yet a major concern.


2007-12-20 Leading Indicators

Leading Indicators (Nov)

Survey -0.3%
Actual -0.5%
Prior -0.5%
Revised n/a

Pretty much in line with expectations.


2007-12-20 Philadelphia Fed.

Philadelphia Fed. (Dec)

Survey 6.0%
Actual -5.7%
Prior 8.2%
Revised n/a

♥

2007-11-29 US Economic Releases

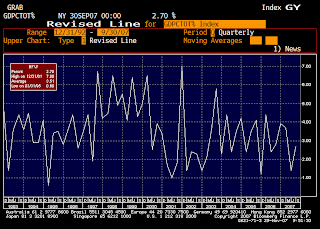
GCP Annualized (3QP)

Survey 4.8%
Actual 4.9%
Prior 3.9%
Revised n/a

Keeps coming in above expectations.


Personal Consumption (3QP)

Survey 2.9%
Actual 2.7%
Prior 3.0%
Revised n/a

A touch higher bust still seems very low.


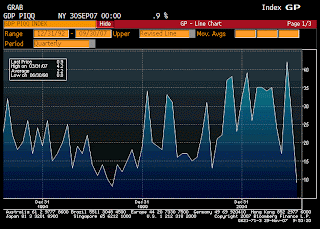
GDP Price Index (3QP)

Survey 0.8%
Actual 0.9%
Prior 0.8%
Revised n/a

A touch higher bust still seems very low.


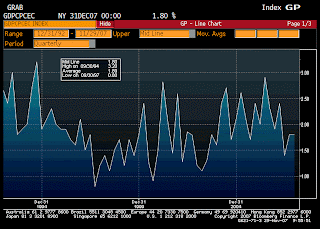
Core PCE QoQ (3QP)

Survey 1.8%
Actual 1.8%
Prior 1.8%
Revised n/a

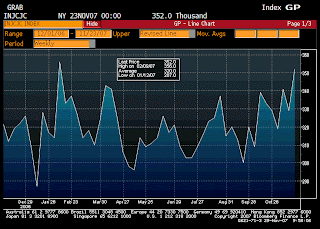
Initial Jobless Claims (Nov 24)

Survey 330K
Actual 352K
Prior 330K
Revised 329K

Thanksgiving week. Next week’s number is more informative.


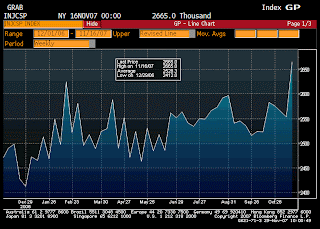
Continuing Claims (Nov 17)

Survey 2575K
Actual 2665K
Prior 2566K
Revised 2553K

Thanksgiving week. Next week’s number is more informative.


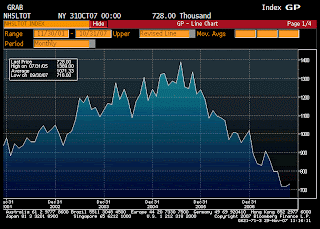
New Home Sales (Oct)

Survey 750K
Actual 728K
Prior 770K
Revised 716K

Up a touch from revised lower number, but still very low.


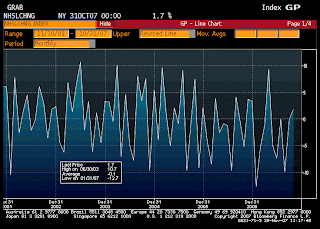
New Home Sales MoM (Oct)

Survey -2.6%
Actual 1.7%
Prior 4.8%
Revised -0.1%

Up a touch from revised lower number, but still very low.


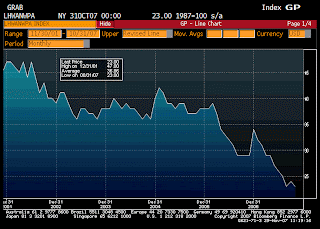
Help Wanted Index (Oct)

Survey 23
Actual 23
Prior 24
Revised n/a

Thanksgiving week. Next week’s number is more informative.


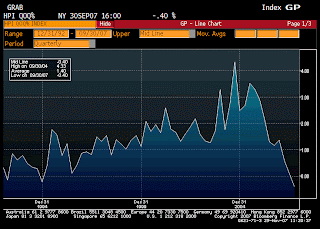
House Price Index QoQ (3Q)

Survey -0.5%
Actual -0.4%
Prior 0.1%
Revised n/a

Moving lower.
Do you think any of this is below fed expectations as of October 31st?


♥