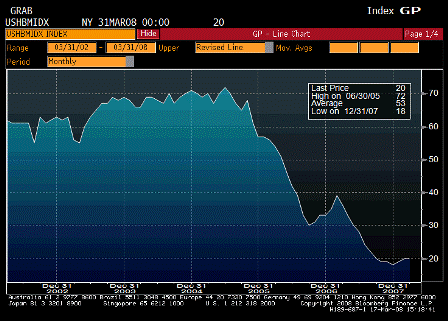
NAHB Housing Market Index (Mar)
| Survey | 20 |
| Actual | 20 |
| Prior | 20 |
| Revised | n/a |
Still looking like housing may have bottomed October/November, as previously discussed.
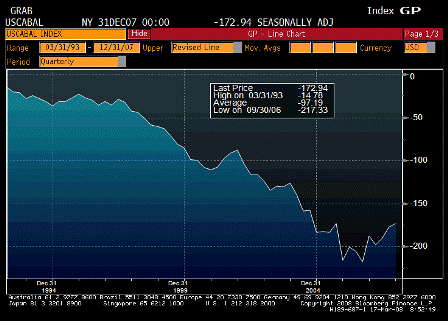
Current Account Balance (4Q)
| Survey | -$183.8B |
| Actual | -$172.9B |
| Prior | -$178.5B |
| Revised | -$177.4B |
The dollar flight picks up steam.
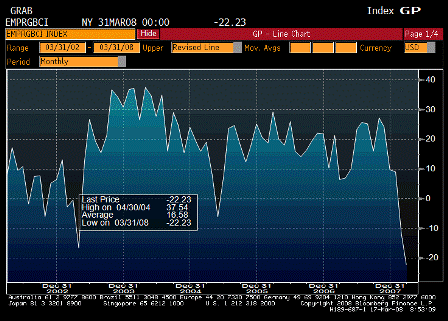
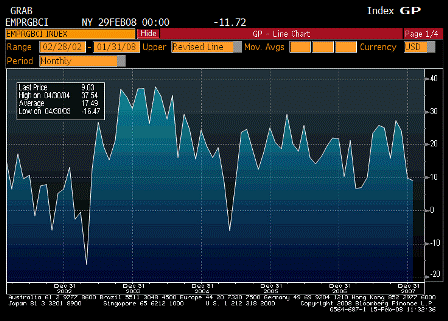
Empire Manufacturing (Mar)
| Survey | -7.4 |
| Actual | -22.2 |
| Prior | -11.7 |
| Revised | n/a |
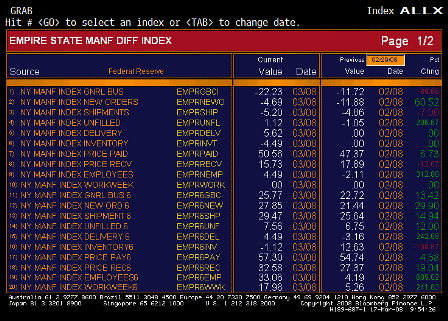
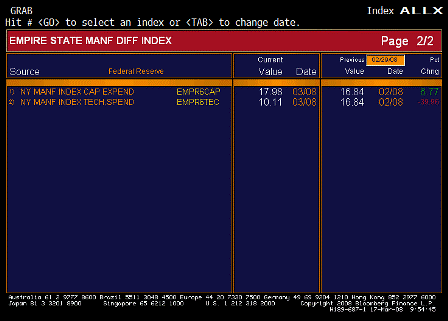
Empire Manufacturing TABLE
The chart looks far worse than the table, which actually looks somewhat constructive.
And prices up (surprise!).
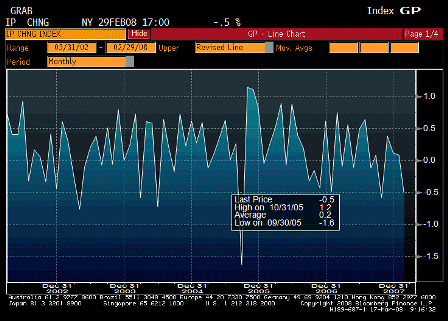
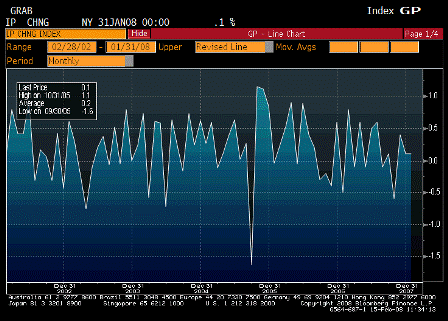
Industrial Production (Feb)
| Survey | -0.1% |
| Actual | -0.5% |
| Prior | 0.1% |
| Revised | 0.1% |
Q1 looking weak as advertised.
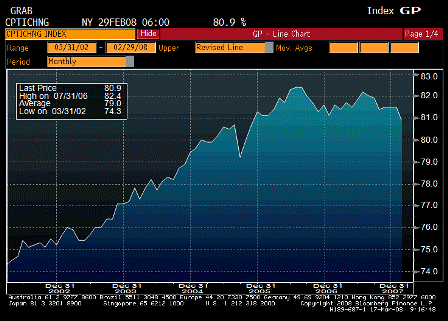
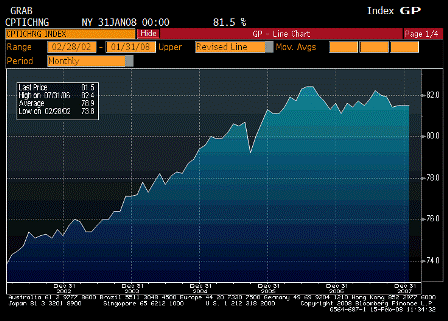
Capacity Utilization (Feb)
| Survey | 81.2% |
| Actual | 80.9% |
| Prior | 81.5% |
| Revised | n/a |
Some slack forming but not much.

