2008-09-02 USER


[Skip to the end]


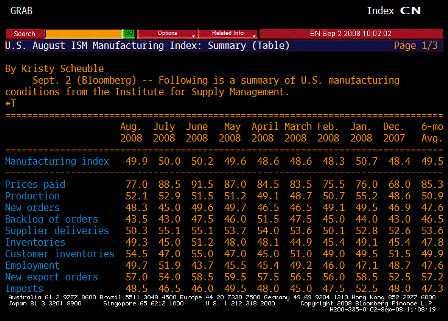
ISM Manufacturing (Aug)

Survey 50.0
Actual 49.9
Prior 50.0
Revised n/a

Not bad; far from recession levels in a sector that will continue to decline as a percentage of GDP indefinately.

[top][end]

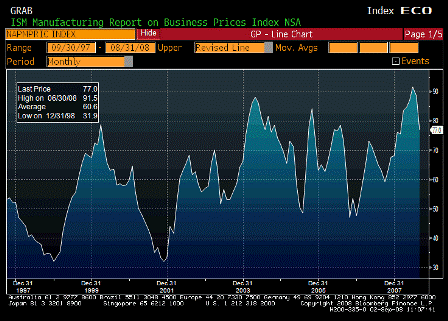
ISM Prices Paid (Aug)

Survey 82.0
Actual 77.0
Prior 88.5
Revised n/a

Less than expected, but still very high. Indication that most companies still paying higher prices even as commodities declined.

[top][end]

ISM TABLE (Aug)

[top][end]


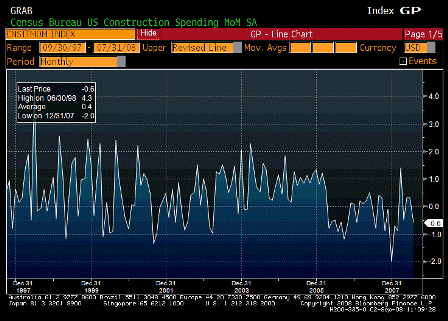
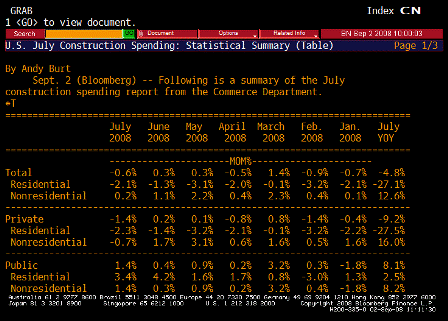
Construction Spending MoM (Jul)

Survey -0.4%
Actual -0.6%
Prior -0.4%
Revised 0.3%

[top][end]

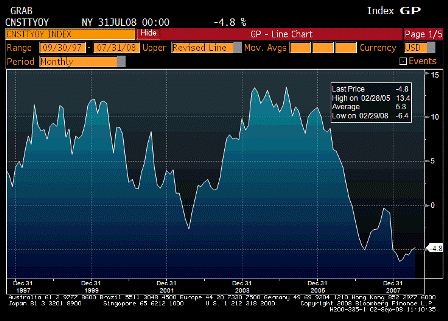
Construction Spending YoY (Jul)

Survey n/a
Actual -4.8%
Prior -5.1%
Revised n/a

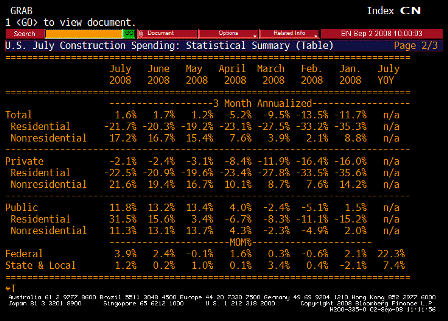
Still very weak, but smaller declines.

[top][end]

Construction Spending TABLE 1 (Jul)

[top][end]

Construction Spending TABLE 2 (Jul)

[top][end]

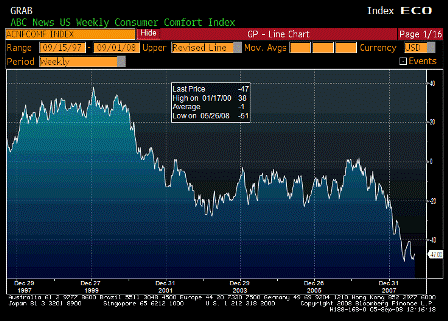
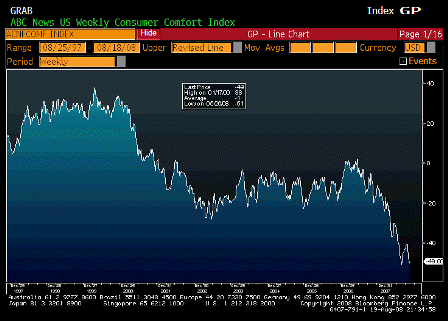
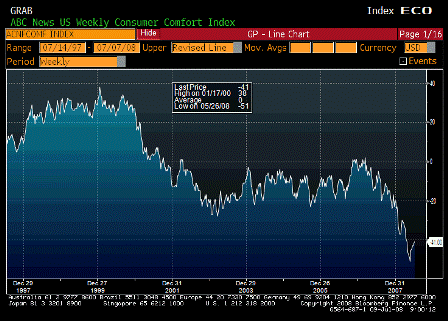
ABC Consumer Confidence (Aug 31)

Survey -49
Actual -47
Prior -50
Revised n/a


[top]

2008-08-26 US Economic Releases


[Skip to the end]


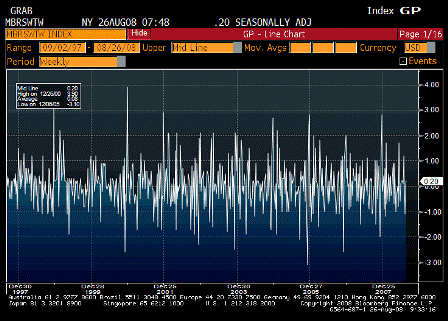
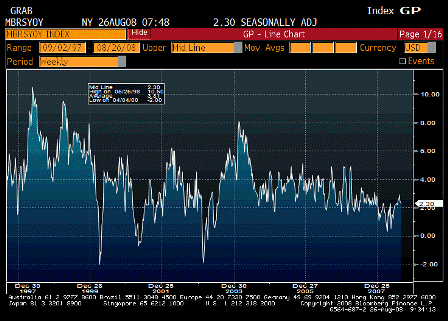
ICSC-UBS Store Sales WoW (Aug 26)

Survey n/a
Actual 0.2%
Prior 0.1%
Revised n/a

[top][end]

ICSC-UBS Store Sales YoY (Aug 26)

Survey n/a
Actual 2.3%
Prior 2.4%
Revised n/a

[top][end]

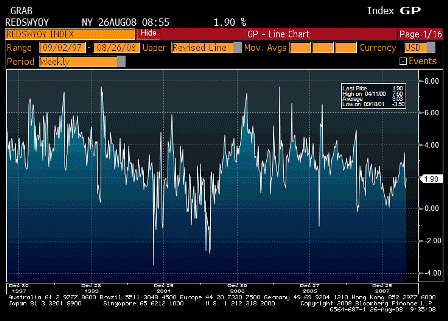
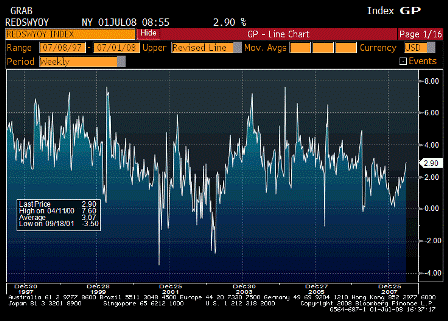
Redbook Store Sales Weekly YoY (Aug 26)

Survey n/a
Actual 1.9%
Prior 1.3%
Revised n/a

[top][end]

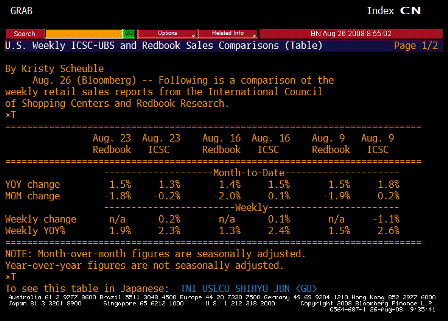
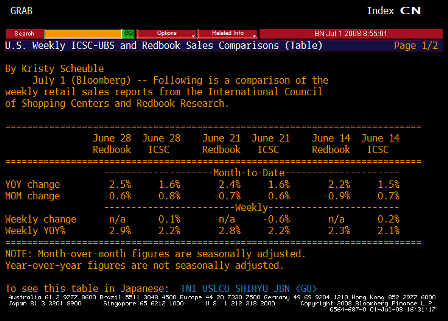
ICSC-UBS Redbook Comparison TABLE (Aug 26)

[top][end]


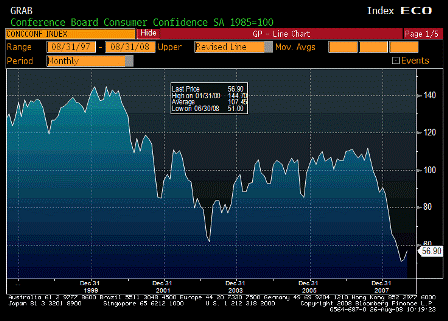
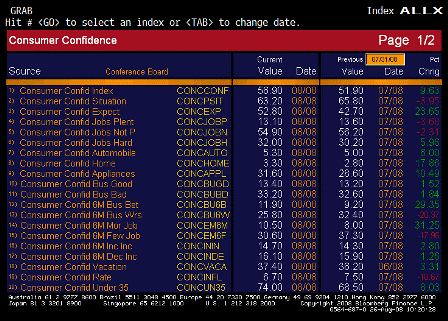
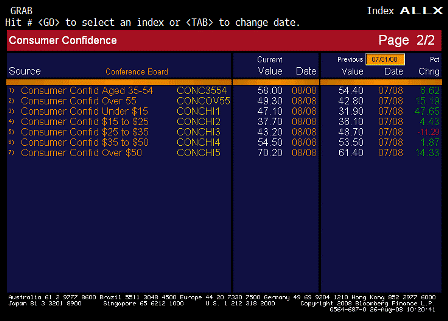
Consumer Confidence (Aug)

Survey 53.0
Actual 56.9
Prior 51.9
Revised n/a

[top][end]

Consumer Confidence ALLX 1 (Aug)

[top][end]

Consumer Confidence ALLX 2 (Aug)

[top][end]


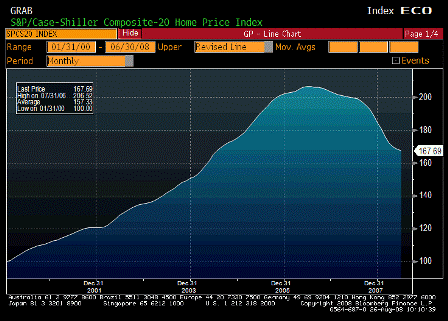
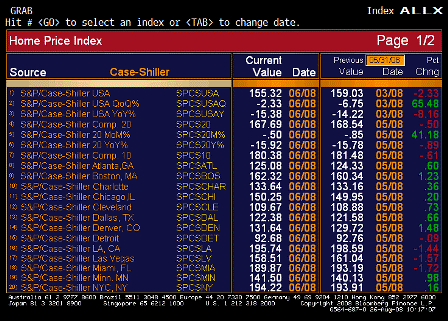
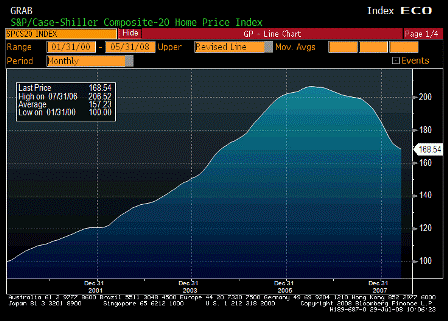
S&P-CaseShiller Home Price Index (Jun)

Survey 167.20
Actual 167.69
Prior 168.54
Revised n/a

[top][end]

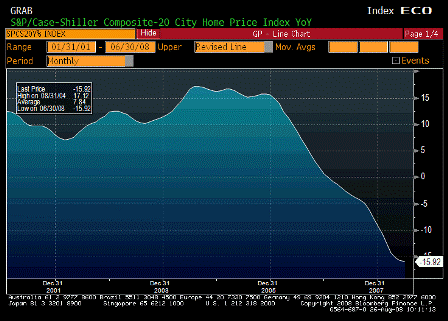
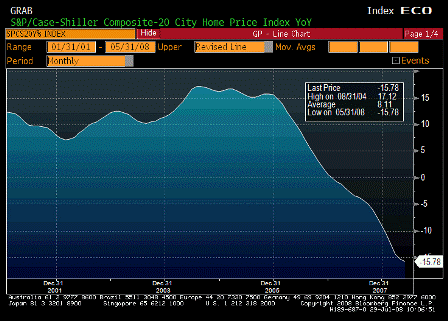
S&P-CS Composite-20 YoY (Jun)

Survey -16.20%
Actual -15.92%
Prior -15.78%
Revised -15.78%

[top][end]

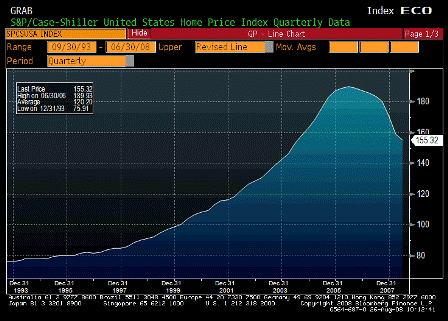
S&P-CaseShiller US HPI (2Q)

Survey n/a
Actual 155.32
Prior 159.20
Revised 159.03

[top][end]

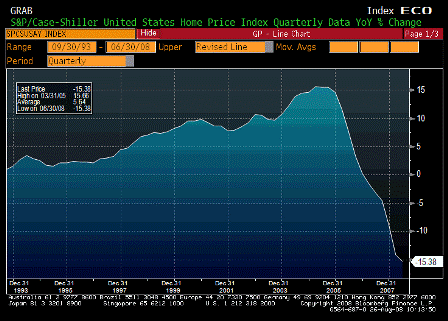
S&P-CaseShiller US HPI YoY (2Q)

Survey -16.2%
Actual -15.4%
Prior -14.1%
Revised -14.2%

[top][end]

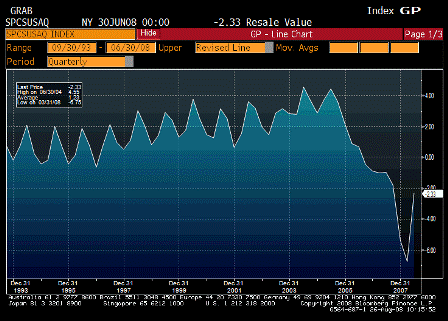
S&P-CaseShiller US HPI QoQ (2Q)

Survey n/a
Actual -2.33%
Prior -6.75%
Revised n/a

[top][end]

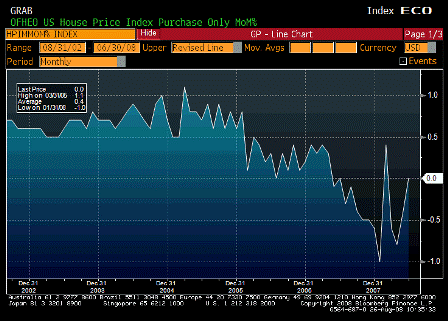
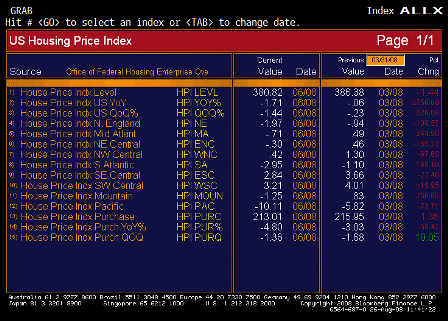
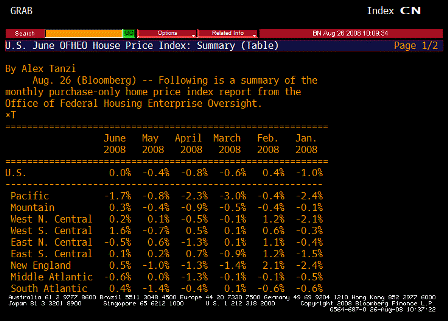
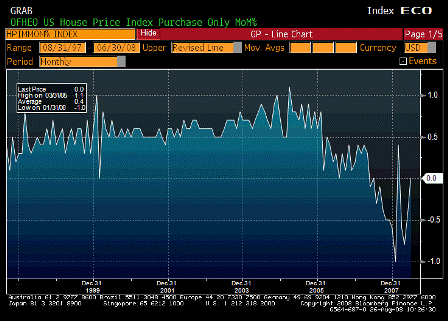
House Price Index MoM (Jun)

Survey -0.4%
Actual 0.0%
Prior -0.3%
Revised -0.4%

[top][end]

House Price Index YoY (Jun)

Survey n/a
Actual -4.8%
Prior -4.8%
Revised n/a

[top][end]

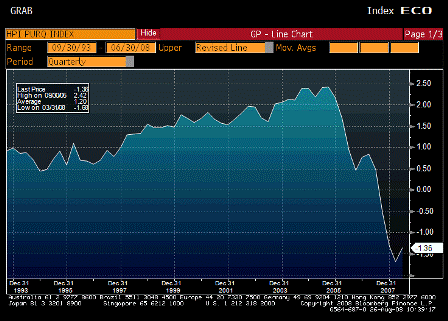
House Price Purchase Index QoQ (2Q)

Survey -1.5%
Actual -1.4%
Prior -1.7%
Revised -1.7%

[top][end]

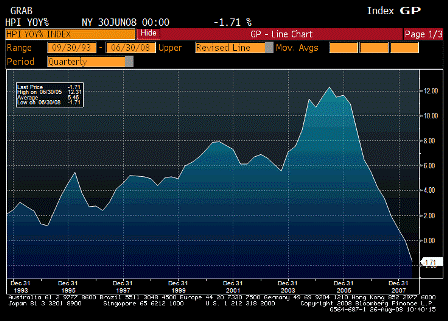
House Price Purchase Index YoY (Jun)

Survey n/a
Actual -1.71%
Prior -0.06%
Revised n/a

[top][end]

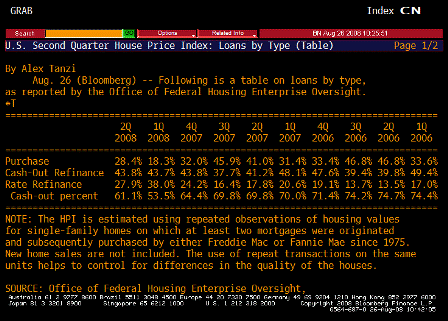
House Price Purchase Index Loans by Type TABLE (2Q)

[top][end]

House Price Purchase Index ALLX (2Q)

[top][end]

House Price Index TABLE (Jun)

[top][end]

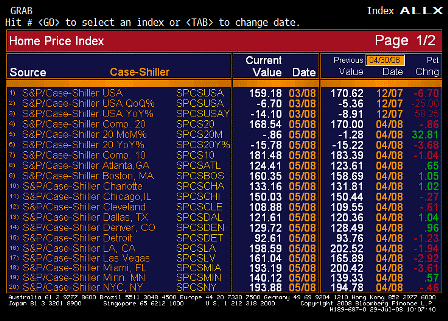
HPI ALLX 1 (Jun)

[top][end]

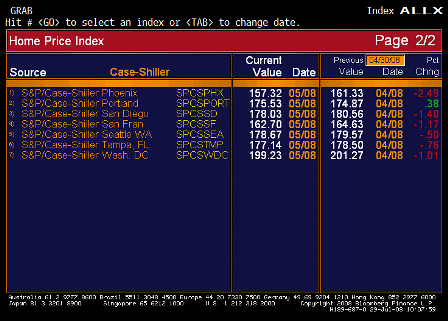
HPI ALLX 2 (Jun)

[top][end]


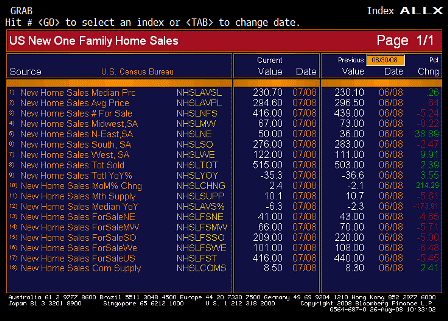
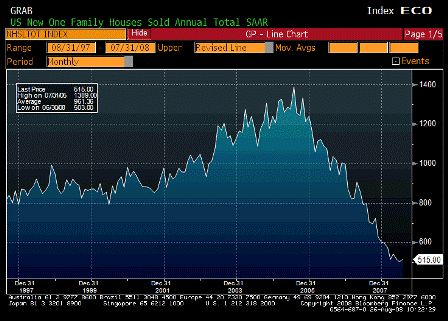
New Home Sales (Jul)

Survey 525K
Actual 515K
Prior 530K
Revised 503K

[top][end]

New Home Sales MoM (Jul)

Survey -0.9%
Actual 2.4%
Prior -0.6%
Revised -2.1%

[top][end]

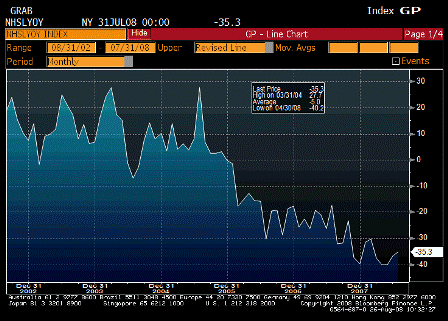
New Home Sales Total YoY (Jul)

Survey n/a
Actual -35.3%
Prior -36.6%
Revised n/a

[top][end]

New Home Sales ALLX (Jul)

[top][end]


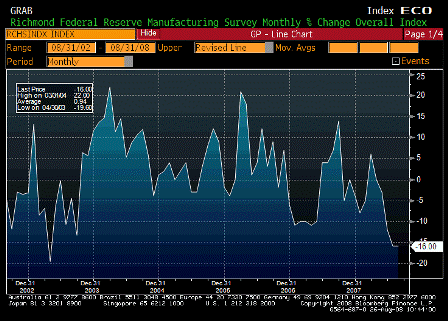
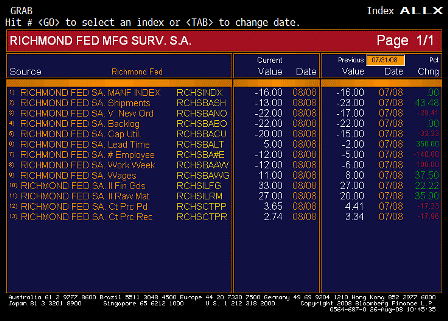
Richmond Fed Manufacturing Index (Aug)

Survey -10
Actual -16
Prior -16
Revised n/a

[top][end]

Richmond Fed Manufacturing Index ALLX (Aug)

[top][end]


ABC Consumer Confidence (Aug 24)

Survey
Actual
Prior -49
Revised

[top][end]

ABC Consumer Confidence ALLX (Aug 24)


[top]

2008-08-19 US Economic Releases


[Skip to the end]


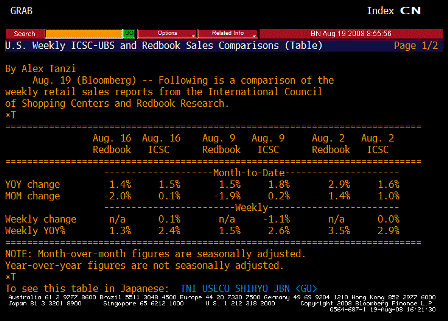
ICSC-UBS Store Sales WoW (Aug 19)

Survey n/a
Actual 0.1%
Prior 1.1%
Revised n/a

[top][end]

ICSC-UBS Store Sales YoY (Aug 19)

Survey n/a
Actual 2.4%
Prior 2.6%
Revised n/a

Doing just fine, especially considering the financial sector is gone.

[top][end]

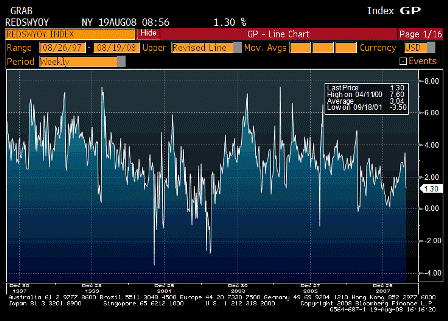
Redbook Store Sales Weekly YoY (Aug 19)

Survey n/a
Actual 1.3%
Prior 1.5%
Revised n/a

[top][end]

ICSC-UBS Redbook Comparison TABLE (Aug 19)

[top][end]


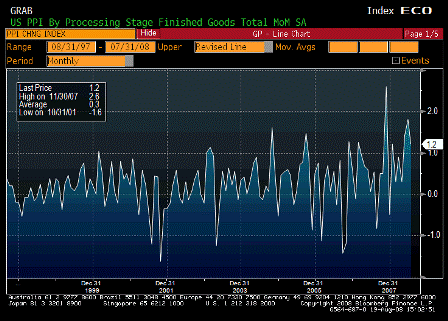
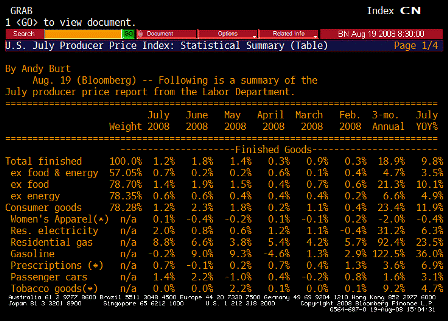
Producer Price Index MoM (Jul)

Survey 0.6%
Actual 1.2%
Prior 1.8%
Revised n/a

Up more than expected.

[top][end]

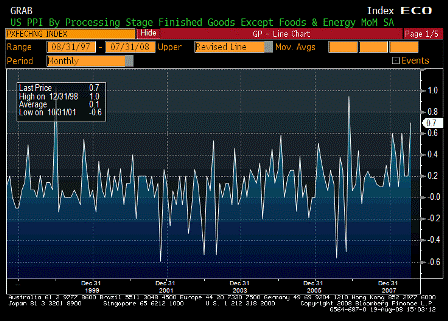
PPI Ex Food & Energy MoM (Jul)

Survey 0.2%
Actual 0.7%
Prior 0.2%
Revised n/a

Core nudging up a touch…

[top][end]

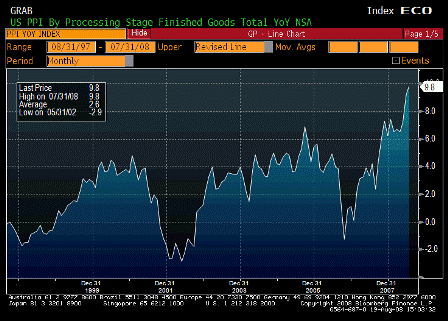
Producer Price Index YoY (Jul)

Survey 9.3%
Actual 9.8%
Prior 9.2%
Revised n/a

Just a little blip up that’s starting to make the 1970s look tame.

[top][end]

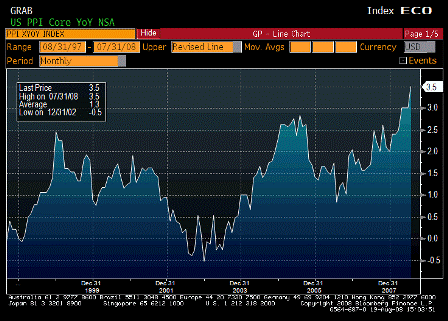
PPI Ex Food & Energy YoY (Jul)

Survey 3.2%
Actual 3.5%
Prior 3.0%
Revised n/a

Cute little break out here too.

[top][end]

PPI TABLE 1 (Jul)

[top][end]

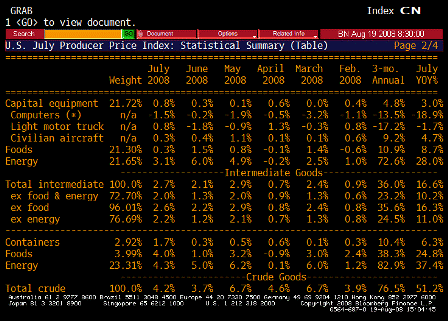
PPI TABLE 2 (Jul)

[top][end]

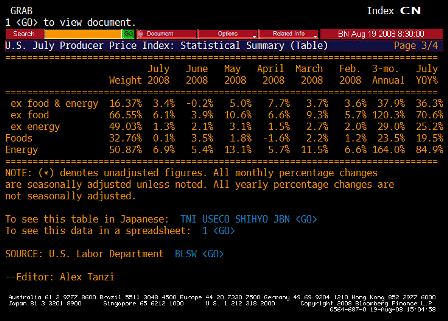
PPI TABLE 3 (Jul)

Karim writes:

  • PPI for July up 1.2% and 0.7% ex-food and energy
  • Core driven by cars and trucks the past 2mths (seems out of line w/cpi data) and medical

[top][end]

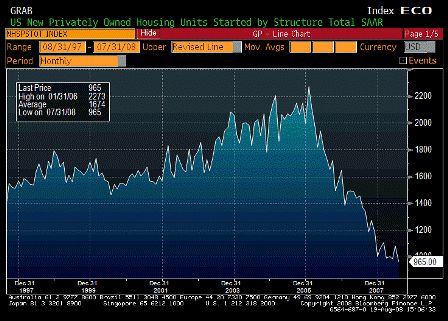
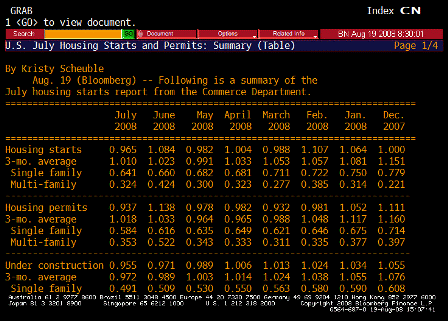
Housing Starts (Jul)

Survey 960K
Actual 965K
Prior 1066K
Revised 1084K

A bit higher than expected, and last month revised up.

Averaging out the last couple of months or so to smooth the NY situation indicates a leveling off and probably a bottom.

[top][end]

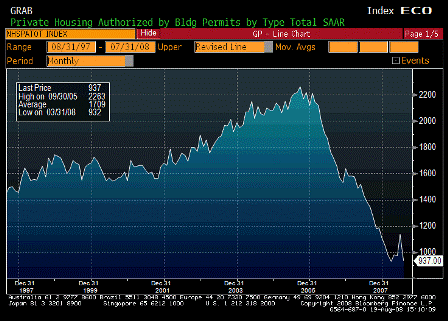
Building Permits (Jul)

Survey 970K
Actual 937K
Prior 1091K
Revised 1138K

Down, but last month revised up. Same as above.

[top][end]

Housing Starts TABLE 1 (Jul)

[top][end]

Housing Starts TABLE 2 (Jul)

[top][end]

Housing Starts TABLE 3 (Jul)

Karim writes:

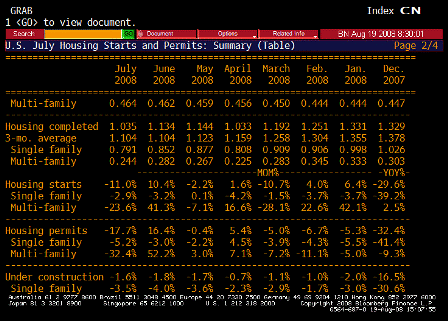
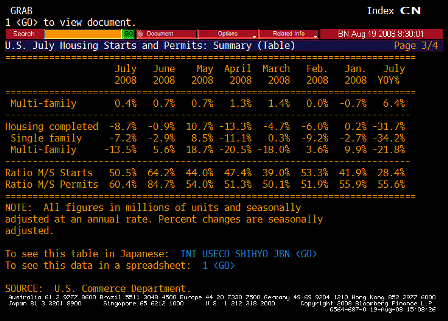
  • Starts fall 11% after upward revision to June (now up 10.4%)
  • Noise in data still surrounds multi-family due to change in NYC building code (multi-family dropped 23.6% after rising 41.3% in June)
  • Single family drops another 2.9% after 3.2% drop in June and now down 39.2% y/y
  • Same story with permits, down 17.7% m/m after 16.4% rise in June
  • Single family permits down 5.2% m/m after -3% in June and down 41.4% y/y
  • Multi-family down 32.4% m/m after up 52.2% m/m in June

[top][end]

ABC Consumer Confidence (Aug 17)

Survey -50
Actual -49
Prior -50
Revised n/a

very low, may be bottoming, confidence being hurt by inflation.


[top]

2008-08-12 US Economic Releases


[Skip to the end]


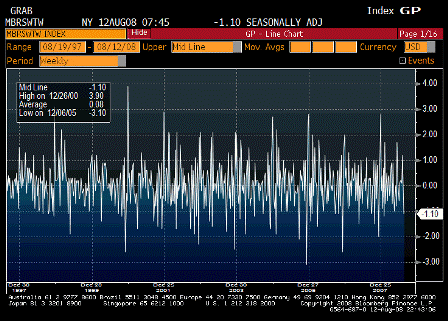
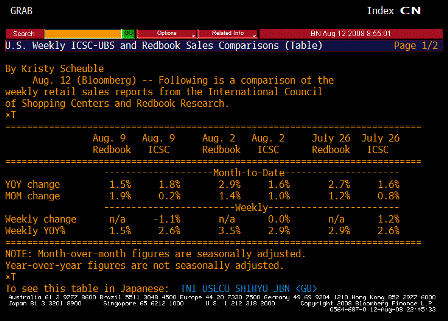
ICSC-UBS Store Sales WoW (Aug 12)

Survey n/a
Actual -1.1%
Prior 0.0%
Revised n/a

[top][end]

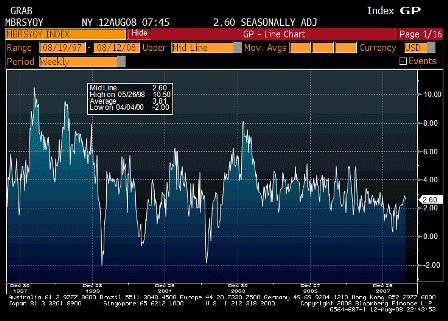
ICSC-UBS Store Sales YoY (Aug 12)

Survey n/a
Actual 2.6%
Prior 2.9%
Revised n/a

Year over year looking fine.

[top][end]

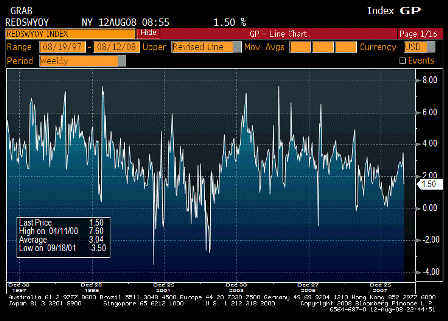
Redbook Store Sales Weekly YoY (Aug 12)

Survey n/a
Actual 1.5%
Prior 3.5%
Revised n/a

Softer but no collapse.

[top][end]

ICSC-UBS Redbook Comparisson TABLE (Aug 12)

[top][end]


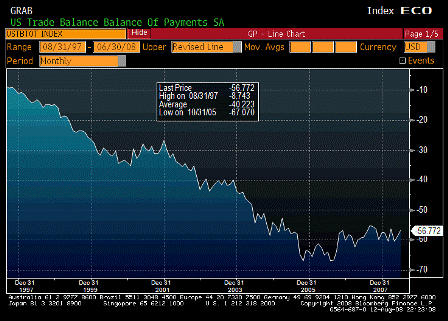
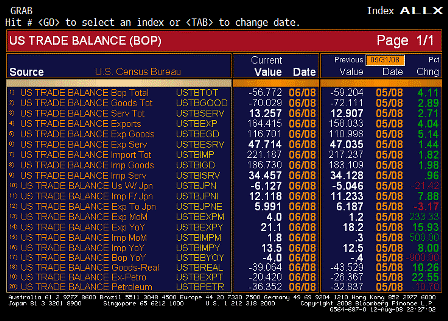
Trade Balance (Jun)

Survey -$62.0B
Actual -$56.8B
Prior -$59.8B
Revised -$59.2B

Lower than expected and moving lower even with crude prices up in June.

I still think last months number was too high which is part of the reason for the June drop.

[top][end]

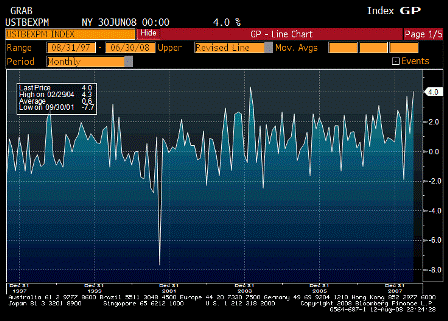
Exports MoM (Jun)

Survey n/a
Actual 4.0%
Prior 1.2%
Revised n/a

Government and exports continue to support GDP.

Q2 now looking to be revised to maybe north of 3%.

[top][end]

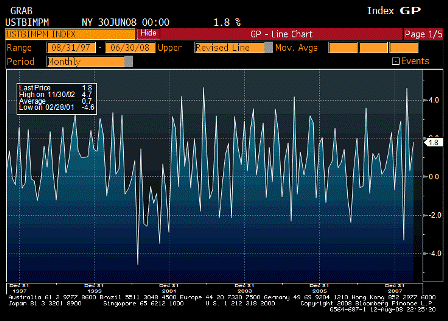
Imports MoM (Jun)

Survey n/a
Actual 1.8%
Prior 0.3%
Revised n/a

Up due to crude and gasoline prices.

[top][end]

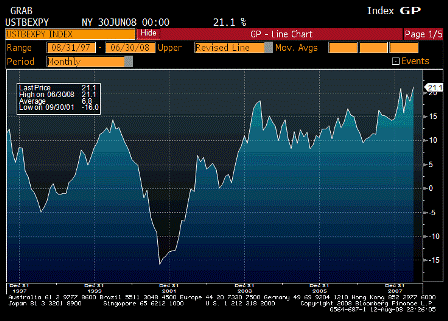
Exports YoY (Jun)

Survey n/a
Actual 21.1%
Prior 18.2%
Revised n/a

Looking more like an export economy every day. Weak domestic consumption and ok employment.

Workers earn enough to drive to work and eat, and the rest of their output gets exported to someone else.

[top][end]

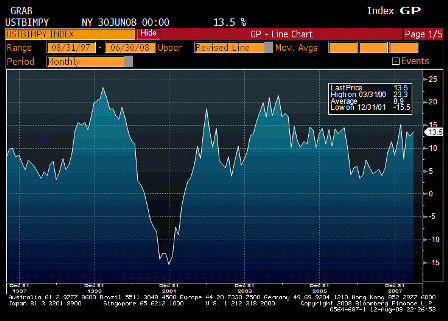
Imports YoY (Jun)

Survey n/a
Actual 13.5%
Prior 12.5%
Revised n/a

Mostly petro and product prices.

Other imports are down.

[top][end]

Trade Balance ALLX (Jun)

Ex petro down to about 20 billion.

[top][end]


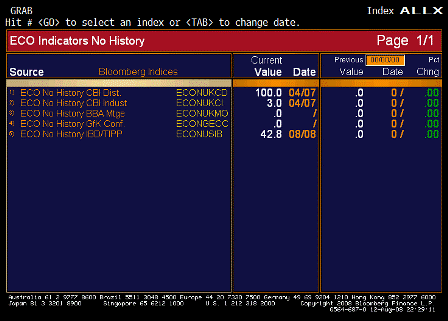
IBD-TIPP Economic Optimism (Aug)

Survey 39.0
Actual 42.8
Prior 37.4
Revised n/a

Up some, but less than expected.

[top][end]


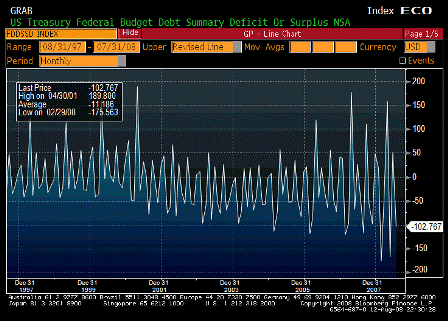
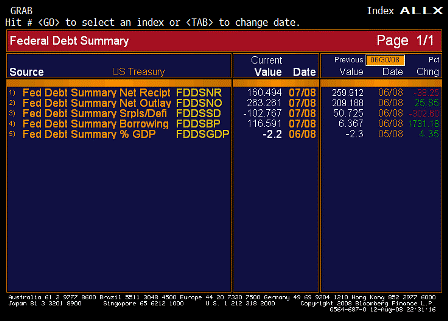
Monthly Budget Statement (Jul)

Survey -$95.0B
Actual -$102.8B
Prior -$36.4B
Revised n/a

Government spending and exports supporting GDP more than most anticipate.

[top][end]

Monthly Budget Statement ALLX (Jul)

[top][end]


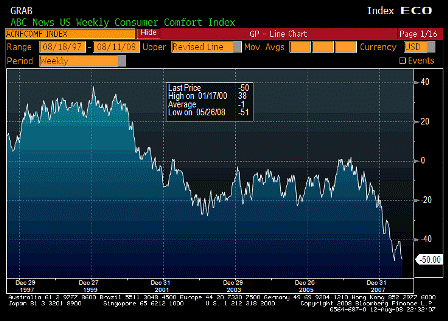
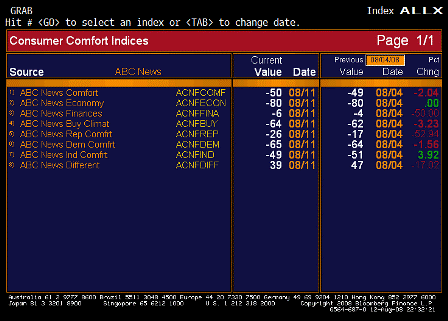
ABC Consumer Confidence (Aug 10)

Survey n/a
Actual -50
Prior -49
Revised n/a

Bumping along the bottom.

Inflation hurting confidence as wages remain ‘well contained’.

[top][end]

ABC Consumer Confidence ALLX (Aug 10)


[top]

2008-07-29 US Economic Releases


[Skip to the end]


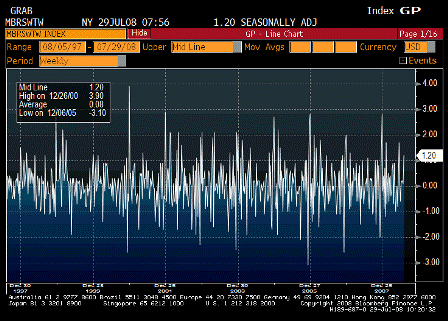
ICSC-UBS Store Sales WoW (Jul 29)

Survey n/a
Actual 1.2%
Prior 0.1%
Revised n/a

[top][end]

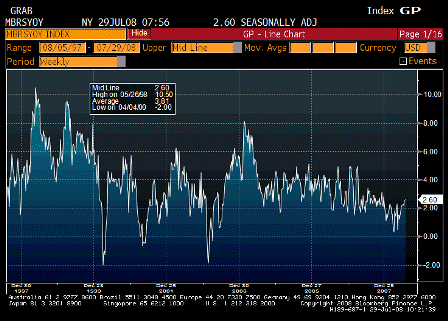
ICSC-UBS Store Sales YoY (Jul 29)

Survey n/a
Actual 2.6%
Prior 2.5%
Revised n/a

Still inching higher.

[top][end]

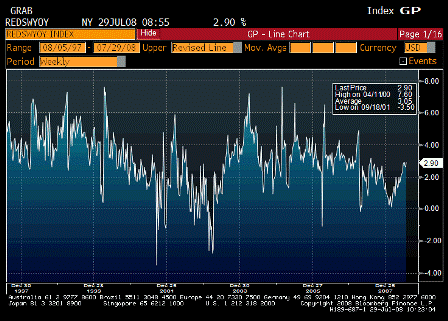
Redbook Store Sales Weekly YoY (Jul 29)

Survey n/a
Actual 2.9%
Prior 2.6%
Revised n/a

No let up here yet either.

[top][end]

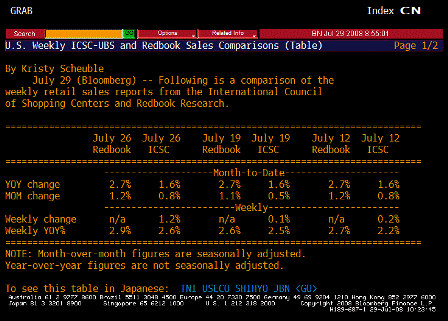
ICSC-UBS Redbook Comparison TABLE (Jul 29)

[top][end]


S&P-Case Shiller Home Price Index (May)

Survey n/a
Actual 168.54
Prior 169.85
Revised 170.00

[top][end]

S&P-CS Composite-20 YoY (May)

Survey -16.00%
Actual -15.78%
Prior -15.30%
Revised -15.22%

[top][end]

Case Shiller ALLX 1 (May)

[top][end]

Case Shiller ALLX 2 (May)

Still declining but the rate of decline is quickly diminishing,

In line with other housing indicators that are appear to have bottomed.

[top][end]


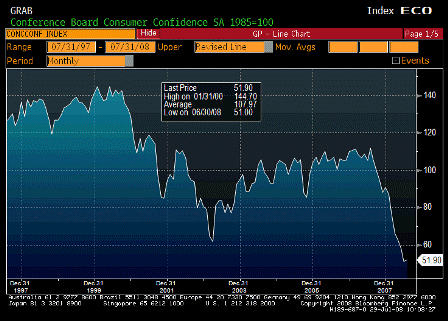
Consumer Confidence (Jul)

Survey 50.1
Actual 51.9
Prior 50.4
Revised 51.0

[top][end]

Consumer Confidence ALLX 1 (Jul)

[top][end]

Consumer Confidence ALLX 2 (Jul)

Survey
Actual
Prior
Revised

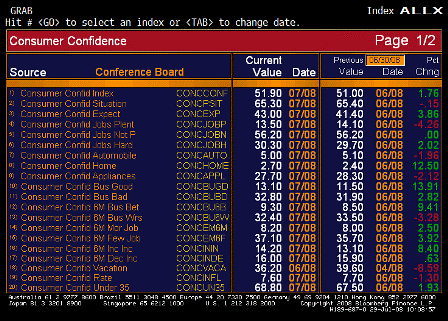
Karim writes:

  • Headline confidence rises from 51 to 51.9 (first gain since Dec)
  • Jobs Plentiful less jobs hard to get falls from -15.6 to -16.8 (new cycle low); with initial claims back above 400k now, payrolls on Friday have downside risk to -75k consensus. As important, increasing jobs hard to get is correlated to increasing duration of unemployment.
  • Plans to buy an auto fall to new cycle low of 5.0 from 5.1
  • Plans to buy a home increases from cycle low of 2.4 to 2.7
  • Plans to buy a major appliance fall to new cycle low of 27.7 from 28.3

[top][end]


ABC Consumer Confidence (Jul 27)

Survey
Actual
Prior -41
Revised

[top][end]

ABC Consumer Confidence ALLX (Jul 27)


[top]

2008-07-22 US Economic Releases


[Skip to the end]


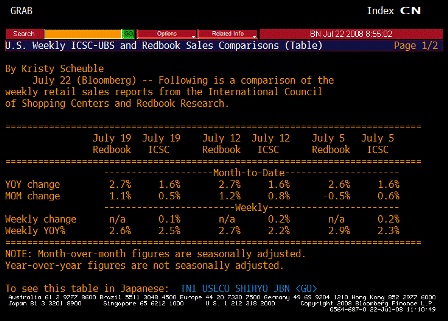
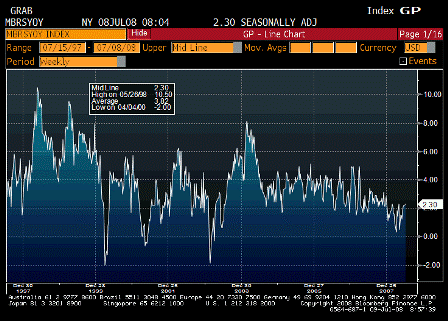
ICSC-UBS Store Sales YoY (Jul 15)

Survey n/a
Actual 2.5%
Prior 2.2%
Revised n/a

Still wiggling their way higher as fiscal kicks in.

[top][end]


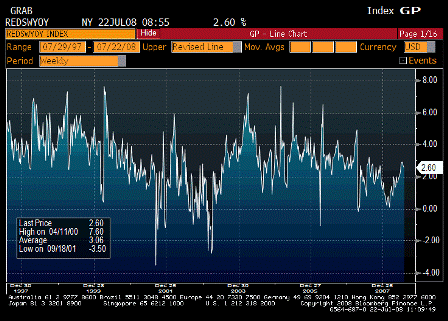
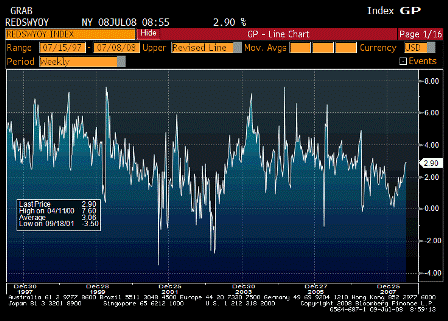
Redbook Weekly YoY (Jul 15)

Survey n/
Actual 2.6%
Prior 2.7%
Revised n/a

Also working its way higher.

[top][end]


ICSC-UBS and Redbook Comparison TABLE (Jul 15)

[top][end]


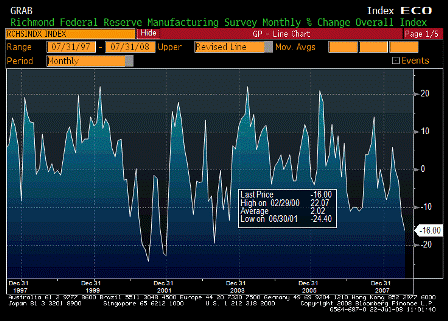
Richmond Fed Manufacturing Index (Jul)

Survey -9
Actual -16
Prior -12
Revised n/a

Big dip puts it back on its downtrend.

[top][end]

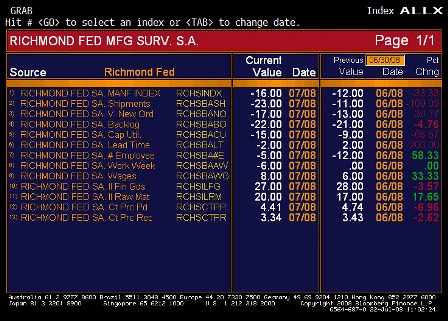
Richmond Fed Manufacturing Index ALLX (Jul)

Big drop in shipments,
interesting up tic in wages.

[top][end]


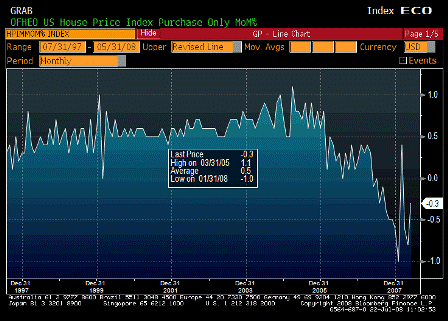
OFHEO House Price Index MoM (May)

Survey -0.8%
Actual -0.3%
Prior -0.8%
Revised n/a

Better than expected, still down, but seems to be falling at a slower rate.

[top][end]


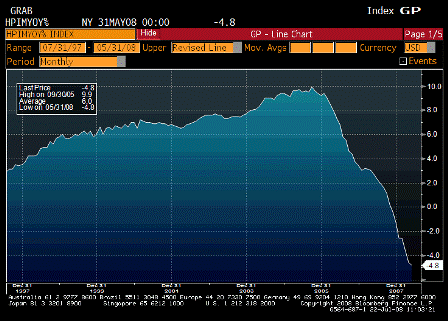
OFHEO House Price Index YoY (May)

Survey n/a
Actual -4.8%
Prior -4.6%
Revised n/a

Rate of decline seems to have diminished some. So far, year over year changes for this price range doesn’t seem that severe.

[top][end]


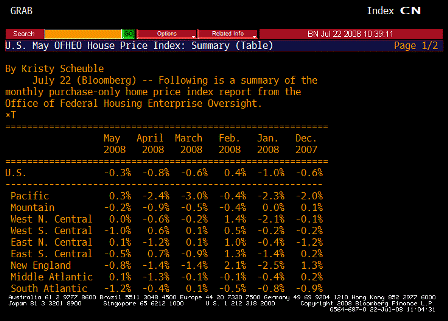
OFHEO House Price Index TABLE (May)

Several regions showing gains.

Unless commodities take a very large dive, the Fed needs an output gap in housing to keep a lid on overall prices.

[top][end]


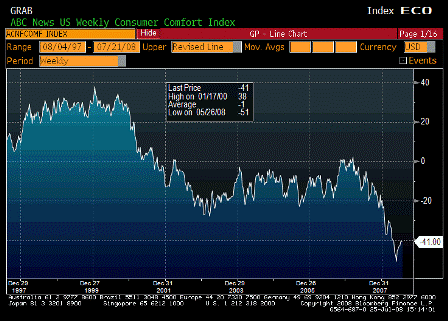
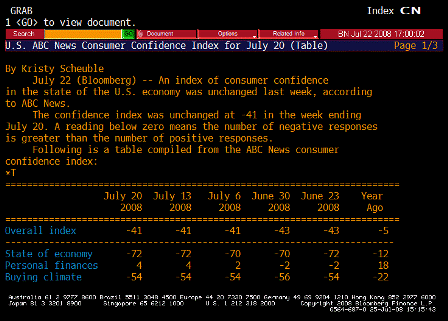
ABC Consumer Confidence (Jul 20)

Survey -42
Actual -41
Prior -41
Revised n/a

[top][end]


ABC Consumer Confidence TABLE (Jul 20)


[top]

2008-07-15 US Economic Releases


[Skip to the end]


ICSC-UBS Store Sales YoY (Jun)

Survey n/a
Actual 2.2%
Prior 2.3%
Revised n/a

Fiscal spending seems to have stemmed the decline.

[top][end]
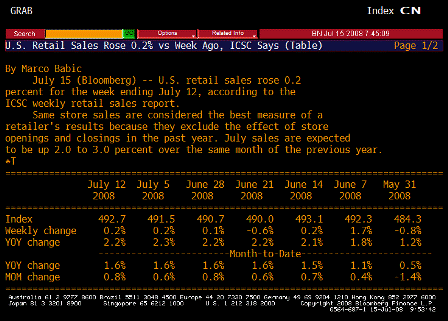
ICSC-UBS Store Sales TABLE (Jun)

Same.

[top][end]
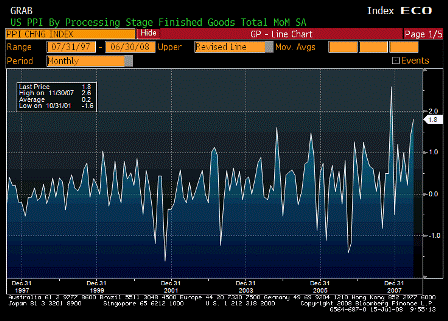

Producer Price Index MoM (Jun)

Survey 1.4%
Actual 1.8%
Prior 1.4%
Revised n/a

Looks like a banana republic with a weak currency.

[top][end]
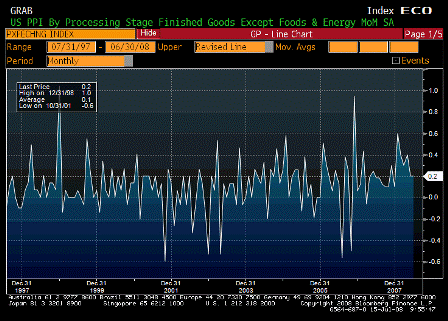
PPI Ex Food & Energy MoM (Jun)

Survey 0.3%
Actual 0.2%
Prior 0.2%
Revised n/a

Also looks to be working its way higher.

[top][end]
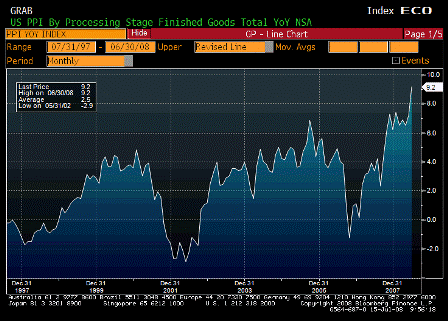
Producer Price Index YoY (Jun)

Survey 8.7%
Actual 9.2%
Prior 7.2%
Revised n/a

Inflation pouring in through the front door – import prices.

[top][end]
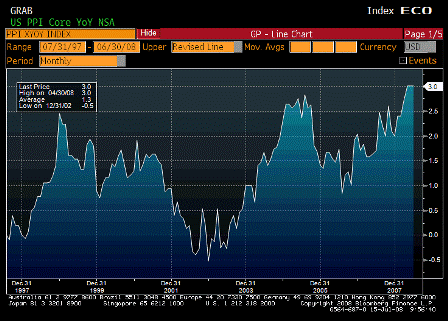
PPI Ex Food & Energy YoY (Jun)

Survey 3.2%
Actual 3.0%
Prior 3.0%
Revised n/a

Looking like its on the way up, as it’s recovered and surpassed the level of Aug 06 when Goldman changed their commodity index and triggered massive selling of gasoline.

The Fed is watching for headline to leak into core, which they’ve said is already happening.

When only food/crude/import prices go up, it’s a relative value story, as funds to buy that stuff mean less to buy other things, and they lag in price.

But in this case core measures are not going down to offset headline numbers.

True, they haven’t gone up that much yet, but they have gone up rather than down.

That means that yes, demand is ‘weak’ and unemployment creeping up,

But demand is still strong enough to support both higher headline CPI and rising core measures as well,

Supported by government spending which is not revenue constrained nor liquidity constrained,

And supported by booming exports as non residents trip over each other trying to spend their now unwanted multi $trillion hoard of US financial assets.

Current levels of demand are more than sufficient to support much higher levels of housing starts (though still low levels), relatively flat employment, and rising core inflation measures.

And US real terms of trade continue to deteriorate along with the standard of living as a foreign oil monopolist exacts ever higher relative prices.

[top][end]
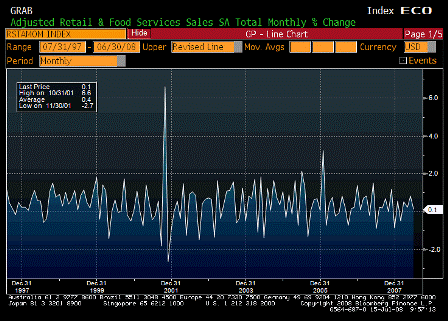

Advance Retail Sales MoM (Jun)

Survey 0.4%
Actual 0.1%
Prior 1.0%
Revised 0.8%

Lower than expected, due to weaker than expected auto sales, due to the wrong vehicles on the showroom floors, which will take a while to correct.

[top][end]
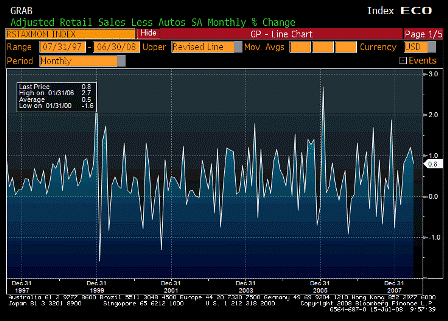
Retail Sales Less Autos MoM (Jun)

Survey 1.0%
Actual 0.8%
Prior 1.2%
Revised n/a

A little weaker than expected but pretty good from a strong previous month.

[top][end]
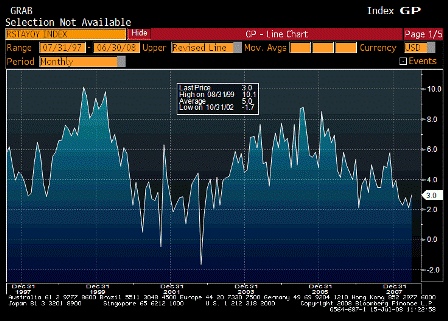
Advance Retail Sales YoY (Jun)

Survey n/a
Actual 3.0%
Prior 2.1%
Revised n/a

Once again fiscal policy, not monetary policy, stops the slide.

[top][end]
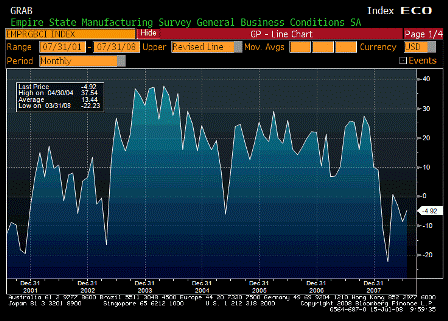

Empire Manufacturing (Jul)

Survey -8.0%
Actual -4.9%
Prior -8.7%
Revised n/a

May be on the mend from the lows.

Karim writes:

  • Retail sales a bit softer than expected..up 0.1% headline, up 0.8% ex-autos, and -0.5% ex-gas
  • Control (ex-autos, gas and building materials) up 0.3% and minor downward revisions to prior two months
  • PPI up 1.8% headline and 0.2% core; y/y 9.2% and 3.0% respectively
  • Pipeline pressures remain intense with intermediate up 2.1% m/m and crude 3.7%
  • Medical goods and services component decline (large component of PCE deflator; so June core PCE may come in 0.0% or 0.1%).
  • Empire survey shows modest improvement but stays in negative territory: -8.68 to -4.92
  • Right, Redbook sales show same moderate growth in non-auto sales. The wrong vehicles are on the showroom floors right now and it will take a while for the right ones to take their place.

    I have no idea what’s driving lower medical costs and whether further declines are to be expected, but seems highly unlikely.

    The dollar’s down again today.

    ‘Inflation’ is flowing in through that channel like water through a screen door on a submarine.

    [top][end]
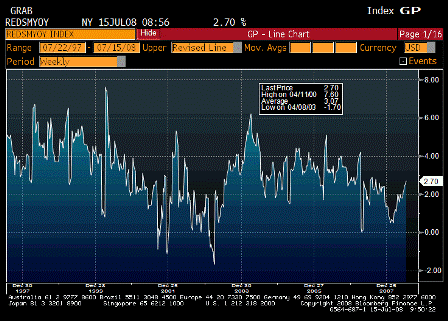

    Redbook Store Sales (Jul 8)

    Survey n/a
    Actual 2.7%
    Prior 2.6%
    Revised n/a

    Moving up as fiscal policy kicks in.

    [top][end]
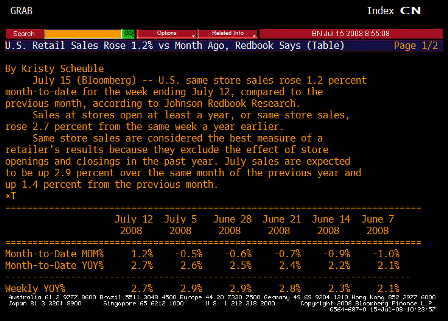
    Redbook Store Sales TABLE (Jul 8)

    [top][end]


    IBD/TIPP Economics Optimism (Jul)

    Survey 36.8
    Actual 37.4
    Prior 37.4
    Revised n/a

    A little better than expected.

    [top][end]
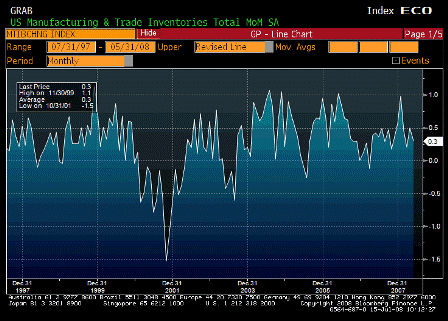

    Business Inventories (May)

    Survey 0.5%
    Actual 0.3%
    Prior 0.5%
    Revised n/a

    Possible that sales may be exceeding estimates and lowering inventories.

    [top][end]
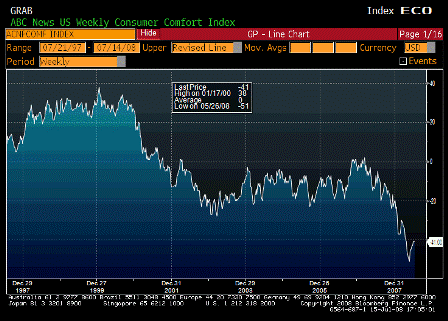

    ABC Consumer Confidence (Jul 13)

    Survey -41
    Actual -41
    Prior -41
    Revised n/a

    Seems to have bottomed, but remains at low levels, probably due to inflation.


    [top]
2008-07-08 US Economic Releases


[Skip to the end]


ICSC-UBS Store Sales YoY (Jul 8)

Survey n/a
Actual 2.3%
Prior 2.2%
Revised n/a

Holding up with the rebate checks.

[top][end]


Redbook Sales YoY (Jul 8)

Survey n/a
Actual 2.9%
Prior 2.9%%
Revised n/a

Rebate checks doing their thing.

[top][end]


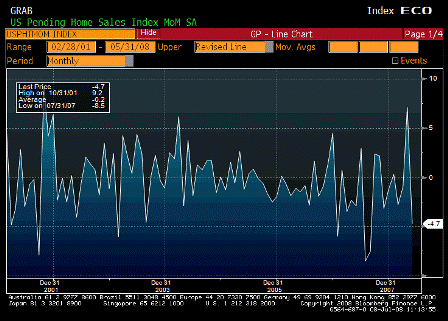
Pending Home Sales MoM (May)

Survey -3.0%
Actual -4.7%
Prior 6.3%
Revised 7.1%

[top][end]

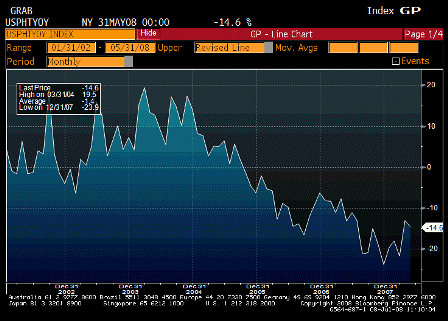
Pending Home Sales YoY (May)

Survey n/a
Actual -14.6%
Prior -13.0%
Revised n/a

Still looks like they may be moving back up to me.

[top][end]


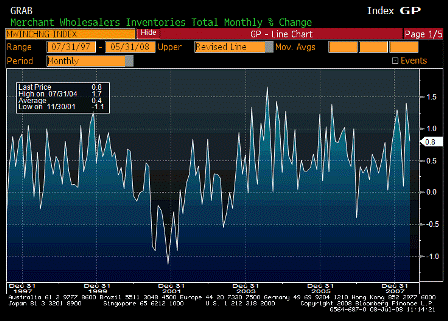
Wholesale Inventories MoM (May)

Survey 0.6%
Actual 0.8%
Prior 1.3%
Revised 1.4%

[top][end]

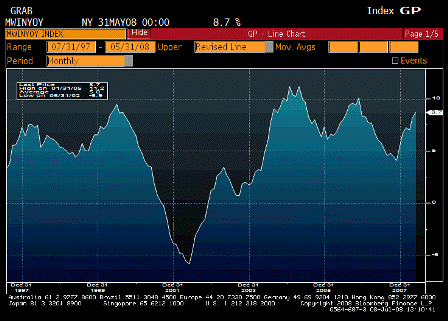
Wholesale Inventories YoY (May)

Survey n/a
Actual 8.7%
Prior 8.1%
Revised n/a

Moving up some but not problematic yet.

[top][end]


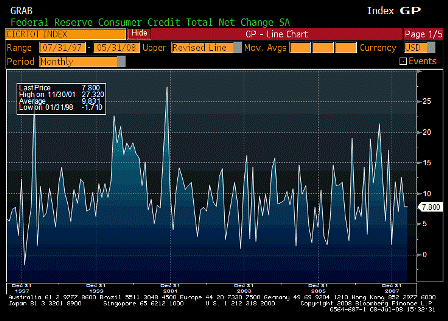
Consumer Credit (May)

Survey $7.5B
Actual $7.8B
Prior $8.9B
Revised $7.8B

[top][end]


ABC Consumer Confidence (Jul 6)

Survey -43
Actual -41
Prior -43
Revised n/a

Still low but higher than expected and moving up with the rebates.


[top]
2008-07-01 US Economic Releases


[Skip to the end]


ICSC-UBS Store Sales Weekly Change (Jul 1)

Survey n/a
Actual 0.1
Prior -0.6
Revised n/a

Muddling through as govt spending and fiscal rebates offer support.

[top][end]


Redbook Weekly YoY (Jul 1)

Survey n/a
Actual 2.9
Prior 2.8
Revised n/a

A bit better than expected and seem to be moving higher.

[top][end]


ICSC-UBS and Redbook TABLE (Jul 1)

Survey n/a
Actual n/a
Prior n/a
Revised n/a

[top][end]


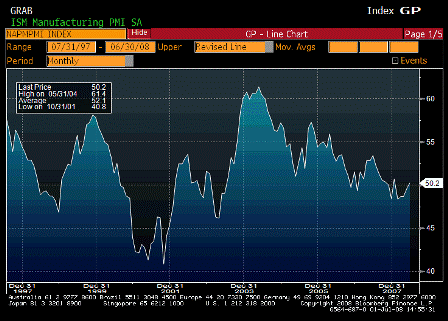
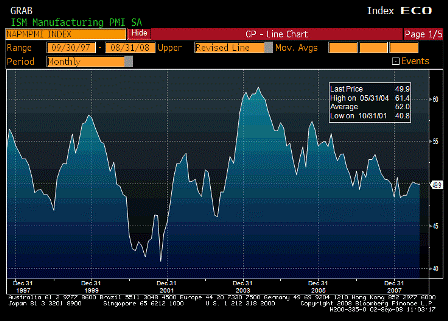
ISM Manufacturing (Jun)

Survey 48.5
Actual 50.2
Prior 49.6
Revised n/a

Better than expected, headline looks better than the detail, but holding up well above recession levels.

[top][end]

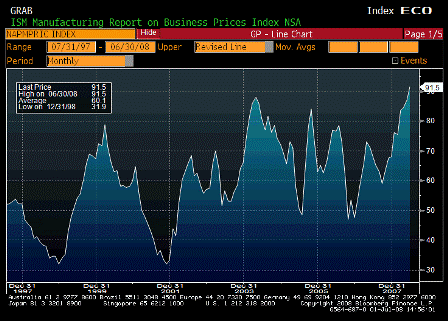
ISM Prices Paid (Jun)

Survey 87.0
Actual 91.5
Prior 87.0
Revised n/a

Breaking out. Question is whether there’s any level of inflation that will trigger a fed rate hike if GDP and financial conditions (whatever that means) stay at current levels.

[top][end]

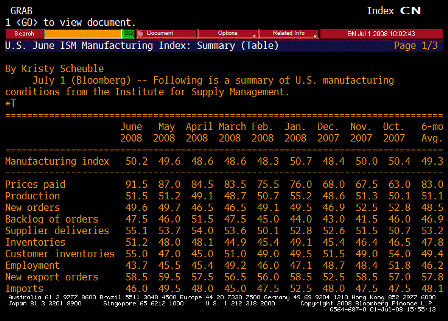
ISM TABLE (Jun)

Karim writes:

  • Not much change in headline or production/new order components.
  • Most material changes in prices paid (up 4.5; to new cycle high) and employment (down 1.8; to new cycle low).

Kohn’s speech: tolerate higher unemployment and higher inflation.

  • Based on continuing claims, conference board, and now ism, downside risk to -60k consensus for nfp on Thursday.

Weak, but not recession levels yet.

Government plus exports so far have made up for weak non-government domestic demand.

[top][end]


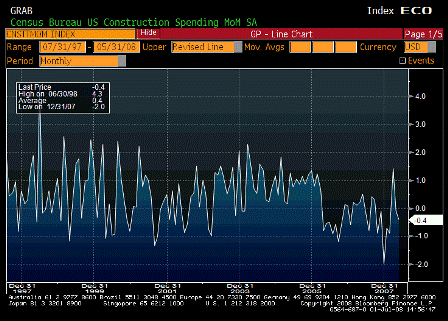
Construction Spending MoM (May)

Survey -0.6%
Actual -0.4%
Prior -0.4%
Revised -0.1%

A bit better than expected. Down but not terrible.

[top][end]


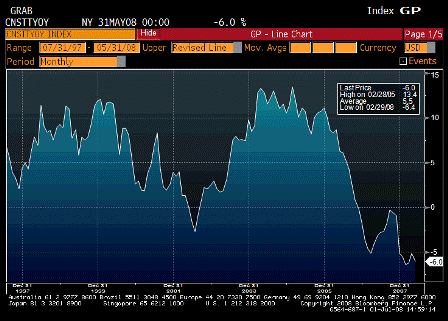
Construction Spending YoY (May)

Survey n/a
Actual -6.0%
Prior -5.1%
Revised n/a

Still near the lows, but a possible bottoming action.

[top][end]


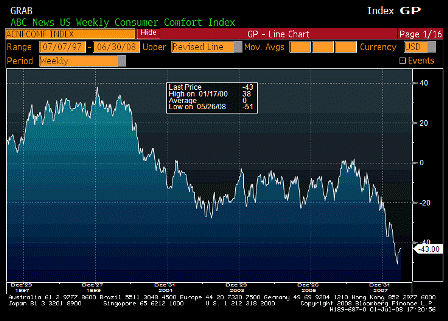
ABC Consumer Confidence (Jun 29)

Survey n/a
Actual -43
Prior -43
Revised n/a

Still looking pretty grim, probably mostly due to higher prices.


[top]
2008-06-24 Daily US Economic Releases


[Skip to the end]


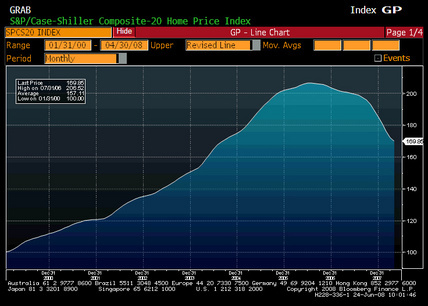
S&P/Case Shiller Home Price Index (Apr)

Survey
Actual 169.9
Prior 172.2
Revised 172.2

[top][end]


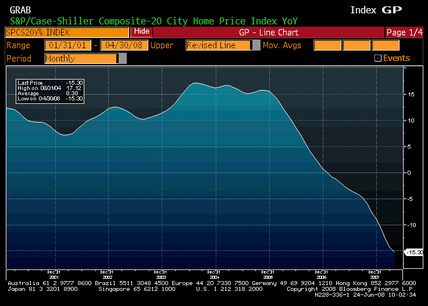
S&P/Case Shiller Composite 20 YoY (Apr)

Survey -16.0%
Actual -15.3%
Prior -14.4%
Revised -14.3%

Karim writes:

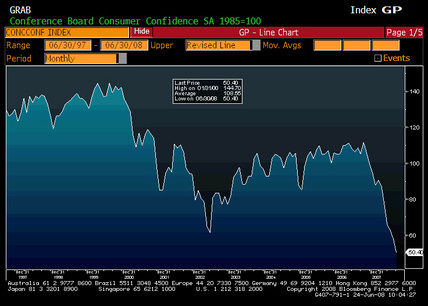
  • Conf board survey drops to 16yr low, from 58.1 to 50.4
  • Current conditions drop 9.7pts and future expectations fall 6.3pts
  • 1yr fwd inflation expex unch at 7.7
  • All following drop to new cycle lows
  • Jobs plentiful less jobs hard to get (-12.2 to -16.4; pretty good leading indicator of unemployment rate)
  • Plans to buy auto in next 6mths from 5.1 to 4.8
  • Plans to buy a home from 2.4 to 2.2
  • Plans for a domestic vacation from 33.4 to 29.6
  • Plans for foreign vacation from 8.2 to 7.5

Inflation is biting harder than the lower Fed funds rate is helping.

The Fed has to decide whether a slightly higher Fed funds rate will bring more relief/benefit to consumers on the inflation side than possible additional drag from the interest rate side.
[top][end]


Consumer Confidence (Jun)

Survey 56.0
Actual 50.4
Prior 57.2
Revised 58.1

[top][end]


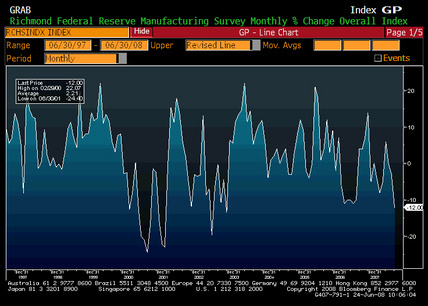
Richmond Fed Manufacturing Index (Jun)

Survey -5
Actual -12
Prior -5
Revised n/a

Not looking good.

Weakness and ‘inflation’ continue.
[top][end]


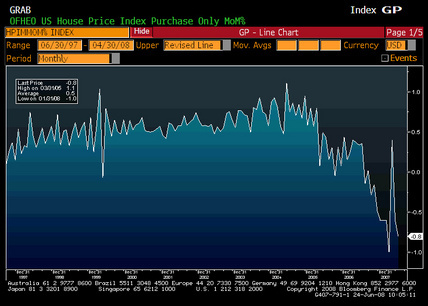
House Price Index MoM (Apr)

Survey -0.4%
Actual -0.8%
Prior -0.4%
Revised -0.6%

Back down, but at least not through the lows.

[top][end]


ABC Consumer Confidence (Jun 22)

Survey
Actual
Prior -44
Revised


[top]