JOLTS, Redbook sales, Rig count, Credit check, NK comment, PMC jersey

Openings higher than hires tells me employers don’t want to pay up, which is also suggested by low wage growth:

Highlights

In the latest indications of strong, tight conditions in the labor market, job openings rose to a higher-than-expected 6.170 million in July for a 0.9 percent increase from June. Hirings also rose, up 1.3 percent to 5.501 million which, however, is 669,000 below openings. Openings have been far ahead of hirings for the past several years to indicate that employers are having a hard time filling positions.

Other indications are steady to higher with the separation rate at 3.6 percent, the quits rate at 2.2 percent, and the layoff rate at 1.2 percent. The only employment data that aren’t strong, in data however that are not part of the JOLTS report, are wages, yet job openings in this report are certain to catch the eye of the more hawkish FOMC policy makers who continue to warn that wage-push inflation is inevitable.

The growth rate of new openings is at stall speed:


The new hiring has stalled:


Moving higher again, as previously discussed:


Looks like the increases in new drilling are behind us, and new wells are costing a lot less than before the shale bust, so it’s all adding that much less to GDP:


Not to kick a dead horse, but gdp growth is getting less support from credit growth than it did last year. And that reduction appears to be over 2% of GDP. So far GDP has held up from consumers dipping into savings, which looks to me to be an unsustainable process:


I’m thinking I’d tell North Korea that if they don’t abandon their nukes will give China a green light to annex them… ;)

China urges North Korea to ‘take seriously’ bid to halt nuclear program

Sept 12 (Reuters) — China’s U.N. Ambassador Liu Jieyi called on North Korea to “take seriously the expectations and will of the international community” to halt its nuclear and ballistic missile development, and called on all parties to remain “cool-headed” and not stoke tensions. Liu said relevant parties should resume negotiations “sooner rather than later.” To kick-start talks, China and Russia have proposed a dual suspension of North Korea’s nuclear and ballistic missile testing as well as U.S. and South Korean military exercises. U.S. Ambassador to the United Nations Nikki Haley has called the proposal insulting.

Factory orders, Euro charts, Oil prices

Manufacturing continues to muddle through:

Highlights

There’s really only good news in the July factory orders report where the headline, at minus 3.3 percent, reflects a slowing in what were strong prior gains for aircraft orders. The best news is a 6 tenths upward revision to core capital goods orders (nondefense ex-air) to a 1.0 percent gain and a 2 tenths upward revision to core shipments, now at 1.2 percent. These numbers point to accelerating strength for third-quarter business investment.

Total shipments rose a moderate 0.3 percent in the month with inventories up only 0.2 percent. This takes the inventory-to-shipments ratio to a more lean and positive 1.37 from 1.38. Unfilled orders are not a positive, falling 0.3 percent after however a giant 1.3 percent build in June.

The split between the report’s two main components shows a 0.4 percent gain for nondurable goods — the new data in today’s report where strength is tied to petroleum and coal — and a 6.8 percent dip for durable orders which is unchanged from last week’s advance report for this component. The total ex-transportation gain is a strong 0.5 percent vs June’s 0.1 percent increase.

The core strength was posted despite weakness at the heart of capital goods and that’s machinery where orders fell 0.9 percent though shipments of machinery did rise 0.2 percent. Today’s factory orders report closes the book, one that includes a 0.1 percent decline in the manufacturing component of the industrial production report, on what was a mixed month for the factory sector.


Consumer demand not looking so strong:


Charts indicating underweight euro holdings:


Seems Saudis are hiking prices, perhaps due to weaker $:

Aramco Raises All October Oil Pricing to Asia, Mediterranean

By Anthony DiPaola, Sharon Cho and Serene Cheong

Sept 4 (Bloomberg) —

  • State-run Saudi Aramco sets official selling price of Arab Light crude for Oct. sales to Asia at 30c/bbl premium to Oman-Dubai benchmark, according to emailed statement
  • Grade’s OSP differential increased by 55c/bbl for Oct. vs Sept.
  • That’s a larger increase than +35c m/m forecast in Bloomberg survey
  • READ: Saudis May Raise Oct. Arab Light Crude Price to Asia: Survey
  • Arab Super Light official price for Oct. set at $4/bbl premium to benchmark prices, +70c m/m
  • Arab Extra Light at $1.40/bbl premium to benchmark prices, +80c m/m
  • Arab Medium official price at 55c/bbl discount to benchmark prices, +35c m/m
  • Arab Heavy official price at $1.65/bbl discount to benchmark prices, +30c m/m
  • Aramco raises most pricing for buyers in U.S., Medium crude unchanged
  • Extra Light at $3.30/bbl premium to Argus Sour Crude Index benchmark, +50c/bbl m/m
  • Light at $1.30/bbl premium, +10c m/m
  • Heavy at $1.30/bbl discount to benchmark, +20c m/m
  • Aramco raises Extra Light pricing to NW Europe by 65c/bbl m/m to discount of 45c/bbl to ICE Brent crude benchmark; co. cuts rest of grades
  • Light to $2.15/bbl discount, -10c m/m
  • Medium to $3.10/bbl discount, -10c m/m
  • Heavy to $4.40/bbl discount, -30c m/m
  • Aramco raises all grades to Mediterranean region
  • Extra Light to 40c/bbl discount to ICE Brent, +95c m/m
  • Light to $2.10/bbl discount, +30c m/m
  • Medium to $3.20/bbl discount, +20c m/m
  • Heavy to $4.15/bbl discount, +5c m/m
  • Misc. charts, Cryptocoin hedge funds, Bank loans

    Interesting charts:


    Over 50 hedge funds attracting investors who want to go long bitcoin and the rest. Helps explain why the prices are going up even as there is no intrinsic or conversion value whatsoever, which, presuming that to be the case, also means that at some point the mania ends and the price goes all the way back to 0:

    Hedge funds are cashing in on bitcoin mania — there are now 50 dedicated to cryptocurrencies


    Digital currencies, such as Bitcoin, are powered by distributed ledger technology and are not controlled by a centralized authority. The market for such currencies has exploded with over 800 coins on the market with a combined marketcap of $166 billion.

    Autonomous NEXT, a fintech analytics firm, released a list of 55 cryptocurrency hedge funds on Tuesday, illustrating the mounting interest in the space.

    Protecting their investors…
    ;)

    Bitcoin price drops $200 after new ruling from Chinese regulators

    Another interesting chart:


    Still no pick up in site:

    Employment, Construction spending, Auto sales, Tax plan and debt ceiling

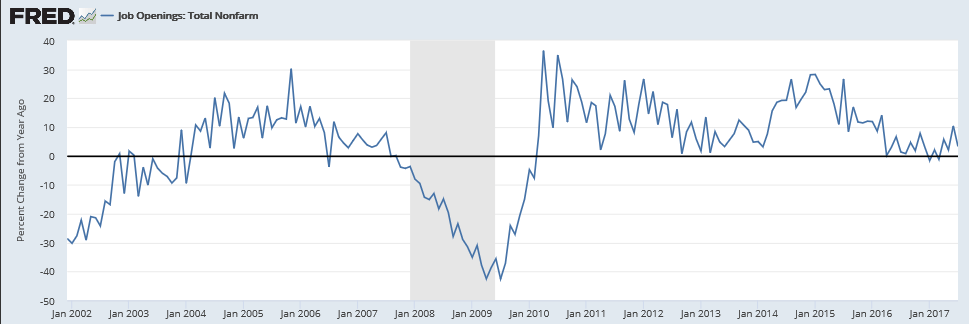
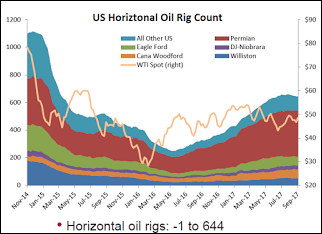
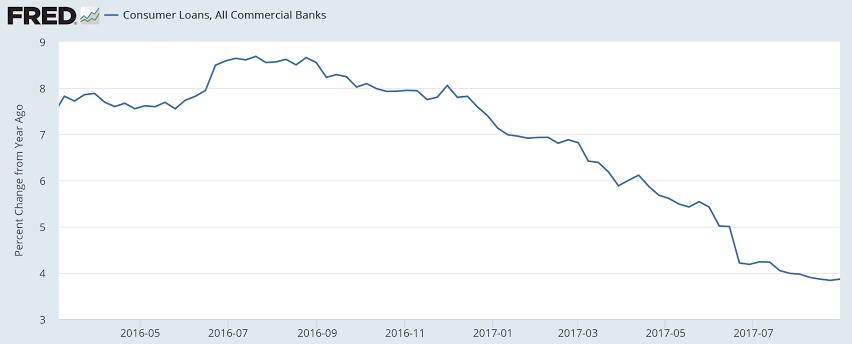
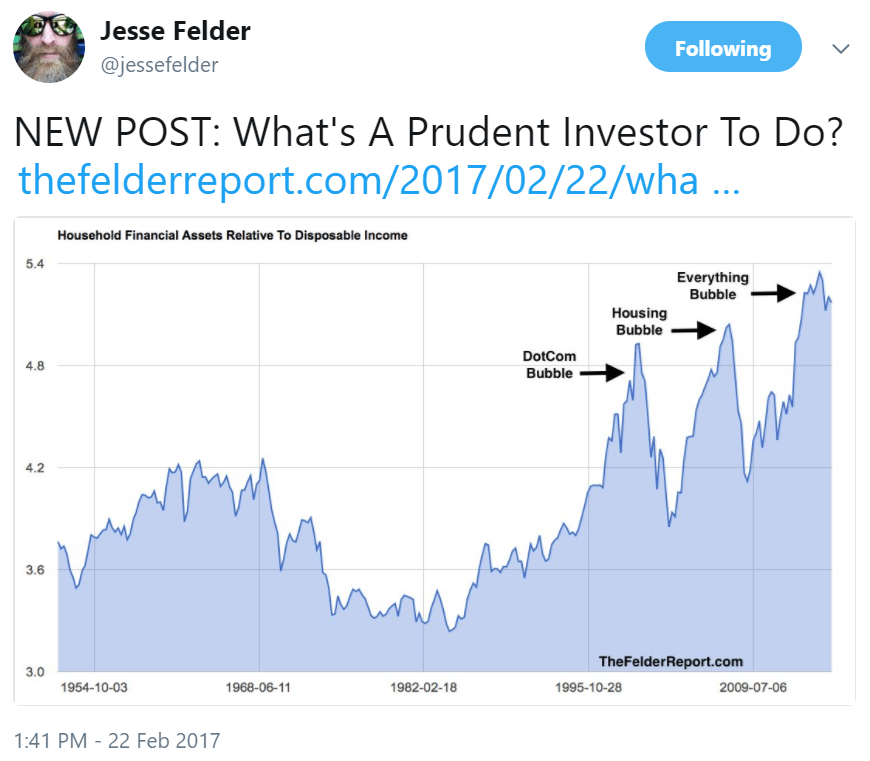
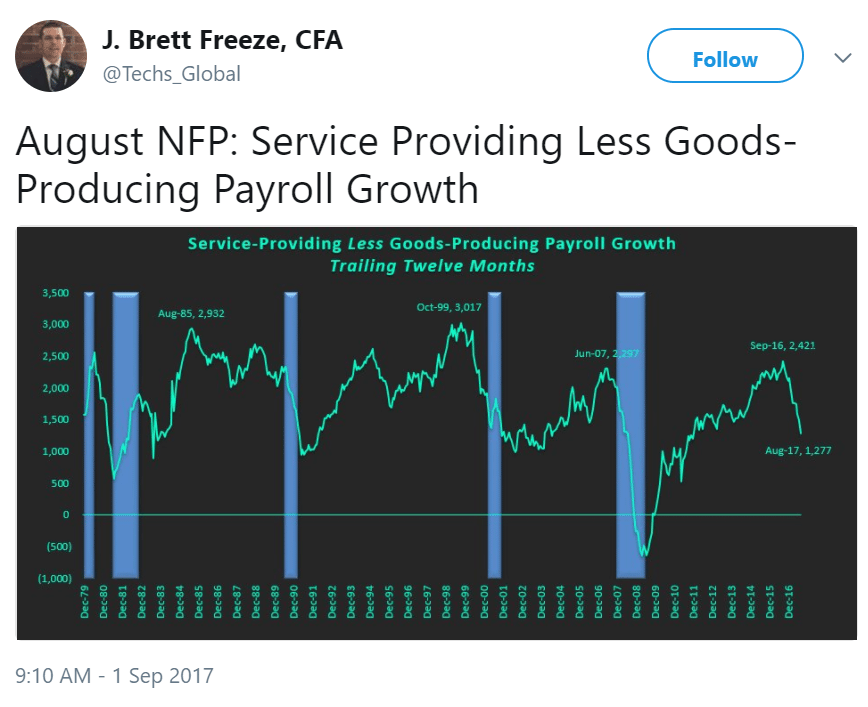
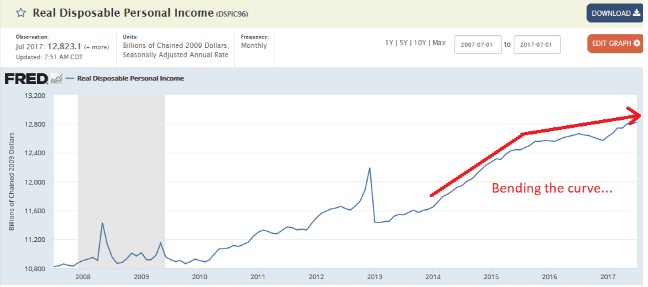
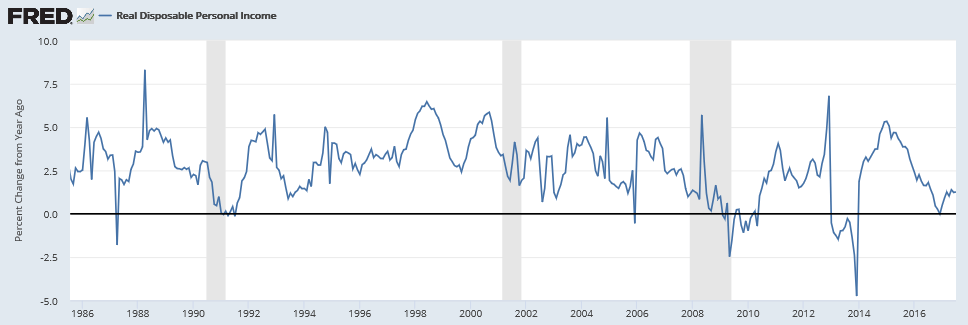
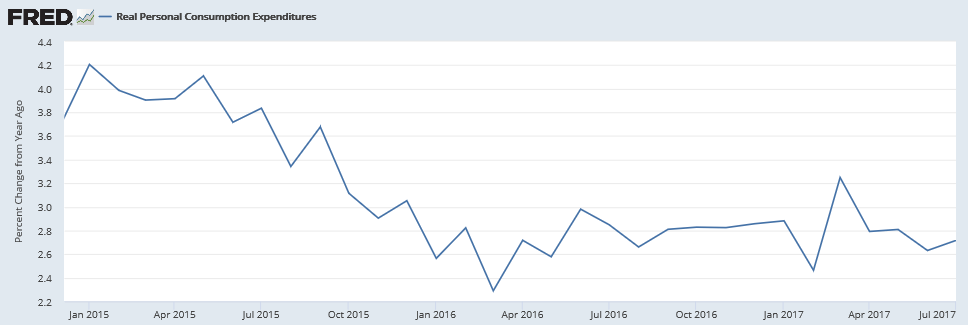
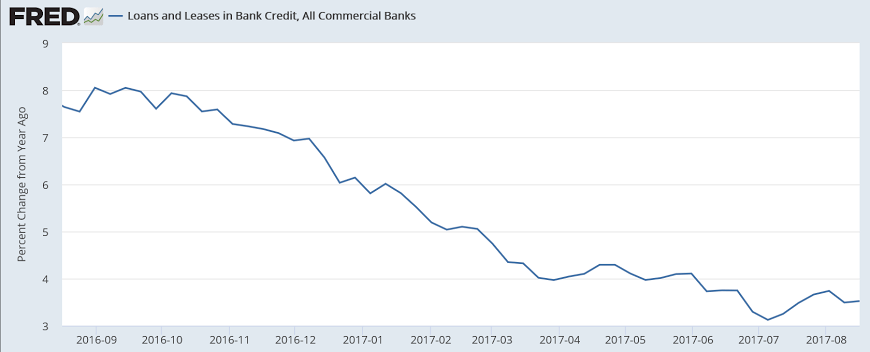
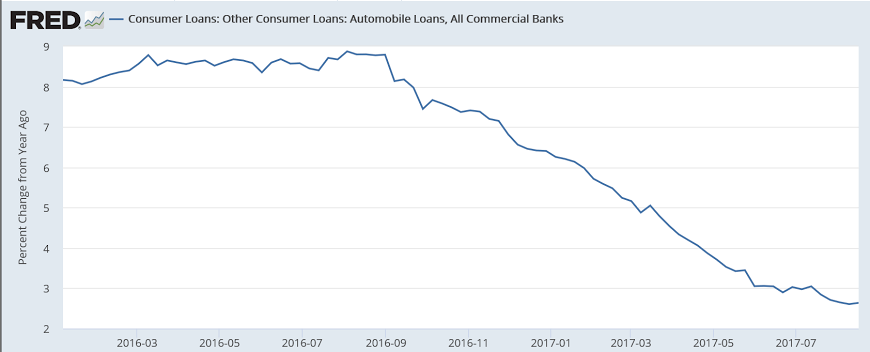
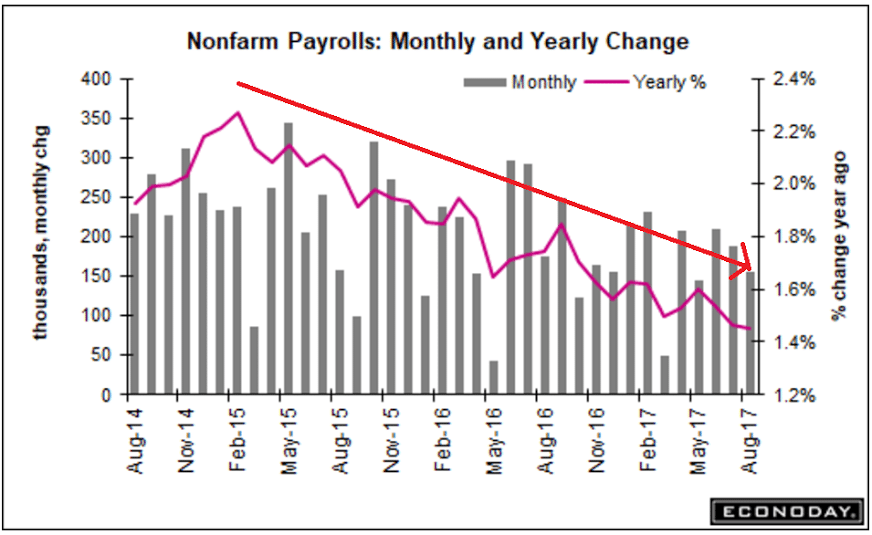
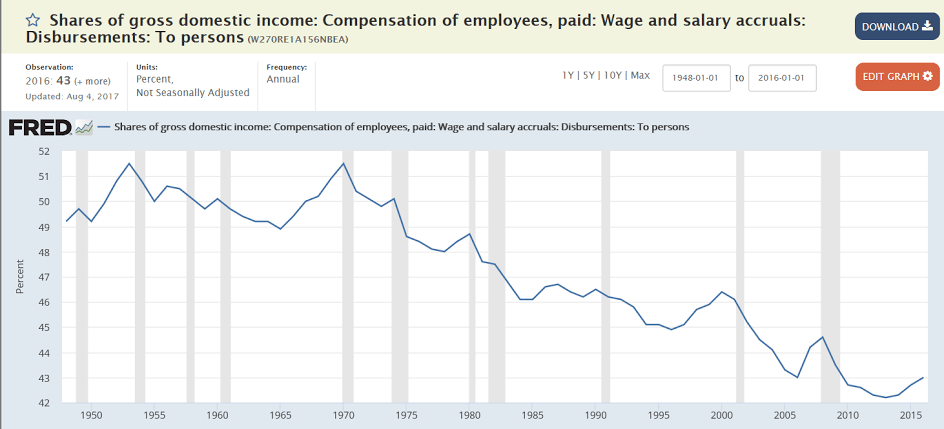
    Weaker than expected, downward revisions, depressed earnings growth and participation rate. And note how the year over year growth has been going down now in, for all practical purposes a straight line, for over 2 1/2 years, when the shale boom ended and oil capex collapsed:

    Highlights

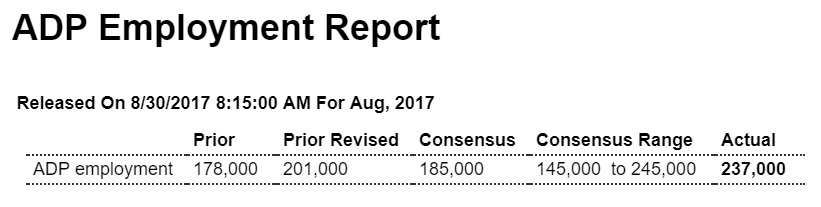
    August payroll growth, though solid, missed expectations while wage data clearly disappointed. Nonfarm payrolls rose 156,000 in the month vs Econoday’s consensus for 180,000. Revisions are negative with July revised 20,000 lower to 189,000 and June down 21,000 to 210,000. The unemployment rate reflects the softness, rising 1 tenth to 4.4 percent.

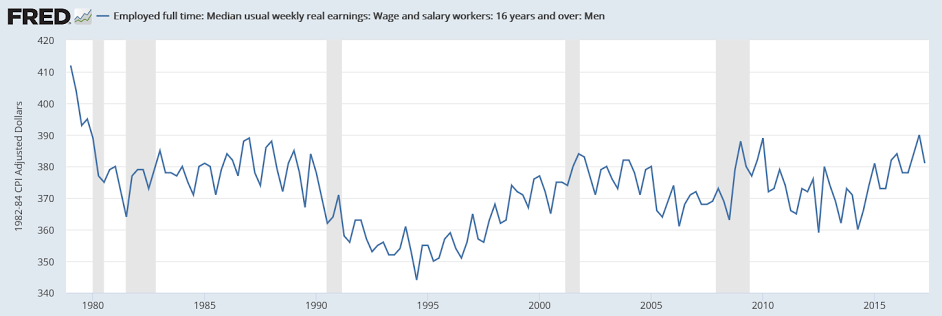
    Average hourly earnings barely rose at all, up a monthly 0.1 percent with the year-on-year rate at 2.5 percent. These are both 1 tenth below expectations.

    But a major positive in the report, and one correctly signaled by regional factory reports, is a 36,000 surge in manufacturing payrolls that includes a 10,000 upward revision to July to a 26,000 increase and a 9,000 upgrade to June to a gain of 21,000. Construction payrolls are also solid, up 28,000 in August following a 3,000 decline in July. An offset to manufacturing and construction is weakness in retail which, after six straight monthly declines, added only 1,000 jobs despite Amazon’s plans to hire 50,000.

    And government payroll growth is below expectations, falling 9,000 for the third decline in four months. Excluding government payrolls, private payrolls in August came in at 165,000 which is 9,000 above the headline total but still 15,000 short of expectations.

    Weekly hours are also soft, down 1 tenth to 34.4 with manufacturing, in contrast to the hiring, down 2 tenths to 40.7 hours which points to a second straight monthly disappointment for the manufacturing component of the industrial production report.

    But it’s the wage data that, for policy makers, may be the greatest disappointment and will provide the doves, who are concerned about the economy’s lack of inflation, serious arguments to delay the beginning of balance-sheet unwinding at this month’s FOMC.


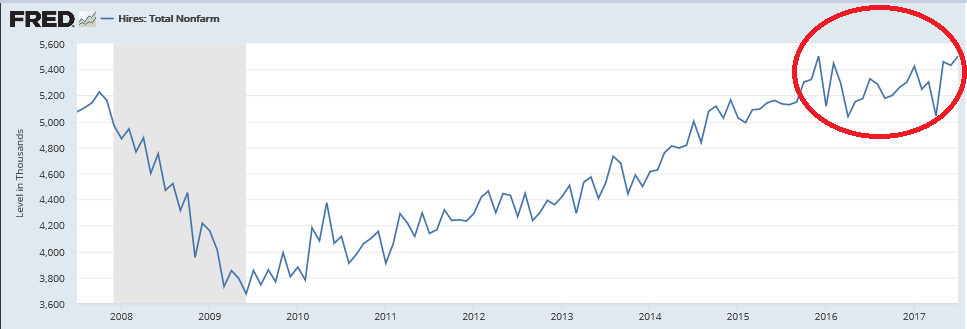
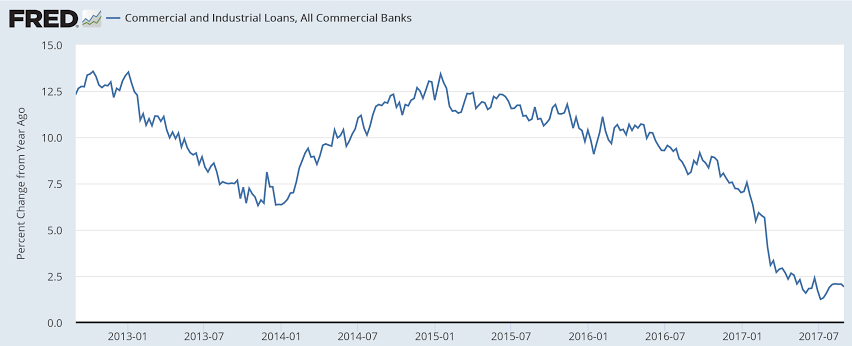
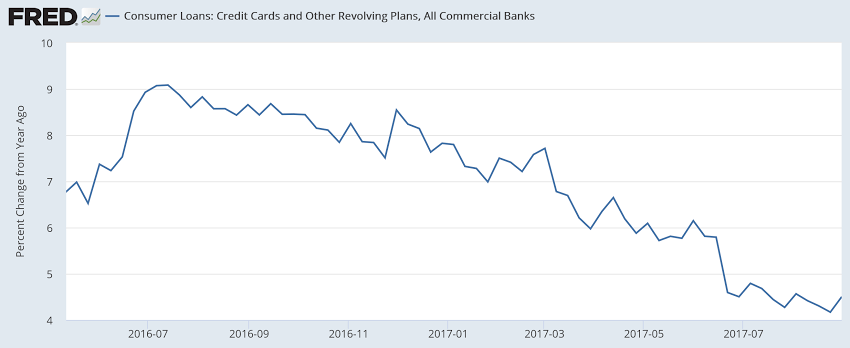
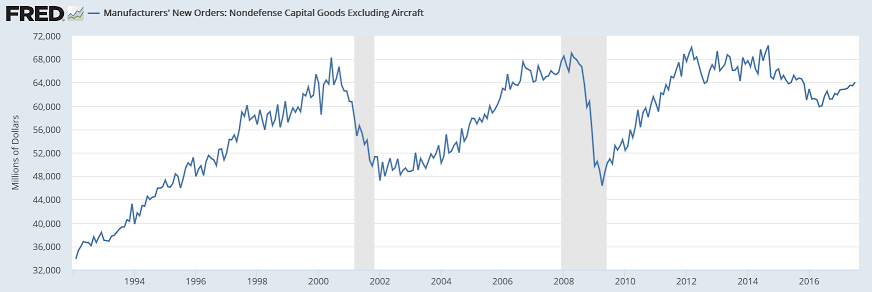
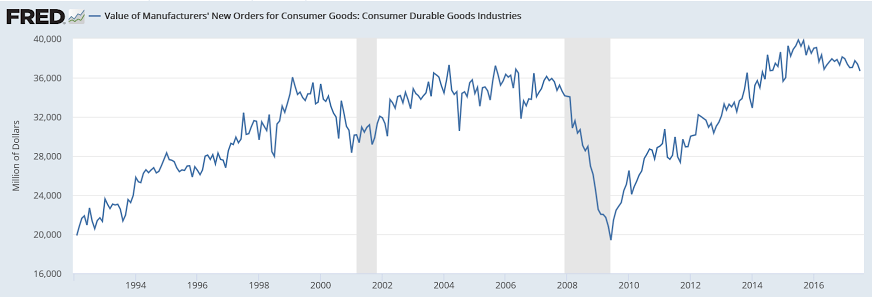
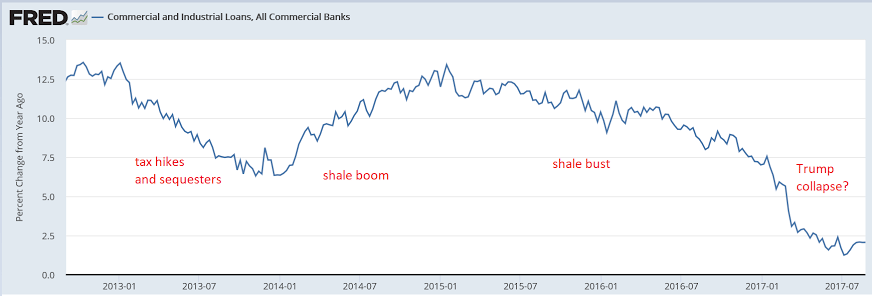
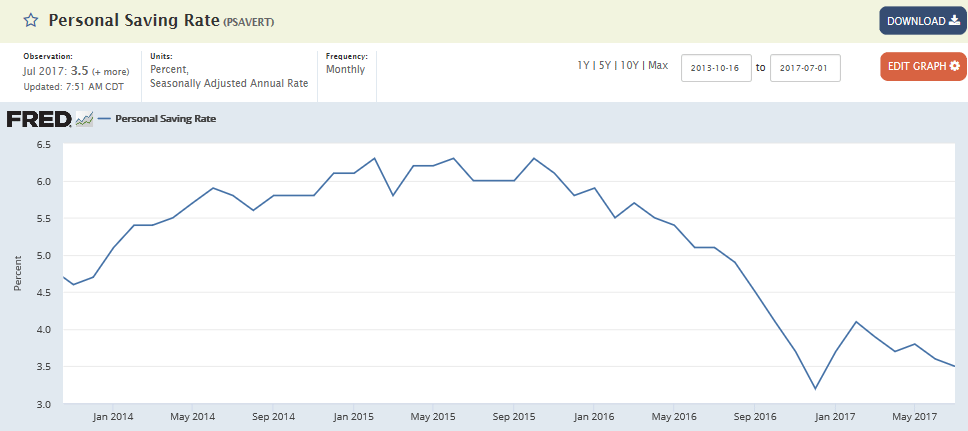
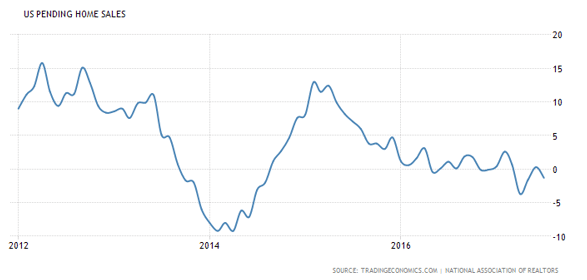
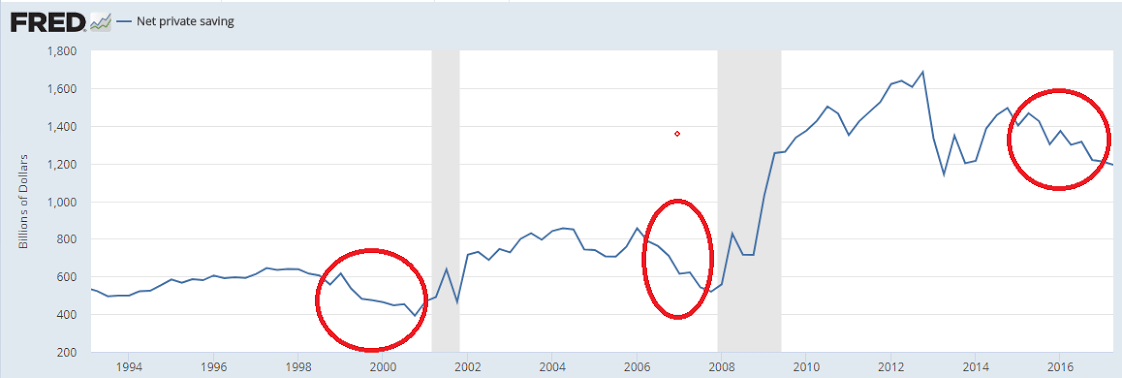
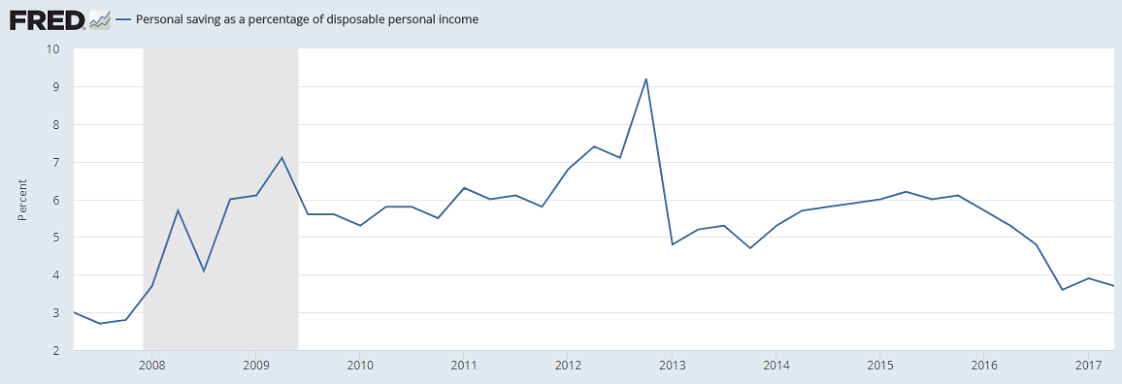
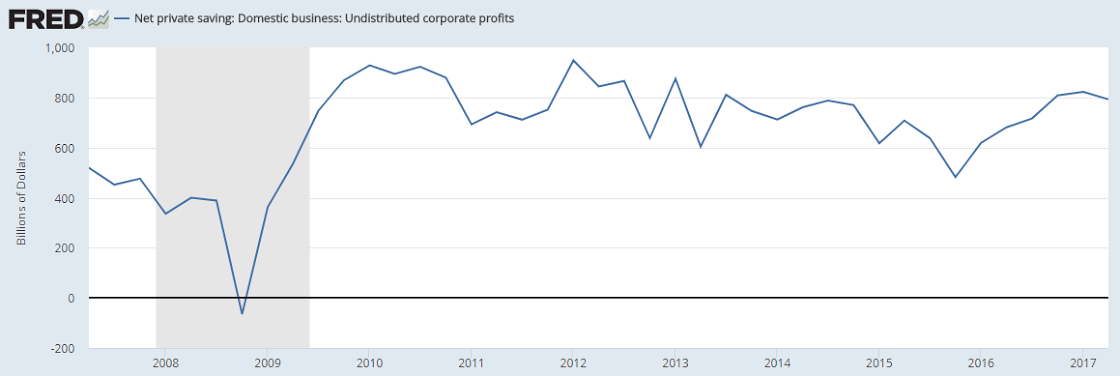
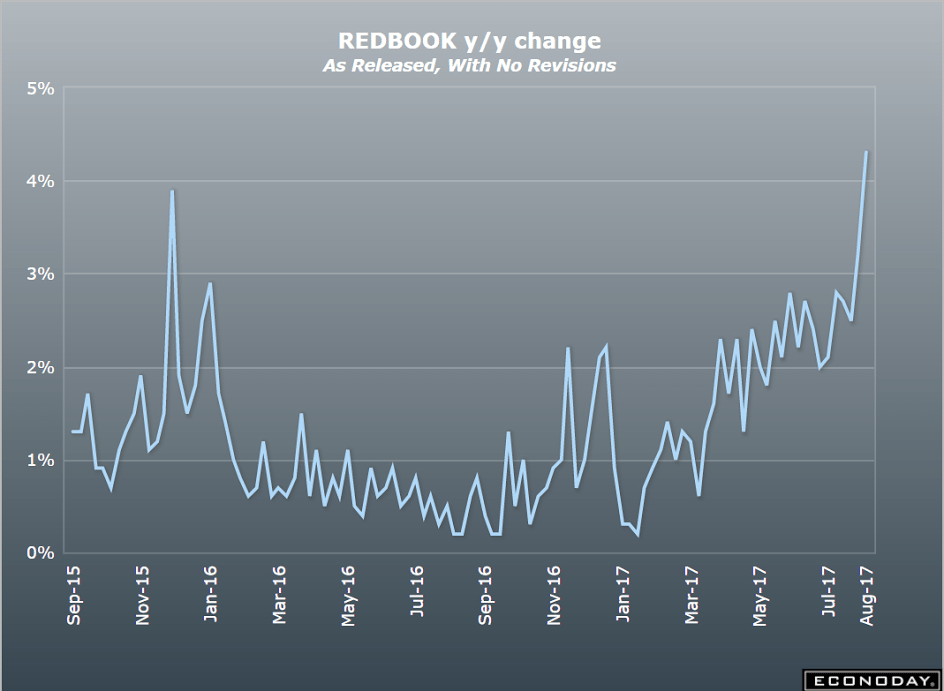
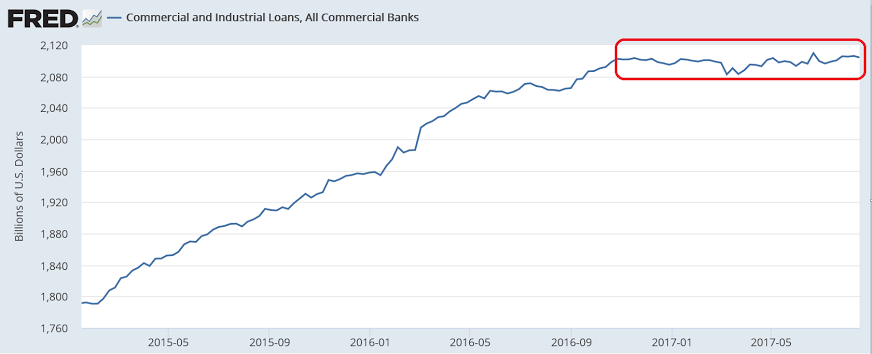
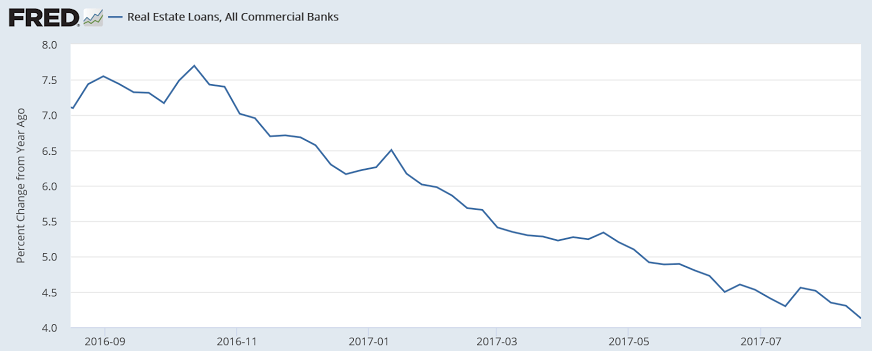
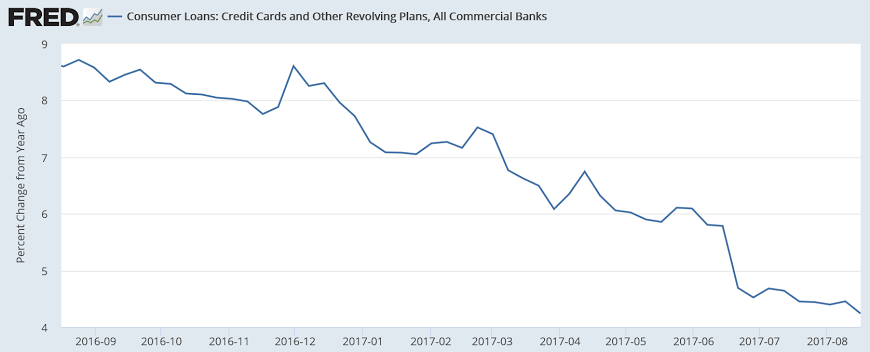
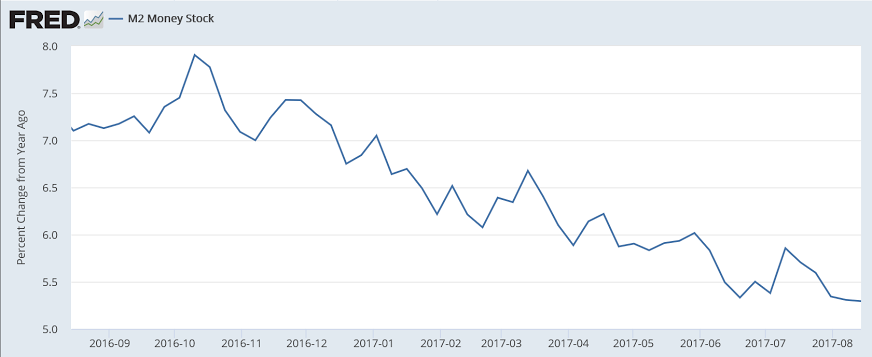
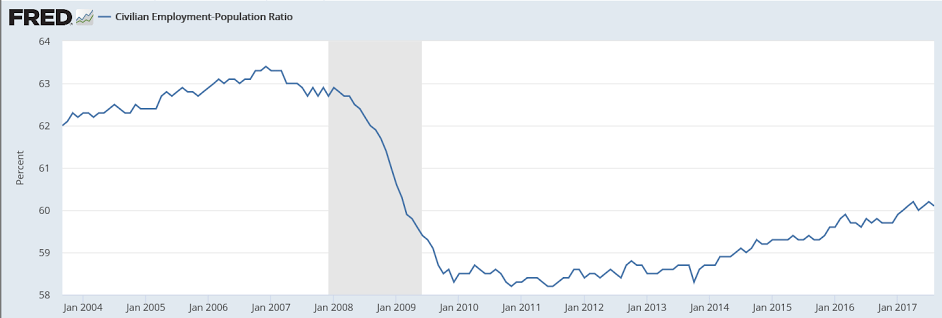
    Flattening out at very low levels:


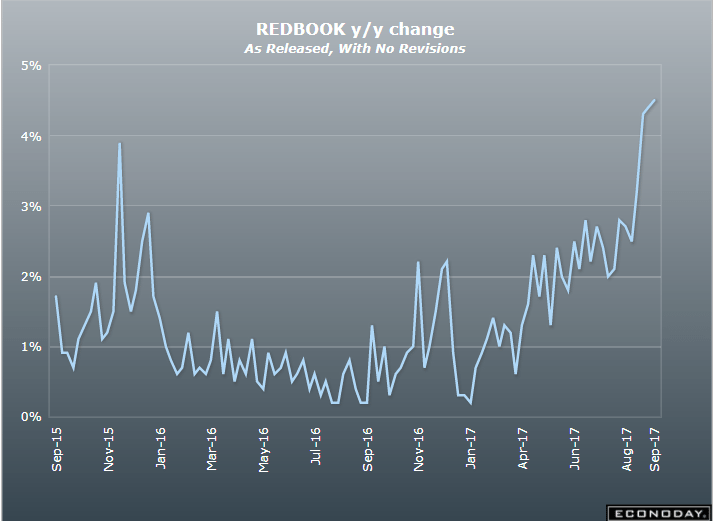
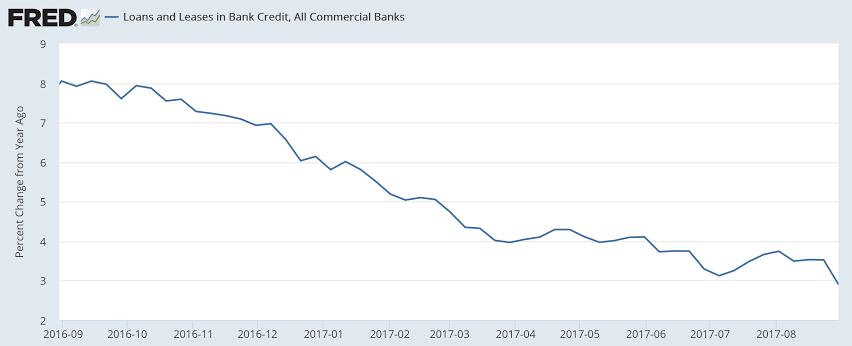
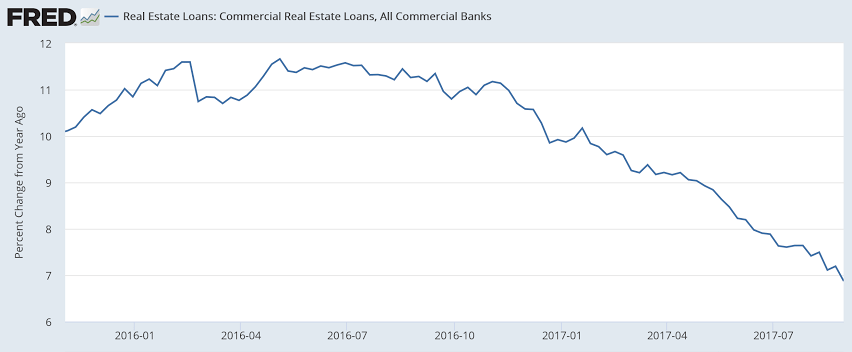
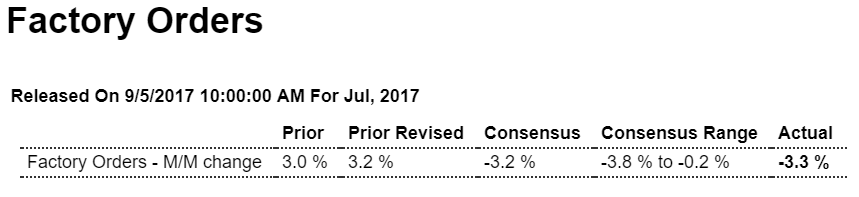
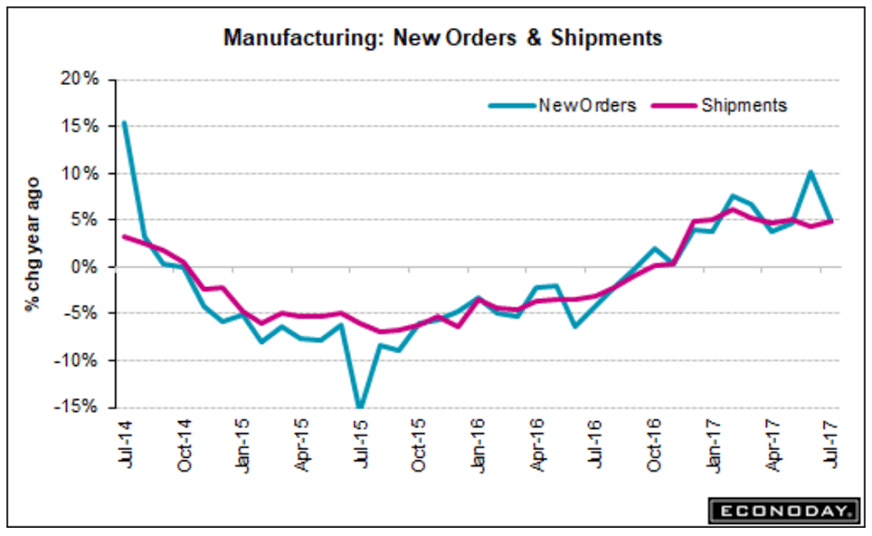
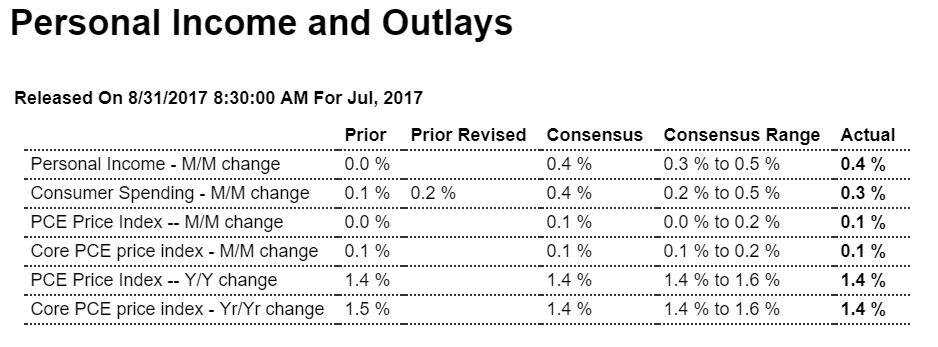
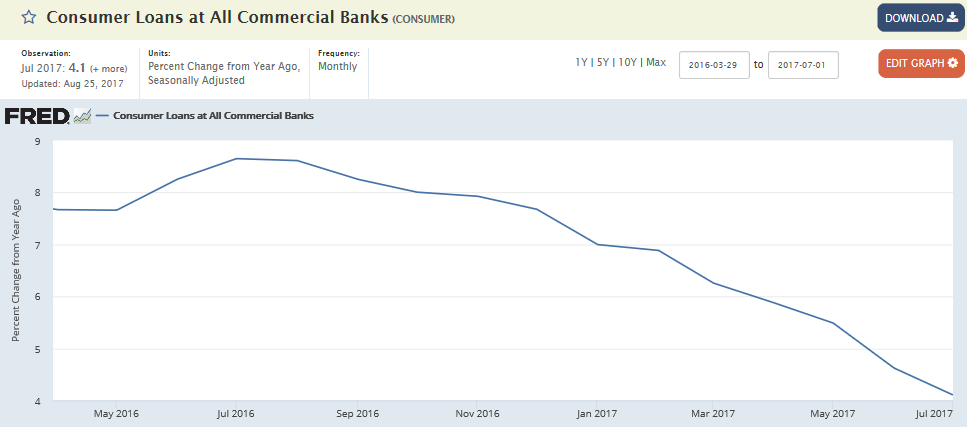
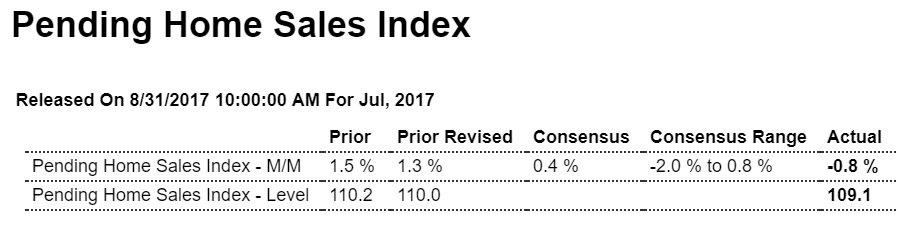
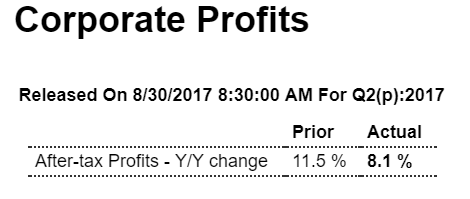
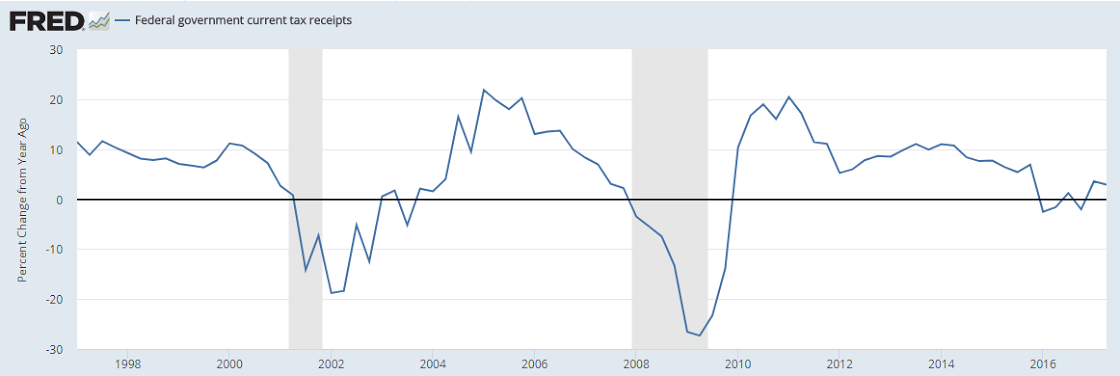
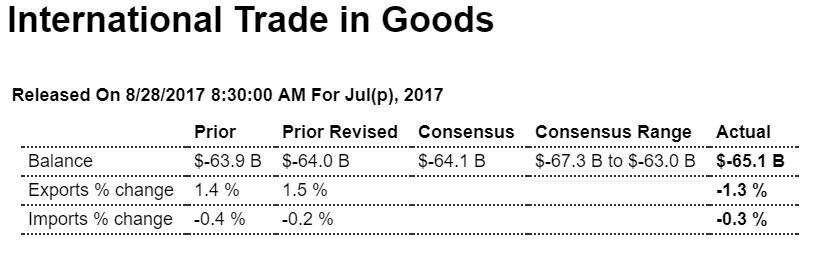
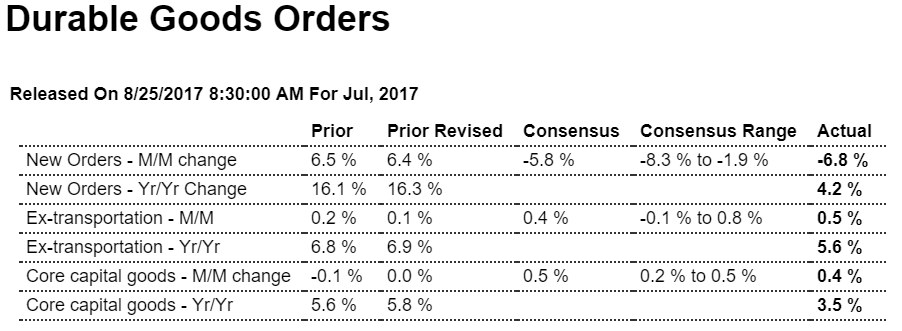
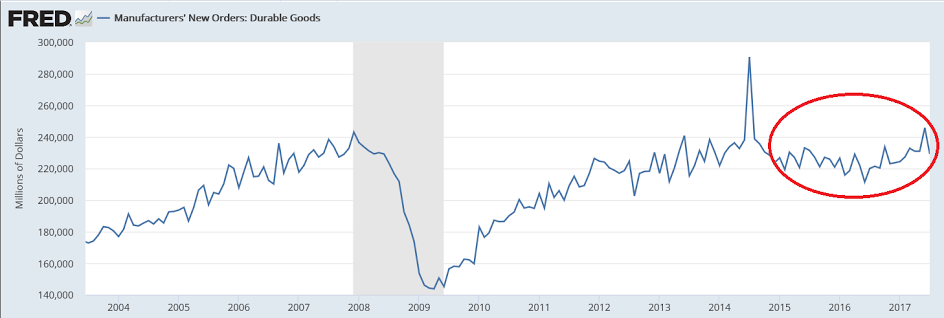
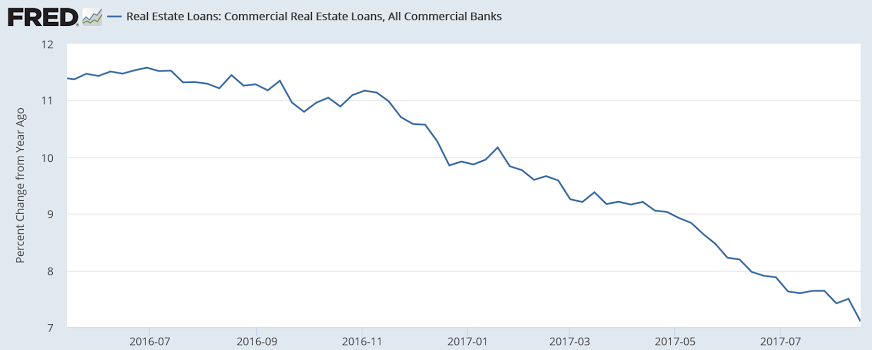
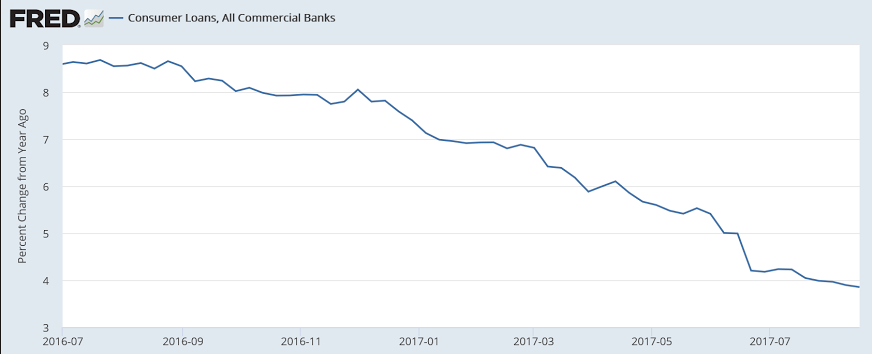
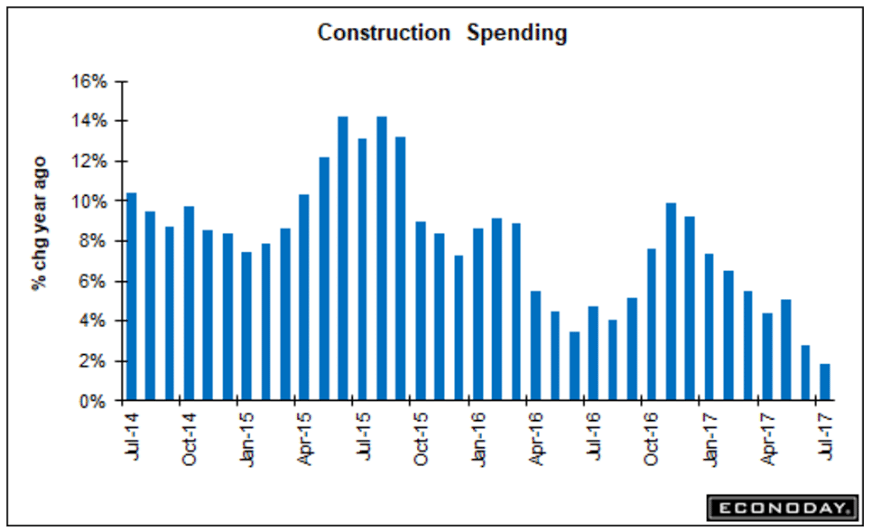
    Worse than expected as year over year growth continues to decelerate:
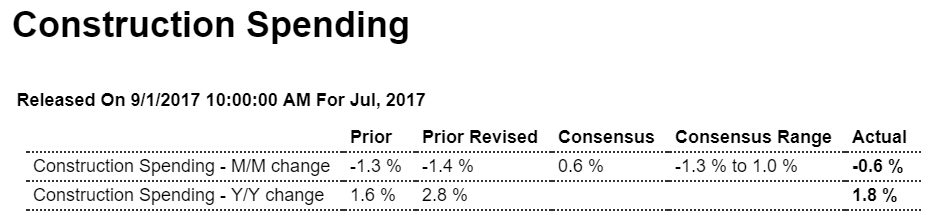
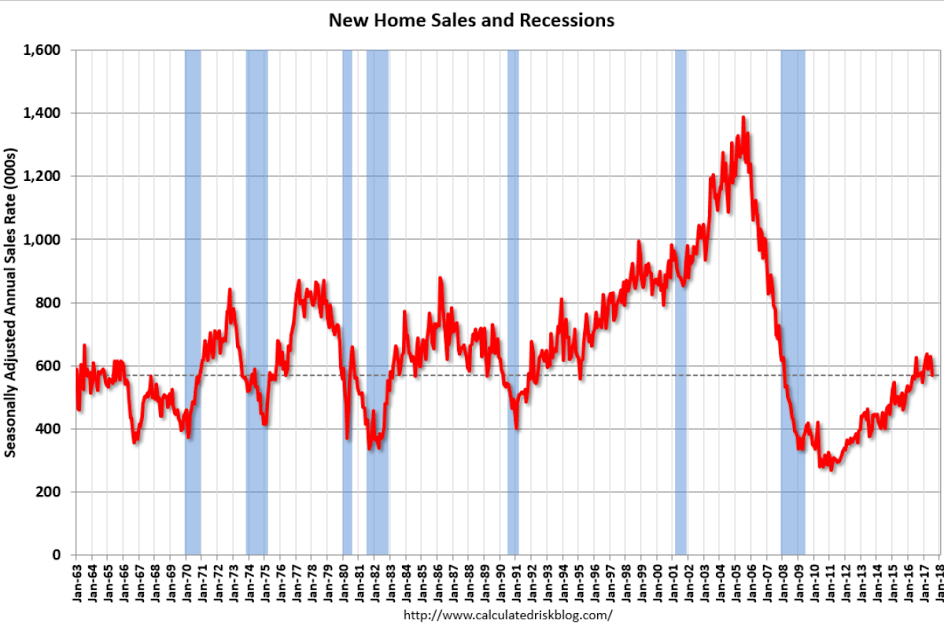
    Highlights

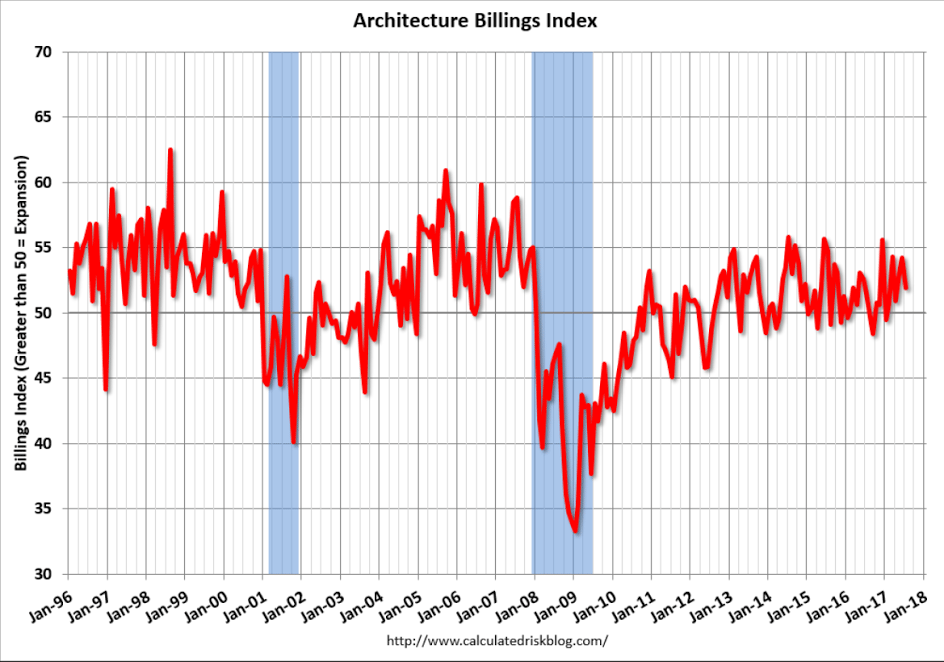
    Strength in residential building makes for a better construction spending report than indicated by the headline 0.6 percent July decline. Driven by single-family homes, residential construction rose a very solid 0.8 percent in the month for a year-on-year gain of 11.6 percent that contrasts markedly with the 1.8 percent overall rate. Home improvements, up 1.4 percent in the month, were also very strong. Spending on multi-family construction continues to moderate, down 0.8 percent in the month for only a 2.6 percent yearly gain.

    The real weakness in the report is on the nonresidential side where private spending, reflecting weakness across all components and especially commercial building, fell 1.9 percent for a yearly decline of 3.6 percent. Public building is likewise soft with the educational category down 4.4 percent in July.

    Though housing permits have been flat, the residential numbers in this report are solid. And strength for construction payrolls in this morning’s employment report might be hinting at better results for construction spending in the August report. Note that the unfolding effects from Hurricane Harvey will be difficult to gauge based on mixed results following prior hurricanes.


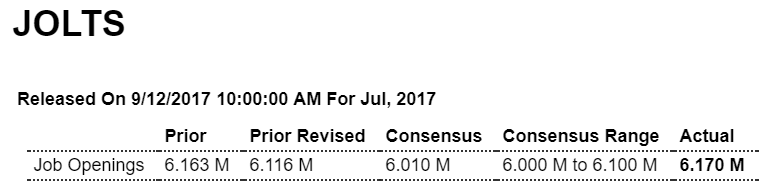
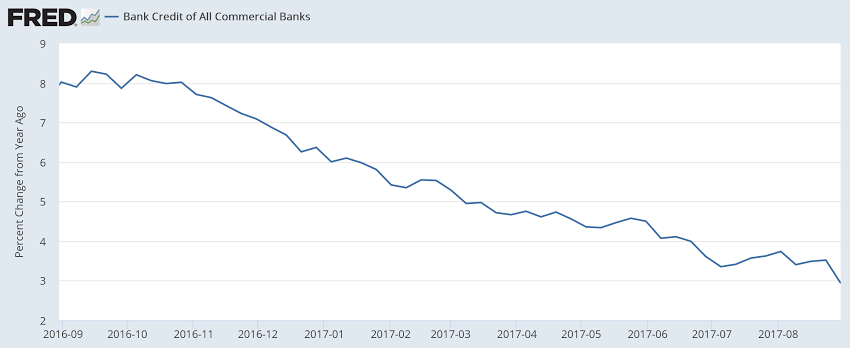
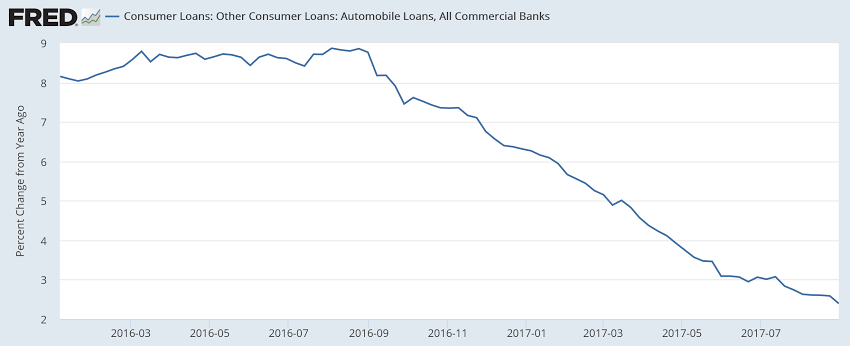
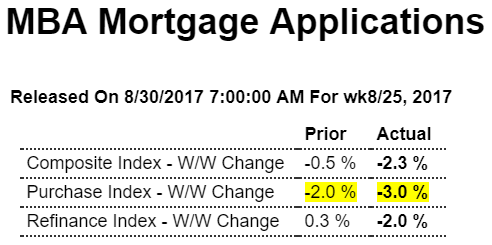
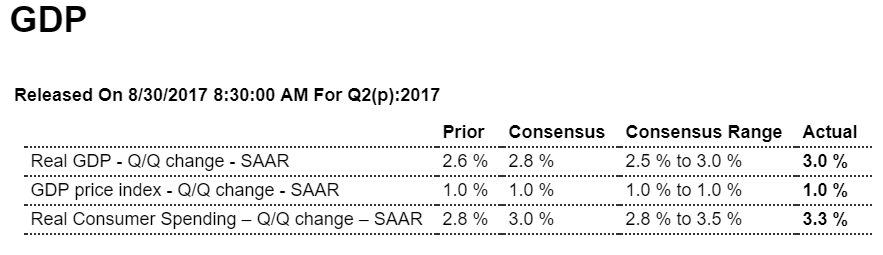
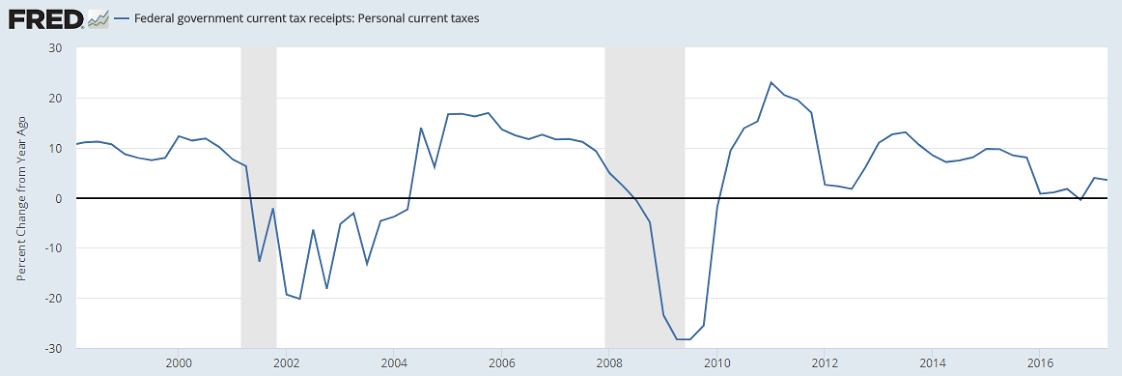
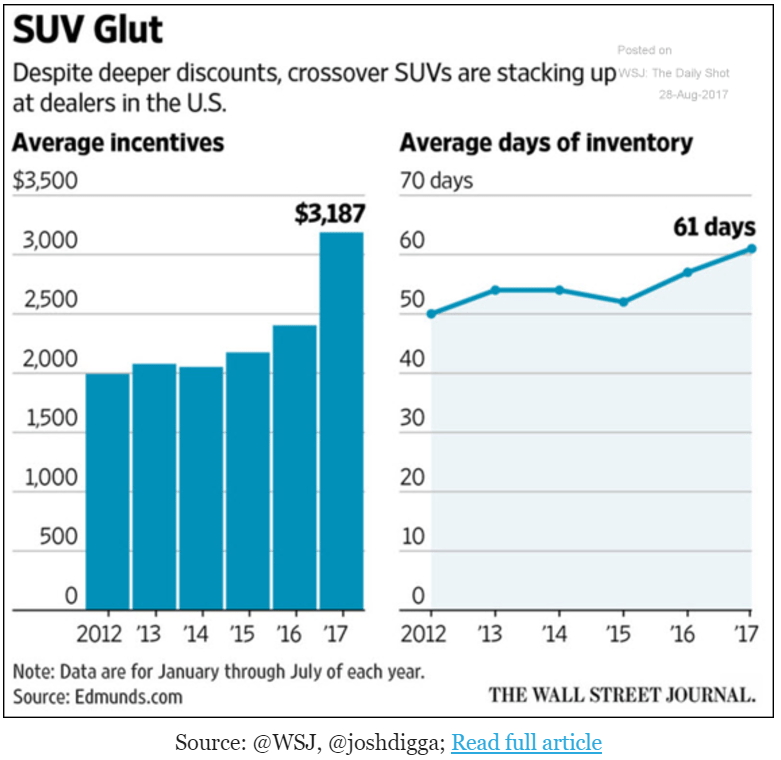
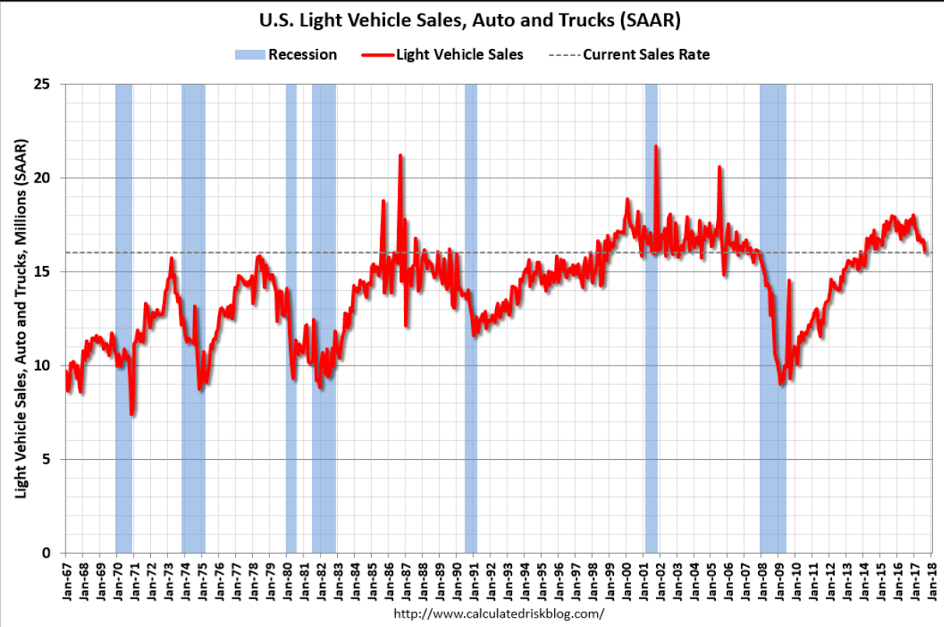
    A lot worse than expected:

    U.S. Light Vehicle Sales at 16 million annual rate in August

    Based on an estimate from WardsAuto, light vehicle sales were at a 16.03 million SAAR in August.

    That is down 6% from August 2016, and down 3.9% from last month.


    Read more at http://www.calculatedriskblog.com/#i7LI02KP7LwY0m6L.99

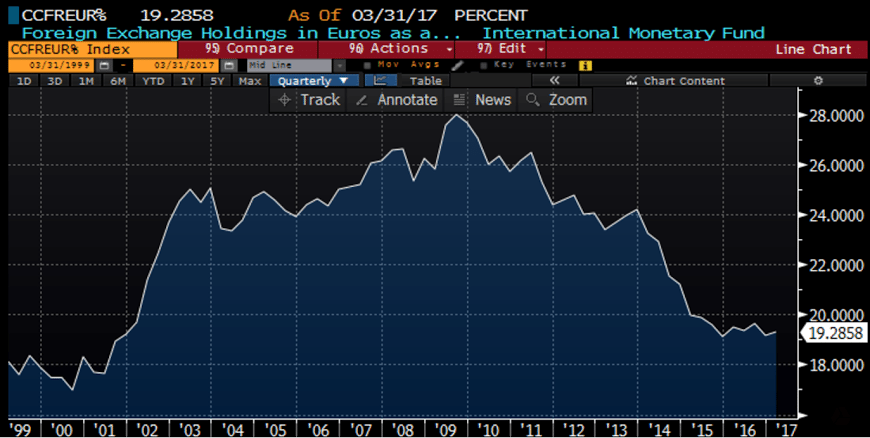
    Interesting headline- speaks to current level of credibility.

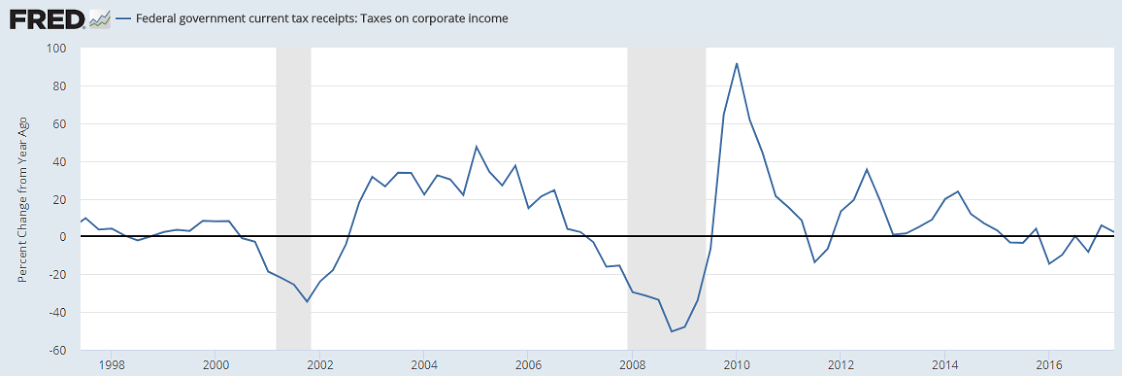
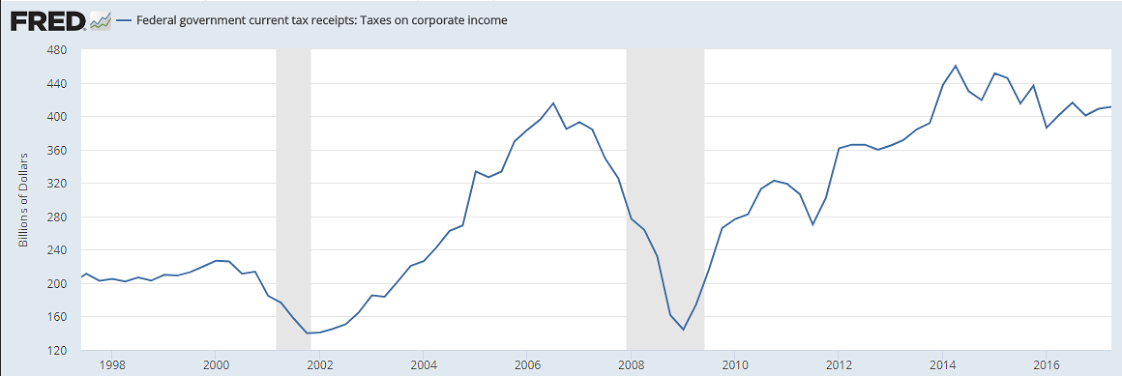
    Nor does anyone seem to understand what happens if the debt ceiling is hit, and, to the contrary, there are likely hundreds in Congress who believe going ‘cold turkey’ into a balanced budget is ultimately a very good thing to let happen. Fact is, curtailments of spending cause growth to slow, and tax receipts to fall. Under normal circumstances, that just means the Federal deficit is that much higher, which acts counter cyclically to moderate the slowdown. However, after hitting the debt ceiling, falling revenues automatically induce further spending cuts, as the by law the Federal deficit can’t be allowed to increase, which induces a further slowdown in GDP and, again, tax receipts fall further, and it all goes into an out of control collapse like nothing anyone’s ever seen before:

    Steve Mnuchin insists there is a tax plan (Axios) — U.S. Treasury Secretary Steve Mnuchin says that details should become publicly available by the end of September with a bill passed by year-end. Mnuchin says that President Trump is “absolutely committed to revenue neutrality” in the tax plan, but that only applies under the White House’s optimistic economic growth projections. Mnuchin reaffirmed that Sept. 29 is when the U.S. will reach the current debt ceiling, although says it could move a few days in either direction due to both Hurricane Harvey and Sept. 15 corporate tax receipts. He also reaffirmed his preference for a “clean” debt ceiling increase.

    Personal income and spending, Pending home sales

    Personal income growth remains weal as per the charts, which also showed a sharp drop in the personal savings rate, which generally forecasts reductions in spending:

    Highlights

    Vital signs for the consumer are strong but inflation is completely lifeless, based on a mixed personal income & outlays report for July. Income is the highlight, up 0.4 percent in the month including a second straight 0.5 percent gain for wages & salaries in what is an important and emerging sign of wage traction.

    Consumer spending rose 0.3 percent in the month, 1 tenth below expectations as spending on services managed only a 0.2 percent gain to offset strength for durables, up 0.6 percent, and non-durables, up 0.5 percent. The spending gain represents a moderate start for the major component of third-quarter GDP.

    Inflation readings, however, remain a major trouble spot, up only 0.1 percent both overall and for the core (less food & energy). Year-on-year rates are 1.4 percent both overall and for the core, the latter edging down 1 tenth in a result that won’t be raising the odds for the beginning of balance-sheet unwinding at September’s FOMC meeting.

    Employment is very strong and may finally be reflected in strength in wages, but gains here have yet to boost inflation readings which in this report are central to Federal Reserve policy. Nevertheless, the gain in income will put the focus on average hourly earnings for August in tomorrow’s employment report which, however, are not expected to show much strength.


    Below stall speed:


    Consumers are both dipping into savings to spend and slowing the growth of their borrowing as well- an historically unsustainable combination:

    Low personal income growth and a consumer that’s been spending out out of savings even as consumer credit growth slows can quickly translate into a further reduction of spending:


    Further confirmation of weakness in real estate sales:

    Highlights

    For the fourth time in five months the pending home sales index fell, down 0.8 percent in July to signal weakness for existing homes sales which have fallen in three of the last four reports. The regional breakdown shows the South, which is the largest housing region, falling 1.7 percent in the month with the West, at plus 0.6 percent, the only one in positive ground. Pending sales take about a month or two to close which points to trouble for both the August and also the September existing home sales reports. Housing opened the year with strength before fizzling during the Spring selling season and limping through the Summer months. Also note that Hurricane Harvey is certain to depress home sales in the South in coming housing reports.

    Mtg applications, GDP, Personal savings, Corporate profits, ADP employment, Federal tax reciepts

    Purchase applications were down again, as housing weakness reflects the drop in the growth of mortgage credit:

    Highlights

    Low mortgage rates are failing to entice home buyers, whose activity declined for the third straight week according to the Mortgage Bankers’ Association. Purchase applications for home mortgages fell a seasonally adjusted 3.0 percent in the August 25 week following 2 percent declines in the two prior weeks. Unadjusted, the purchase index decreased 5 percent from the prior week, taking it to a level only 4 percent higher than in the same week a year ago, well off the 8 plus percent gains seen in previous weeks this year. Applications for refinancing fell 2 percent from the prior week, with the refinance share of mortgage activity rising by 1.2 percentage points to 49.4 percent. The average interest rate on 30-year fixed rate mortgages ($424,100 or less) fell 1 basis point 4.11 percent, the lowest rate since November 2016. Three weeks of falling purchase applications is a worrisome development for the housing market, which may be accelerating its retreat from expansion highs, especially following the evidence of July weakness submitted in last week’s housing data, showing monthly declines in sales for both new and existing homes.

    So the question is, how is GDP coming in at 3% while credit growth has collapsed and personal income growth has evaporated as well? A partial answer may be the personal savings rate, which has not only gone down, but total net personal savings seems to have declined as well. This is most likely unsustainable, and likely to very quickly translate into a further substantial decline in personal spending.

    Also, prices pressures were very weak, indicating low demand, which seems contradictory. But close examination shows health care premiums for various private plans, which count as personal consumption, were up by 25%, and utility bills were high as well, leaving less for spending on other goods and services:

    Highlights

    The second-quarter proved to be very solid, revised 4 tenths higher in the second estimate to a 3.0 percent annualized rate. And strength is centered where it must be as consumer spending is now at a 3.3 percent rate for a 5 tenths upward revision.

    Non-residential investment was also a positive, at a 6.9 percent rate following the prior quarter’s 7.2 percent showing. Residential investment, however, was a drag on the second quarter, at a negative 6.5 percent rate that followed a positive 11.1 percent rate in the first quarter. Government purchases were negative for a second straight quarter, at minus 0.3 percent following a minus 0.6 percent first-quarter showing. Both second-quarter net exports and inventories were slightly positive.

    But prices were very weak in the quarter, at a 1.0 percent rate overall and 1.1 percent for the core. Inflation aside, the second quarter marked a solid though not exceptional reversal of the first quarter’s 1.2 percent pace and points to constructive momentum going into the third quarter.

    The increased cost of health insurance is a central fact in any discussion of health policy and health delivery. Annual premiums reached $18,142 in 2016 for an average family, up 3 percent from 2015, with workers on average paying $5,277 towards the cost of their coverage.* For those Americans who are fully-covered, these cost realities affect employers, both large and small, plus the “pocket-book impact” on ordinary families. Yet for those buying insurance on an exchange or private market plan for 2017, the average increase before subsidies was a shocking 25 percent. For 2016 among the roughly 85 percent of HealthCare.gov consumers with premium tax credits, the average monthly net premium increased just $4, or 4 percent, from 2015 to 2016, according to an HHS report.

    * Figures reported by Kaiser Employer Survey, 9/2016, apply to employer-based insurance.
    http://www.ncsl.org/research/health/health-insurance-premiums.aspx


    Yes, the growth rate is reasonable, but it’s currently measured from the dip that took place after oil capex collapsed. Total profits are now only back to where they’ve been for quite a while and have most recently flattened out:

    Highlights

    Corporate profits rose 8.1 percent year-on-year in second-quarter 2017 to an annualized $1.785.9 trillion from $1.652.1 trillion in second-quarter 2016. Profits are after tax without inventory valuation or capital consumption adjustments.

    Highlights

    ADP is calling for a 237,000 rise in August private payrolls for Friday’s employment report where Econoday’s consensus is 179,000. ADP’s predictive accuracy has been on-and-off this year with their call for July, at an initial 178,000 which is now revised to 201,000, well below the actual 205,000.

    Looks to be slowing as well:

    Trade, SUV’s, Redbook retail sales, Trump and Harvey

    No ‘improvement’ here:

    Highlights

    Third-quarter GDP is off to a slow start, at least for international trade in goods where the July trade gap widened more than $1 billion to $65.1 billion. Exports fell 1.3 percent and were pulled down by a sharp fall in vehicles and also consumer goods which are two weak categories for the US. Helping to ease the effect of exports was a 0.3 percent decline in imports where foreign vehicles, which are usually in strong demand, fell 2.8 percent while industrial supplies were down 1.7 percent. July’s trade report including services will be posted next week.


    Definitely looking up, but, again, might be due to fewer stores?

    Durable goods orders, Vehicle sales, Credit check

    Nothing impressing me here, as per the chart:

    Highlights

    Durable goods orders came in as billed with a steep aircraft-related decline for the headline, at minus 6.8 percent, contrasting with solid gains for ex-transportation at 0.5 percent and core capital goods (nondefense ex-aircraft) at 0.4 percent. A special plus in the report, and one that will lift GDP, is a sharp pickup in shipments of core capital goods, up 1.0 percent in July with June revised 2 tenths higher to 0.6 percent.

    Total shipments rose 0.4 percent with inventories keeping a balanced pace, up 0.3 percent. A negative in the report is a 0.3 percent decline in unfilled orders that follows, however, June’s 1.3 percent surge.

    For aircraft, which has picked up this year, orders fell 82 percent in July vs June’s enormous 227 percent jump. Orders for defense aircraft, up nearly 50 percent, are a positive in July’s data as is electrical equipment, up 2.6 percent in a good sign for construction. Computers and fabricated metals also show gains. Negatives include a 1.2 percent order decline for vehicles that follows a 0.7 percent decline in June and a 1.4 percent decline for machinery orders that belies the month’s strength for core capital goods.

    But positives are definitely the theme of today’s report, one that helps offset last week’s unexpected decline in manufacturing production and supports the enormous strength being signaled by advance regional reports. The economy may very well get a solid second-half boost from what has been an improving factory sector.

    Nothing good here either:

    From WardsAuto: Forecast: U.S. Auto Market Continues Downward Trend in August

    A WardsAuto forecast calls for U.S. automakers to deliver 1.51 million light vehicles in August. … The report puts the seasonally adjusted annual rate of sales for August at 16.5 million units, below the 17.1 million SAAR in same-month 2016 and 16.7 million in prior-month 2017.

    Light-vehicle inventory stood at 3.86 million units at the end of July, up 9.4% from year-ago and about 15% higher than necessary with current sales rates. The streak of record-high stock is expected to continue with 3.8 million units at the end of August, 7.5% greater than same-month 2016. This will leave automakers with a 69 days’ supply, same as prior-month, but well above year-ago’s 62. Slowdowns in production and higher sales incentives through September are expected to narrow the gap between supply and demand.

    Read more at http://www.calculatedriskblog.com/#oMiQuZGzVghgXYBq.99

    With each data release it seems more likely to me that the deceleration in the growth of borrowing from the banks is reflecting a drop in aggregate demand:

    Growth of C and I loans has been near 0 since the election:


    Loans create deposits, so here it is from a segment of the deposit side. M2 includes M1 which is directly affected by the size of the Fed’s portfolio and QE, however those variables have been largely unchanged for the time period of this chart:

    Tax proposals, New home sales, PMI surveys, Architecture Billings Index

    Seems to me the highlighted proposals will reduce spending more than the cut in tax rates will increase spending:

    Trump’s team and lawmakers making strides on tax reform plan

    Aug 22 (Politico) — President Trump’s top aides and congressional leaders have made significant strides in shaping a tax overhaul. There is broad consensus on some of the best ways to pay for cutting both the individual and corporate tax rates. The options include capping the mortgage interest deduction for homeowners; scrapping people’s ability to deduct state and local taxes; and eliminating businesses’ ability to deduct interest, while also phasing in so-called full expensing for small businesses that allows them to immediately deduct investments like new equipment or facilities. One idea would be taxing the money that workers place into their 401(k) savings plans up front.

    Weak, inline with permits and decelerating mortgage credit growth:

    Highlights

    Overstating weakness, July’s headline for new home sales fell to a far lower-than-expected annualized rate of 571,000. This is offset, however, by upward revisions totaling 33,000 in the two prior months which now stand at 630,000 and 618,000. This series, where sample sizes are low, is often volatile month-to-month with the 3-month average, still over 600,000 and just off expansion highs, telling the more reliable story.

    The best news in July’s report is an increase in supply, up 4,000 to 276,000 new homes on the market. Relative to sales, supply moves from 5.2 months to 5.8 months which is nearly at the 6 month mark which is widely considered to be balanced for new homes.

    Prices are showing increasing traction, up 0.7 percent in the month to a median $313,700. This is up 6.3 percent year-on-year which is roughly in line with prices of existing homes.

    The strength in pricing is good news for residential investment but not for first-time buyers who are being priced out of the new home market. The downdraft in July’s data aside, new homes are probably still a positive for the housing sector which has been trending higher in fits and starts all year. Watch tomorrow for existing home sales where strength is the expectation.


    Today’s survey information:

    Highlights

    Weakness in manufacturing, at 52.5, is being offset this month by strength in services, at a very strong score of 56.9. The two make for a PMI composite of 56.0. New orders for the services sample are at a 2-year high with hiring also very strong. Input costs for service providers are up as are, in especially positive news, selling prices which are at a nearly 3-year high.

    Selling prices for manufacturers are also higher this month with input costs also up. Order growth, however, is slowing as is production. Inventory build is also slowing.

    These results are mixed with the slowdown in manufacturing a concern especially following last week’s surprise dip in manufacturing production.


    Down a bit, low and going nowhere:

    House prices, Redbook retail sales, NY Fed survey

    Home prices may be softening, but too soon to tell:

    Highlights

    The FHFA house price index came in at a very soft 0.1 percent increase in June, well short of Econoday’s consensus for 0.5 percent and low estimate of 0.3 percent. This is both good news and bad news, as slowing price appreciation should help affordability for home sales but will also limit growth in household wealth. Despite June’s weakness, year-on-year prices remain very strong, at plus 6.5 percent which is nearly a percentage point above Case-Shiller’s data. Watch on next week’s calendar for June data from Case-Shiller.


    This has definitely come back from the lows, though there are likely fewer stores reporting, and this series is not adjusted for inflation:

    U.S. workers have low hopes for higher pay

    Aug 21 (Reuters) — A New York Fed survey found that on average respondents said in July that the lowest annual salary they would accept in a new job would be $57,960, down from $59,660 only four months earlier. Asked what salary they expected in job offers over the next four months, the average response declined to $50,790 from $54,590 when the last survey was taken in March. The survey also showed 22.7 percent of respondents searched for a job in the last four wees, up from 19.4 percent in the previous report. The respondents saw a 22 percent likelihood of receiving at least one job offer in the next four months, down from an average response of 25 percent eight months ago.