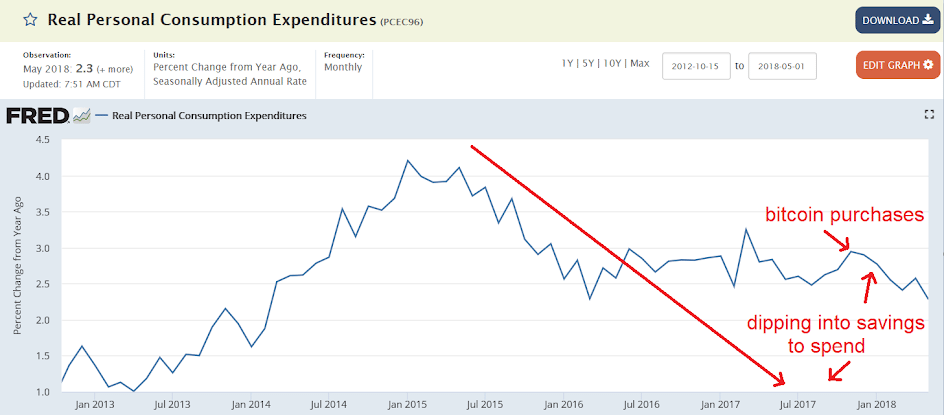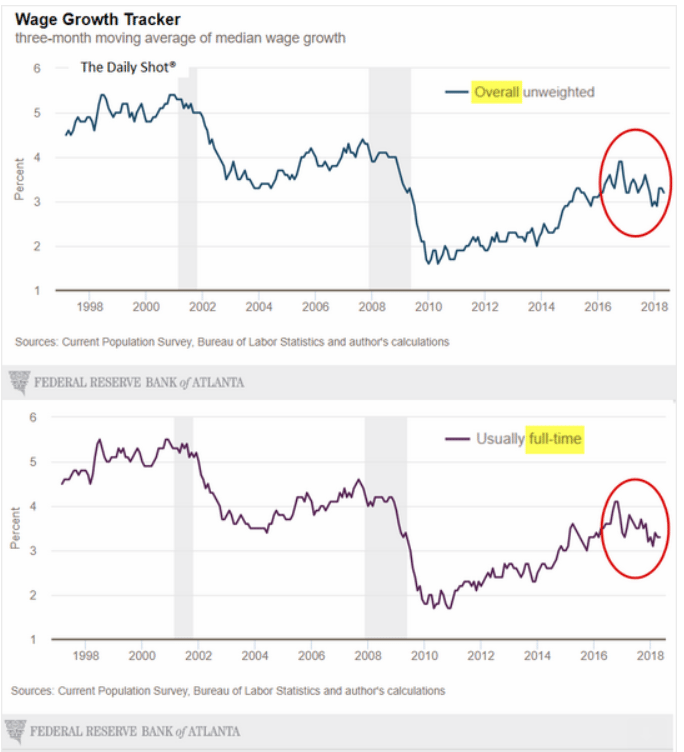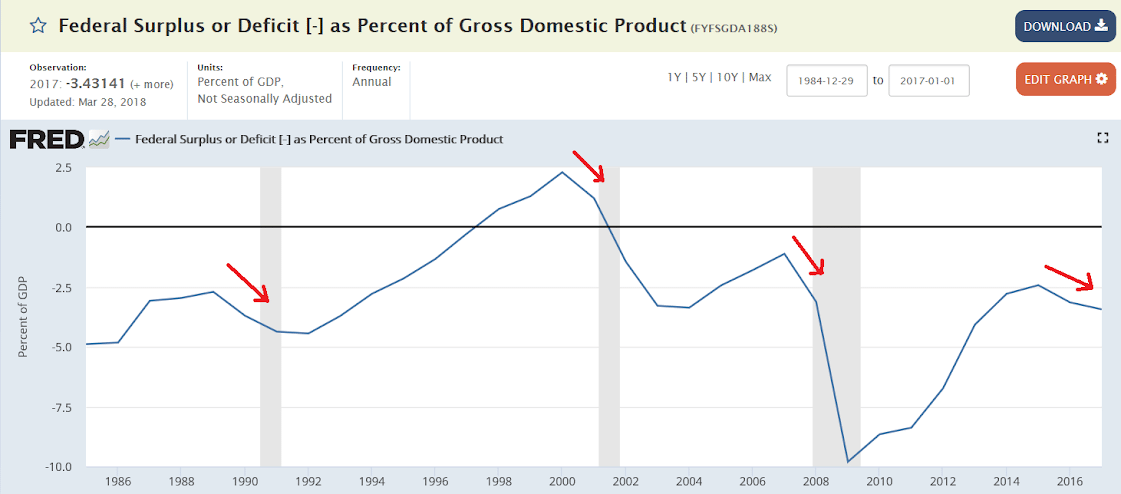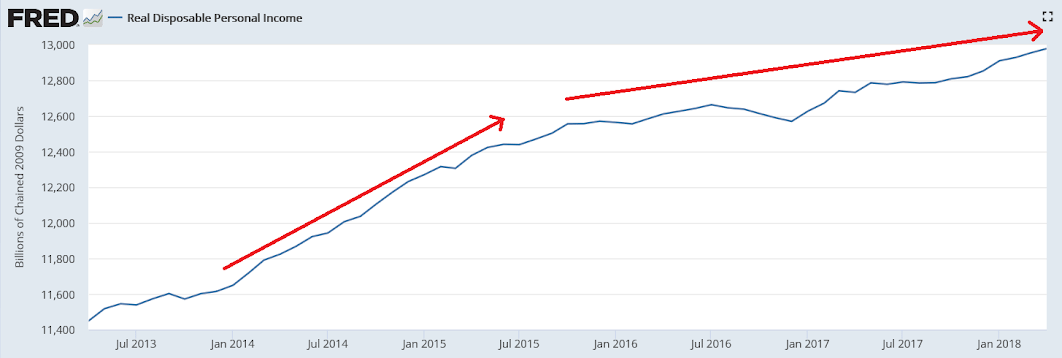
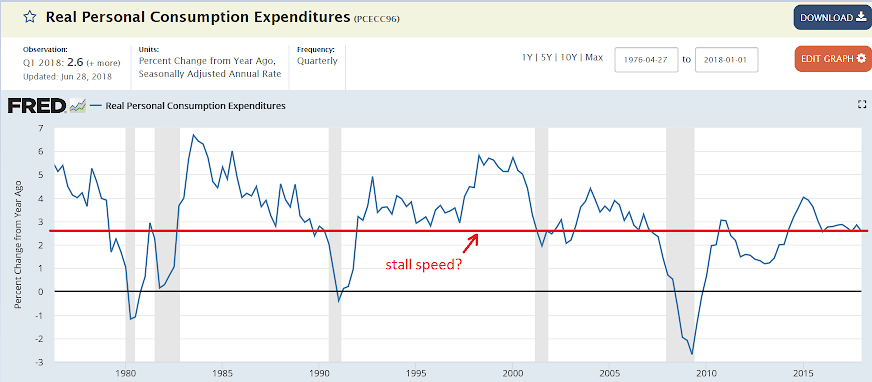
The above are quarterly from GDP data. Today’s release is monthly, and, as suggested by the far too low personal savings rate, consumption was revised down a bit and has come in lower this month. However, income was also revised lower, with wage income growth weak even with the reported employment growth, keeping the savings rate remains depressed. And with prices a bit higher it means real consumption and income are that much lower. Also, note how the inflation rates tend to move higher after Fed rate hikes… ;)
Highlights
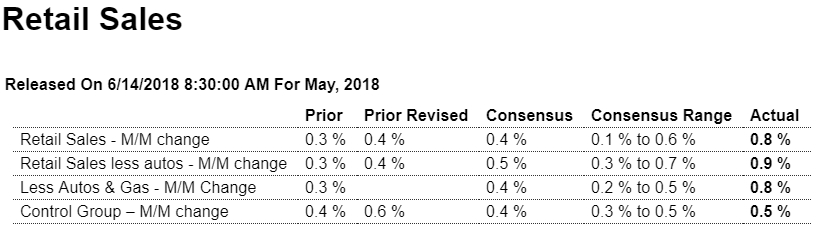
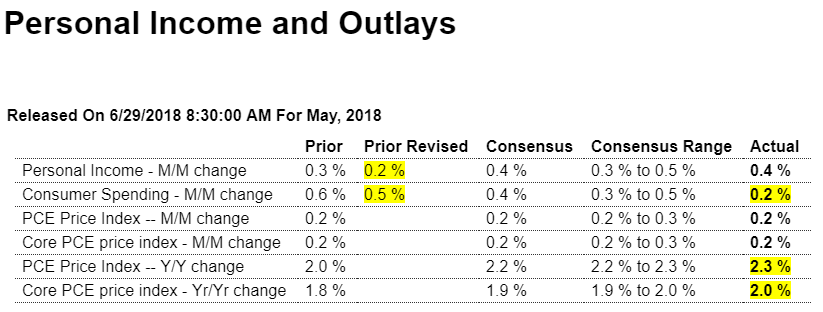
Personal income and outlays is usually an easy report to forecast, but not May’s edition. The most important surprise is the core PCE price index which rose 0.2 percent on the month, which hits expectations, but jumped 2 tenths on the year to 2.0 percent. This hits the high end of Econoday’s consensus range and also hits the Federal Reserve price target — inflation is now where the Fed wants it and this means less need to stimulate the economy.
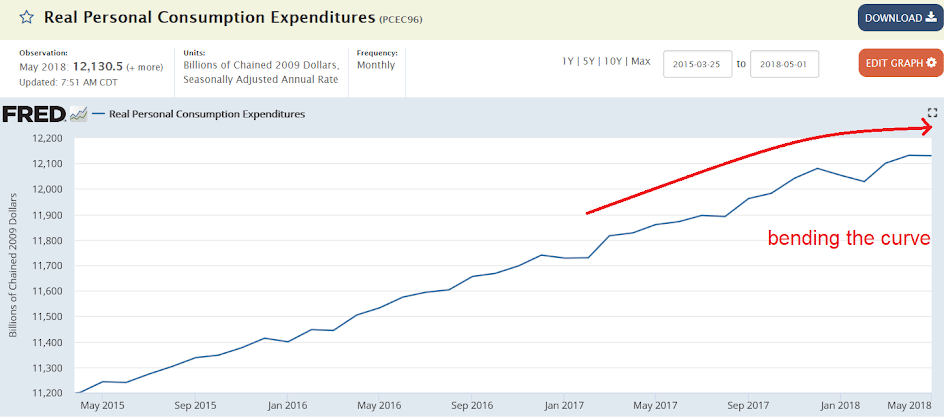
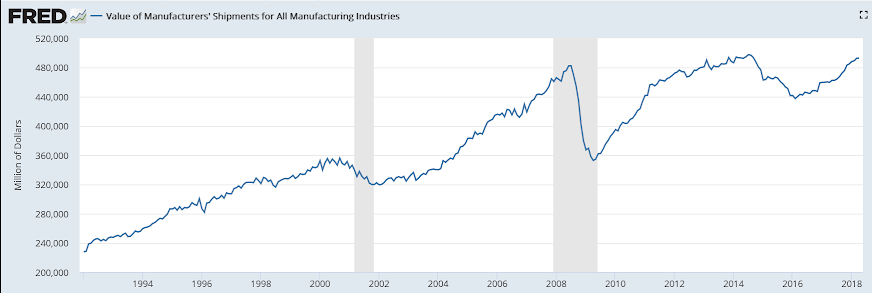
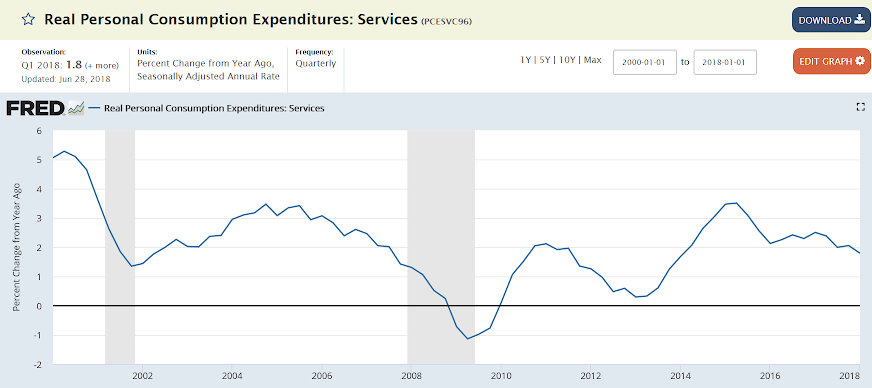
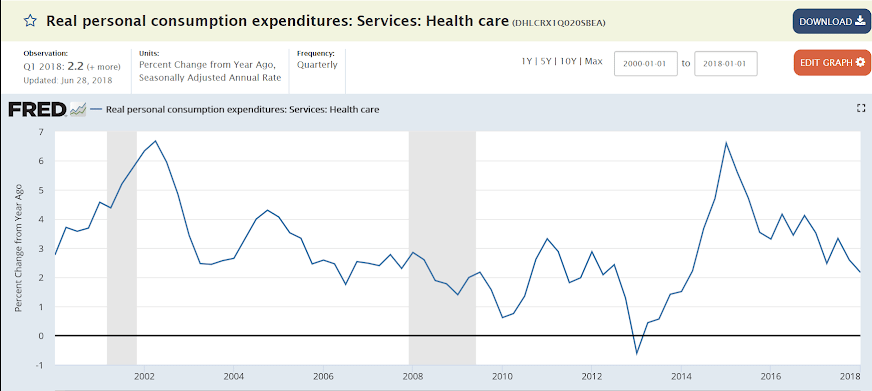
Spending is the other surprise, rising only 0.2 percent in the month which is below low-end expectations and is not consistent with the FOMC’s verdict at mid-month that consumer spending was “picking up.” The unwelcome surprise here is in service spending which rose only 0.1 percent vs a 0.6 percent rise in nondurables, here reflecting price strength in energy, and only a 0.1 percent rise for durable goods. This latter reading isn’t what was expected following strength in the previously reported retail sales report for June. These results point to a knock down for second-quarter GDP estimates, making outside calls for a 5 percent quarter history.
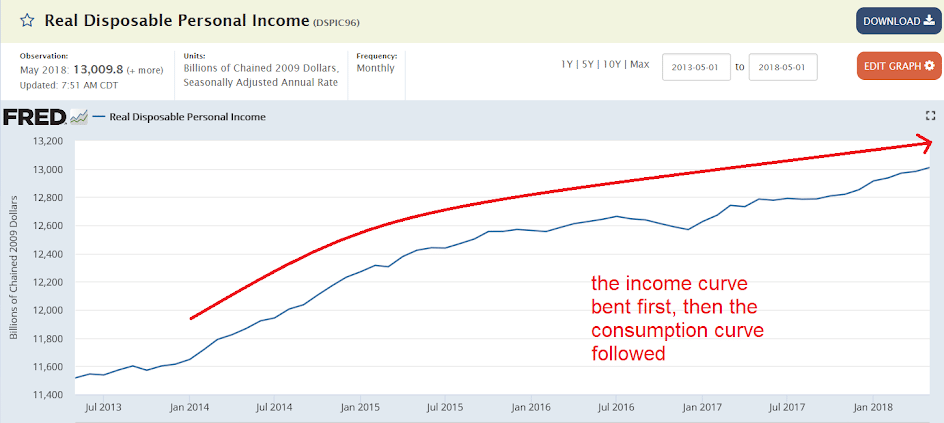
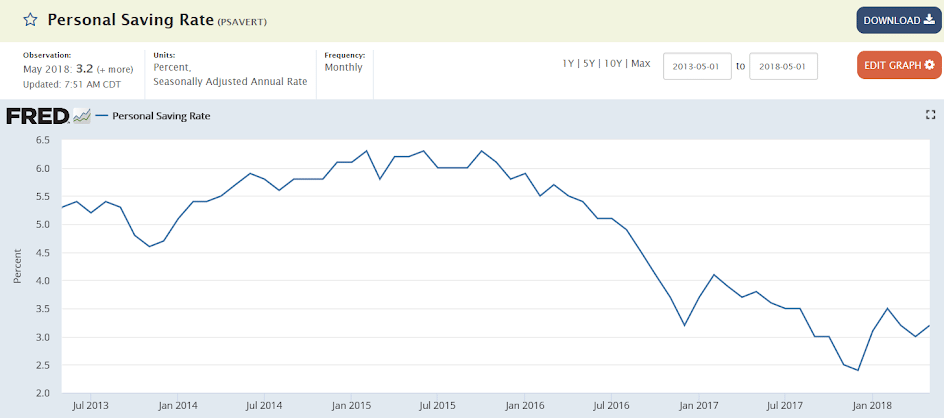
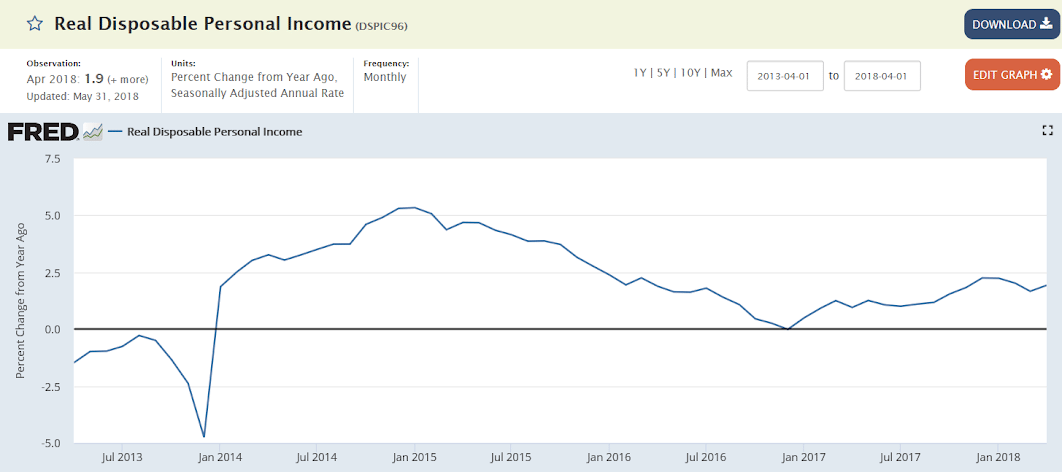
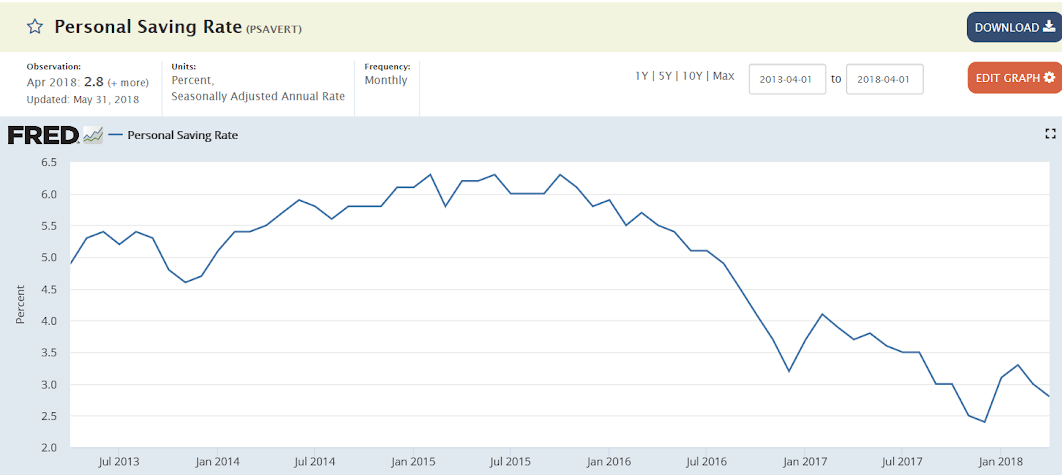
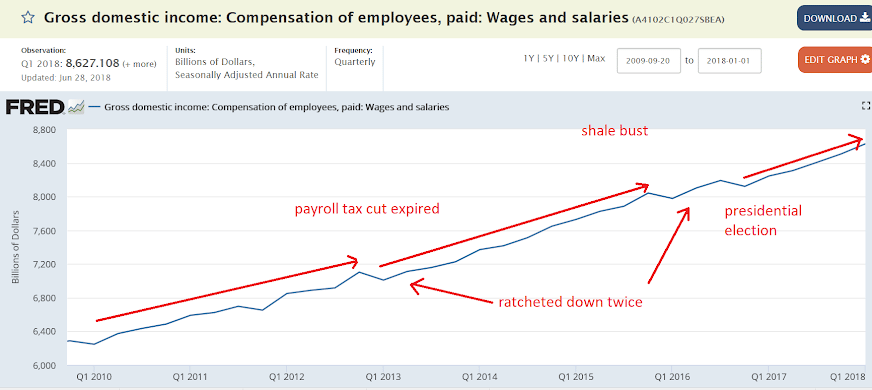
Income is respectable in the report, up 0.4 percent as expected and including a second straight moderate rise of 0.3 percent in the wages & salaries component. Good news comes from the savings rate which rose 2 tenths to 3.2 percent and offers some explanation for the weakness in spending.
Turning back to inflation, the overall price index also rose 0.2 percent like the core but this year-on-year rate, reflecting high energy prices, is up 3 tenths and is over target at 2.3 percent.
This report marks a pivot for the Fed which now, as it has been signaling, will begin focusing on the upside of its “symmetric” inflation goal, that is protecting against an unwanted acceleration in prices. And that means, soft consumer spending or not, rate hikes to come.