Can the American Wind Energy Industry Survive Without the PTC?
Production tax credit expired after 2013 (renewed for a year in 2012). This was the first year that they added a provision extending the credit to any production started before 2014, in previous years they had to be completed by the year end. This caused a jump in new projects at year’s end.
Category Archives: Uncategorized
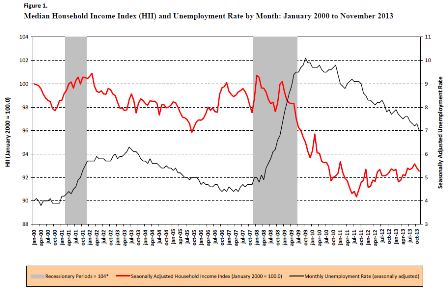
median household income
Factory orders and ISM non manufacturing releases
First, factory orders
Always boring
;)
Factory Orders
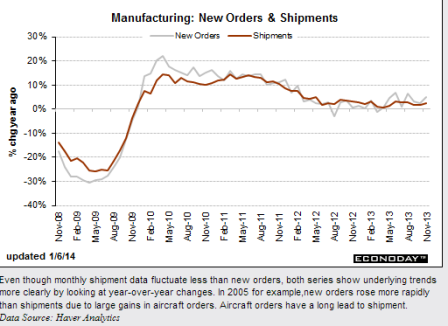
Solid domestic demand together with solid foreign markets appear to be giving a lift to the factory sector with factory orders up a very strong 1.8 percent in November. Another plus is a 4 tenths upward revision to October, to minus 0.5 percent. September orders are unrevised and very strong at plus 1.8 percent like November.
Excluding transportation, orders rose 0.6 percent in November vs an upward revised 0.1 percent gain in October. Orders for capital goods show a big surge, possibly boosted by year-end tax issues but also perhaps by rising business confidence.
Shipments were very strong in November, up 1.0 percent following incremental 0.1 percent gains in the two prior months. And there seems to be no risk of inventory overhang as inventories were unchanged to bring down the inventory/shipments ratio to 1.28 from 1.29.
Unfilled orders are a special plus, jumping 1.0 percent for an 8th straight gain. Last week’s ISM report, boosted by strength in construction-related and auto-related industries, points to another strong month in December for manufacturing which is once again a leading strength for the nation’s economy.
Full size image
ISM non manufacturing
Always more interesting
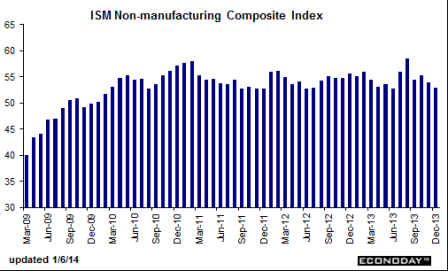
Downward slope since the peak a few months back has continued
Enough said…
New orders moved suddenly into reverse for ISM’s non-manufacturing sample, pulling down the index which fell 9 tenths to 53.0. New orders, the leading indicator in this report, fell to 49.4 from 56.4 in November. This is the first sub-50 reading for new orders, which had been especially strong through much of the second half of last year, since July 2009.
But coincidental and lagging indications are positive including a steady reading for business activity and a big bounce back for employment, up 3.3 points to 55.8.
Other readings include a second straight contraction for backlog orders, a slight rise for input price pressures, and a slowing in export orders.
Today’s employment reading may lift expectations for Friday’s employment report but otherwise the report hints at an early 2014 slowdown for the economy.
Full size image
Jack Lew to press Germany on domestic demand
Wrong, Jack, press for domestic demand HERE(tax cut and/or spending increase)
It’s called optimizing real terms of trade. What you are doing is subversive!
Jack Lew to press Germany to boost domestic demand
Car sales missing
Averaging October’s govt shutdown reduced report with November’s bounce back approx = today’s Dec releases. So levelish sales for the quarter, and a leveling off in general post Jan tax hikes vs a prior multi year upward slope.
* GM, Ford, Toyota, Chrysler December U.S. sales all miss
* Ford sales up 2 percent
* GM sales down 6 percent
* Toyota sales down 1.7 percent
* Chrysler sales up 6 percent
By Bernie Woodall and Ben Klayman
DETROIT, Jan 3 (Reuters) – The top four automakers in the U.S. market missed December sales expectations, but 2013 will still easily be the best year for the industry since before the recession.
General Motors Co said that the U.S. auto industry will have December U.S. auto sales at a 15.6 million-vehicle annualized selling rate, well below the 16 million vehicles expected by 27 economists surveyed by Thomson Reuters.
The late December holiday season is generally one of the heaviest sales periods at U.S. auto dealerships.
Sales that may have occurred in December were pulled ahead to November because of a late-month, four-day Thanksgiving weekend, said John Felice, head of sales at Ford Motor Co.
December auto sales were also hampered by snowy and icy weather over parts of the country late in the month, said Chrysler spokesman Ralph Kisiel.
Each month, auto sales are seen as an early indicator of consumer spending.
For all of 2013, U.S. auto sales are expected to finish near 15.6 million vehicles, up about 8 percent.
That would be the best sales year since pre-recession 2007, when 16.1 million vehicles were sold in the U.S. market. At the height of the recession in 2009 sales fell to 10.4 million.
GM’s sales fell 6 percent, to 230,157 new vehicles, below analysts’ expectations of a slight sales gain.
Sales of GM’s Chevrolet Silverado pickup truck fell 16 percent in the month.
Ford’s sales rose 2 percent, to 218,058, also below analysts’ expectations. Its F-Series pickup truck, the best-selling model in North America, had an 8 percent sales gain in December.
Toyota’s U.S. December sales fell 1.7 percent to 190,843 vehicles, versus expectations of a slight gain.
Chrysler expects the industry to show a December annualized selling rate of 15.8 million vehicles.
Chicago PMI
Highlights
Growth slowed this month in the Chicago economy but from unsustainably high rates of growth in November and October. The Chicago PMI slowed to 59.1 vs 63.0 and 65.9 in the two prior months. Aside from November and October, the December reading is the best since March last year.
Order growth is strong but did slow with new orders at 60.7, down from 68.8 and 74.3 in the two prior months but still above September’s 58.9. This are all very strong rates of monthly growth for new orders which have been on the plus 50 side to show growth every month since November last year. And backlog orders are piling up, at 58.3 for a 3rd straight monthly build.
Employment is a special weakness in the December report, at 51.6 and not much above 50 to signal only modest monthly growth. This is the softest reading for this index since April.
Other readings include a strong though slowing rate of production, steady and moderate price pressures for raw materials, and a sharp slowing in deliveries that may point to the emergence of capacity constraints in the supply chain. In a plus, inventories, where high levels are a concern for the 4th quarter, fell sharply in the month.
This report, which covers all areas of the Chicago economy, points to another month of solid mid-50s growth for the coming ISM reports on manufacturing and non-manufacturing. The Dow is moving off opening highs following today’s report.
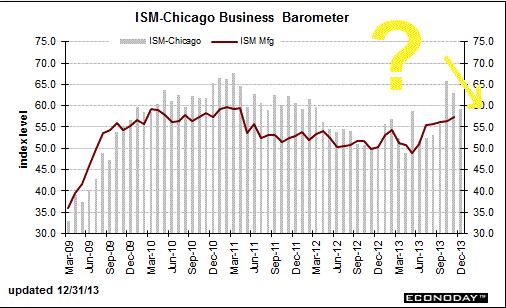
today’s releases- Happy Holidays to All!!!
This release along with the Chicago Fed report that November housing starts were down, and anecdotal evidence from home builder reports and various mortgage originators seems to indicate the reported 22% jump in November housing starts reported last week is at best subject to downward revision.
MBA Purchase Applications

Highlights
The rise in mortgage rates, this time following the Fed’s decision to begin tapering stimulus, is increasingly reducing mortgage activity. The purchase index fell 4.0 percent in the December 20 week for a year-on-year decrease of 11.0 percent, tangible contraction that underscores the importance of all-cash buyers in the home market.
The rise in mortgage rates is also sharply reducing refinancing activity with the refinance index down 8.0 percent in the week to its lowest level of the recovery. The average rate for conforming mortgages ($417,500 or less) rose 2 basis points in the week to 4.64 percent.
MBA Purchase Applications, Y/Y and level:
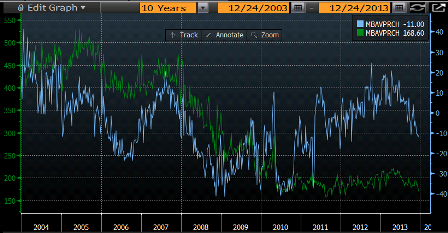
Full size image
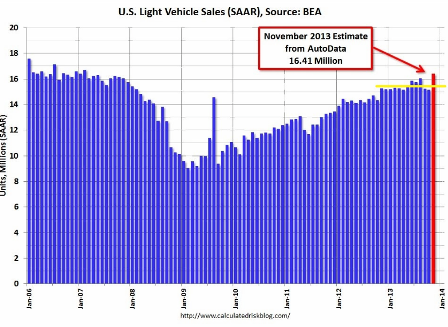
Durables were up nicely as per yesterday’s release as well, with a boost from November’s elevated vehicle sales rate of 16.4 million units. But December car sales are currently forecast to be down to about a 15.5-16 million pace, vs month’s 16.4 million and October’s govt shutdown limited 15.2 million. This also brings the year over year growth rate down to maybe 4% as things flattened out in 2013 from higher prior growth rates. Also, as you can see from the chart, durables don’t tell you much about what might happen next. For example, we had about the same increase in Q1 2008:
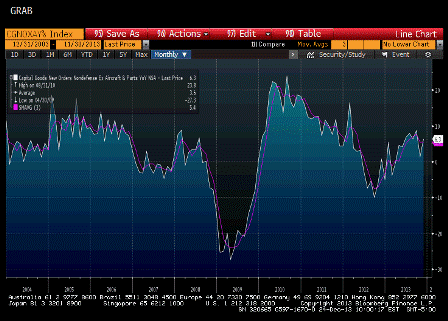
Full size image
And the Capital goods non defense ex aircraft year over year chart speaks for itself as well:
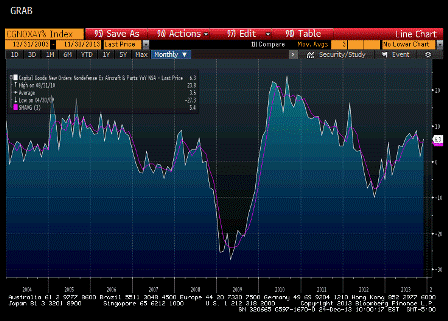
Full size image
New home sales also just out, with a whopping upward 120,000 revision to last month causing today’s initial November print to be down tic. Seems it’s going to take a few more months of releases and revisions to see what’s actually been happening.


Full size image
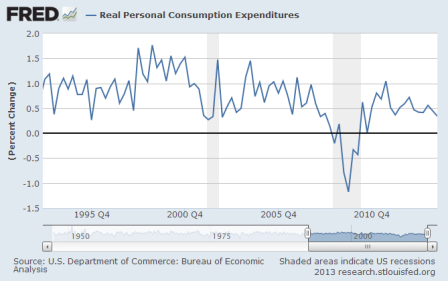
the resilient consumer
Headline retail sales with 3 mo moving average indicated, claims
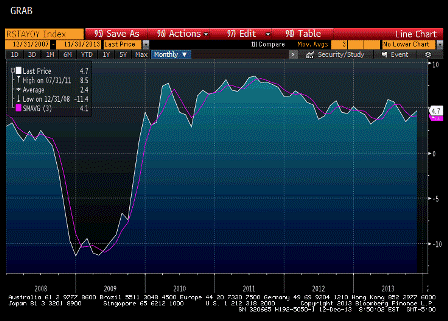
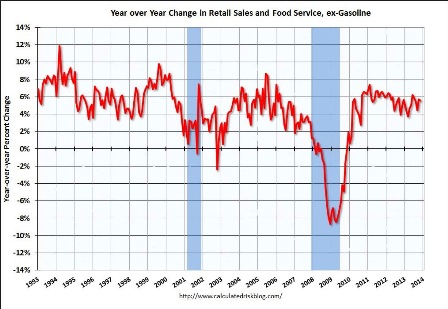
Looks like the general drift to lower growth rates may still be in progress.
Headline retail sales year-over-year with 3 mo moving average:
Full size image
Longer term chart:
Full size image
And auto sales chart shows how they sagged during the October govt. shutdown with lost sales subsequently recovered, but on balance relatively flat for 2013:
Full size image
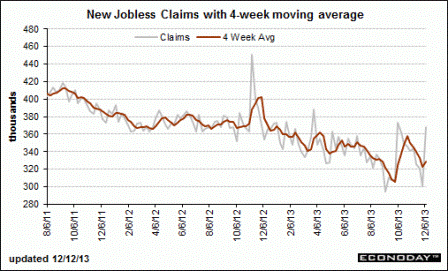
Lots of noise in claims data this time of year, but, again, claims are about separations, not new hires, though correlation has been pretty good:
Full size image

