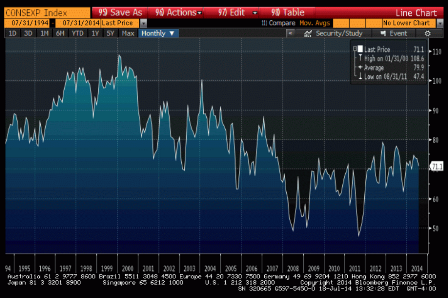
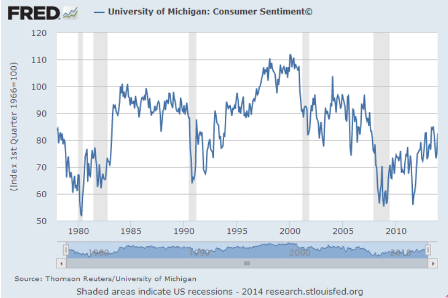
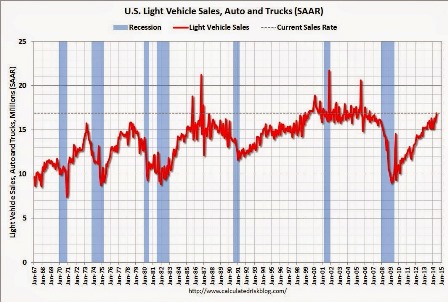
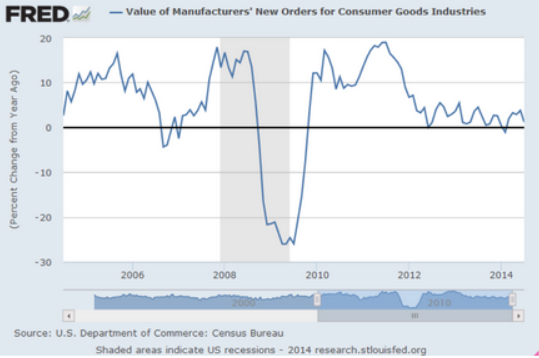
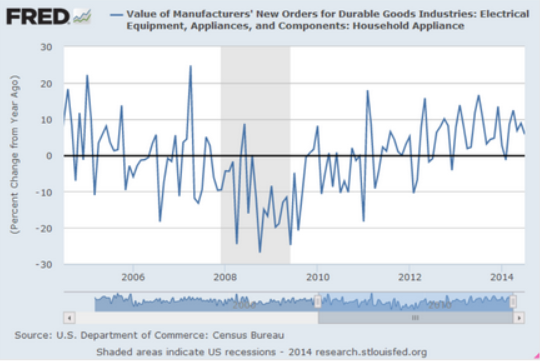
This doesn’t look like much of a recovery?
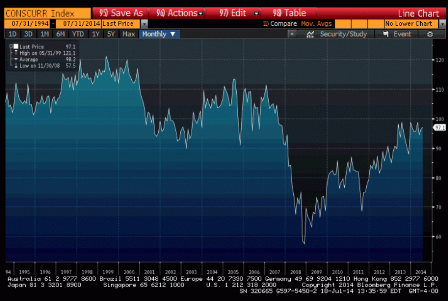
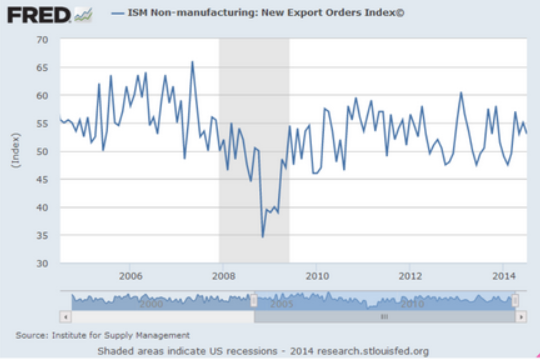
The export game is getting tougher as well:
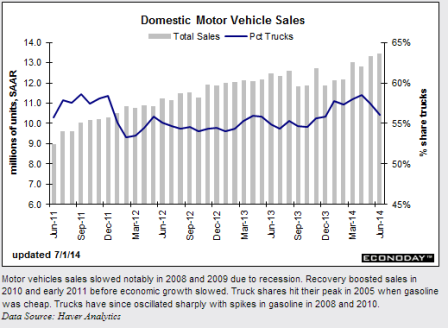
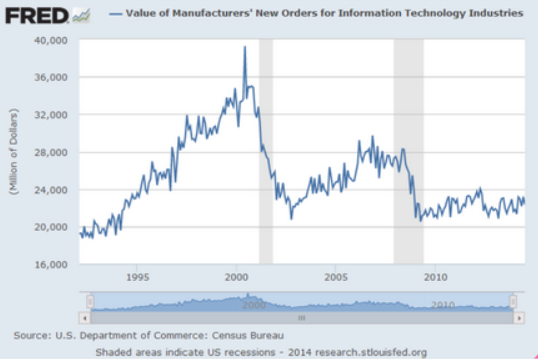
Tech not so hot either:
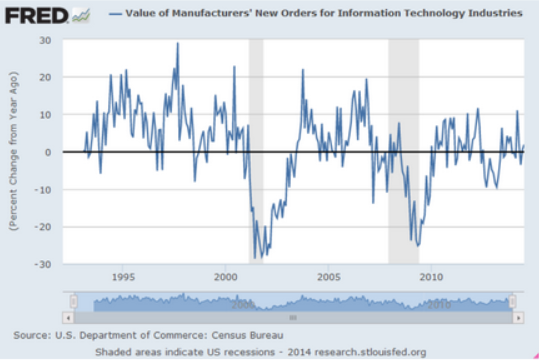
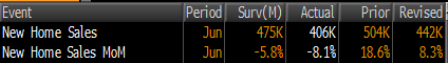
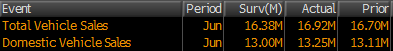
Here’s the report:
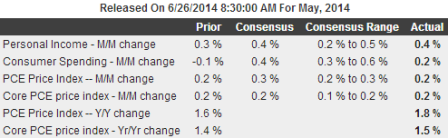
Highlights
Skewed by Boeing orders at the Farnborough Airshow, factory orders surged 10.5 percent in July. Excluding transportation equipment, which includes both aircraft and vehicles, factory orders actually slipped, down 0.8 percent in the month.
But there are important positives in the report including a sharp 1.2 percent rise for shipments and a 1.4 percent rise for shipments of nondefense capital goods excluding aircraft. Unfilled orders show an unusually outsized gain of 5.4 percent while inventories, up only 0.1 percent, will need to be refilled. Another positive is an upward revision to June orders, now at a very strong 1.5 percent vs a prior reading of plus 1.1 percent.
Aircraft orders are the standout star of the July report and mustn’t be dismissed. These orders are long term but will eventually boost factory shipments and employment. Though orders outside aircraft were soft in July, the trend is still positive. Today’s report, together with yesterday’s exceptionally strong ISM report for August, point to third-quarter strength for the manufacturing sector.