It wasn’t supposed to happen this way. All the talk last year was about new supply driving down prices. And every US ‘inflation’ of consequence I’ve seen has been oil related.
By Grant Smith
June 9 (Bloomberg) — OPEC ministers say they will almost certainly leave their oil-production ceiling unchanged when the group meets this week. What really matters for markets is whether Saudi Arabia will respond to global supply shortfalls by pumping a record amount of crude.
Just six months ago, energy analysts predicted output from the Organization of Petroleum Exporting Countries would climb too high and Saudi Arabia needed to cut to make room for other suppliers. They changed their minds after production from Libya, Iran and Iraq failed to rebound as anticipated, and industrialized nations’ stockpiles fell to the lowest for the time of year since 2008. Saudi Arabia may need to pump a record 11 million barrels a day by December to cover the other member nations, says Energy Aspects Ltd., a consultant.
“Now it’s not whether the Saudis will make room, but whether they’ll keep it going and maintain enough spare capacity,” said Jamie Webster, a Washington-based analyst at IHS Inc., an industry researcher. “OPEC is increasingly having a hard time just doing its job of bringing all the barrels needed.”
Even as the North American shale revolution propels U.S. production to a three-decade peak, supply in other parts of the world is faltering. A battle for political control in Libya, pipeline attacks in Iraq and prolonged sanctions against Iran are preventing those nations from reviving output. While U.S. crude inventories rose to a record in April, restrictions on exports are keeping those supplies in the country, tempering forecasts that global oil prices will decline this year.
Supply Risks
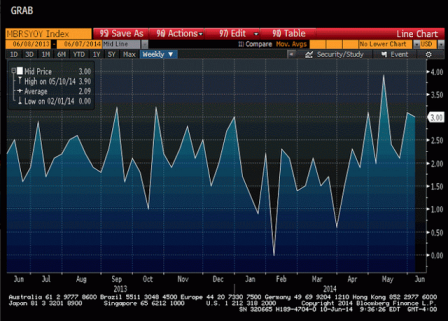
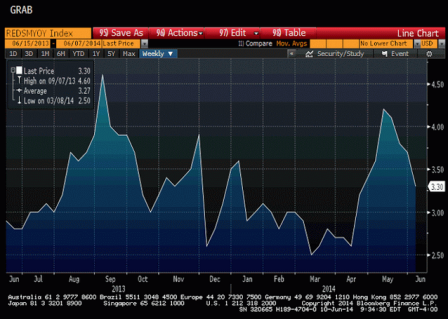
Deutsche Bank AG, Morgan Stanley, Barclays Plc and Citigroup Inc. raised their 2014 Brent price forecasts over the past three months, citing supply risks. The median estimate of the four banks climbed to $107.75 a barrel, from $100.25 as of Dec. 31. The grade has averaged $108.24 a barrel this year.
OPEC, which produces about 40 percent of the world’s oil, will meet in Vienna on June 11 to discuss its 30 million barrel daily production target. Ministers from Saudi Arabia, Angola and Kuwait said they expect no change, as did 22 of 23 analysts and traders surveyed by Bloomberg News.
OPEC’s Economic Commission Board, a panel that reviews supply and demand levels before the meeting, concluded on June 5 that the current production level is adequate, according to two OPEC delegates.
Low Inventories
The International Energy Agency, the Paris-based adviser to 29 nations, recommended on May 15 a “significant rise in OPEC production” to meet demand of 30.7 million barrels a day in the second half of the year. Oil inventories in advanced nations were at 2.62 billion barrels in April, the lowest for that month since 2008, the year Brent reached a record $147.50 a barrel, IEA data show.
Boosting output that high would be “a Herculean task for the group to surmount given that production has been below 30 million barrels a day for the last five months,” London-based Energy Aspects said in a May 27 research note.
The situation has reversed since OPEC last met in December. At that time, the IEA indicated the group would need to reduce output by about 3 percent in the first half of 2014 to make way for North America’s booming shale oil supplies.
U.S. oil production rose to 8.47 million barrels a day in the week ended May 23, the highest since 1986, according to the Energy Information Administration. The nation’s crude inventories were at 399.4 million barrels through April 25, the highest in data beginning in 1982, the EIA estimates.
December Meeting
Several OPEC nations have failed to boost output as their ministers suggested at the group’s last meeting in December. Iraq was aiming for a surge of about 30 percent in 2014 to 4 million barrels a day, Oil Minister Abdul Kareem al-Luaibi said. Libya intended to restore within 10 days full daily capacity of almost 1.6 million barrels, from less than 20 percent previously, Oil Minister Abdulbari al-Arusi said. Iran had secured six months of relief from sanctions imposed by western governments and was seeking its highest output in five years, Oil Minister Bijan Namdar Zanganeh said.
Iraq’s daily production contracted 8 percent since reaching a 35-year peak of 3.6 million barrels in February amid political disputes and pipeline bombings, according to the IEA. In Libya, output has fallen to a 10th of capacity because of protests at oilfields and strikes at export terminals. Iranian supply is little changed, while an end to sanctions relief looms in July if it cannot reach a broader deal on its nuclear program.
Expectations Fade
As a result, inventories of crude and refined oil in Europe were 86 million barrels below their five-year average at the end of March, according to the IEA. U.S. benchmark West Texas Intermediate is about $6 a barrel cheaper than North Sea Brent.
“At the start of this year, expectations around the return of Libyan, and subsequently Iranian, barrels were high,” Amrita Sen, chief oil market strategist at Energy Aspects, said by e-mail on May 20. “Today those possibilities have diminished substantially. The real question concerns how OPEC will meet higher demand for its crude in the third quarter. The onus falls on Saudi Arabia to do much of the heavy lifting.”
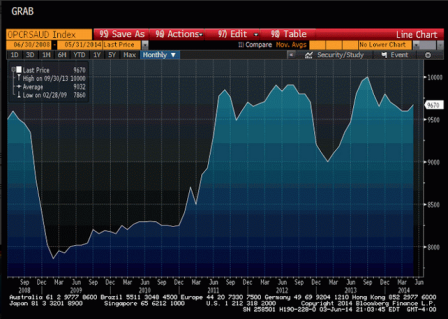
Saudi Oil Minister Ali Al-Naimi told reporters in Seoul on May 12 that any supply shortage in the oil market can be covered. The kingdom is capable of producing as much as 12.5 million barrels a day of crude oil and pumped 9.67 million in May, according to data compiled by Bloomberg. Media officials at Saudi Arabia’s oil ministry in Riyadh weren’t available to comment when contacted by Bloomberg on June 6 and yesterday. There was no response to an e-mail to Saudi Aramco’s media department yesterday.
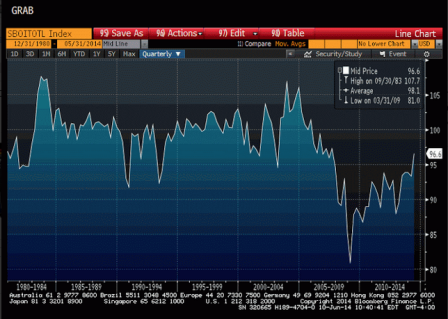
Estimates vary on how much Saudi Arabia needs to produce before the end of the year. IHS projects about 10.3 million and while Societe Generale says between 10.2 million barrels and 10.5 million barres a day in the third quarter. The high of 11 million that Energy Aspects says could be needed from Saudi Arabia would be higher than the quarterly peak of 10.1 million reached in late 1980, according to OPEC data.
“At the time of the last OPEC meeting, there was a fair amount of concern about what would happen if disrupted production in key countries starts to come back in a big way,” said Mike Wittner, the head of oil market research at Societe Generale SA in New York. “It’s not all happening in a big way. It means the market needs the Saudis to produce more crude.”
 Full size image