Jobs, Philly Fed

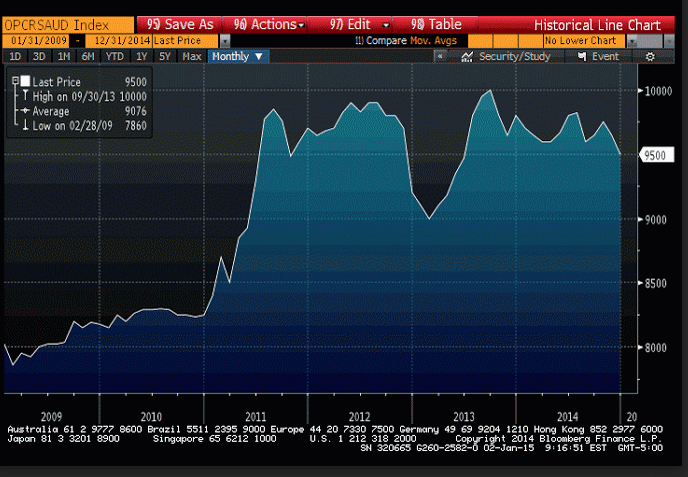
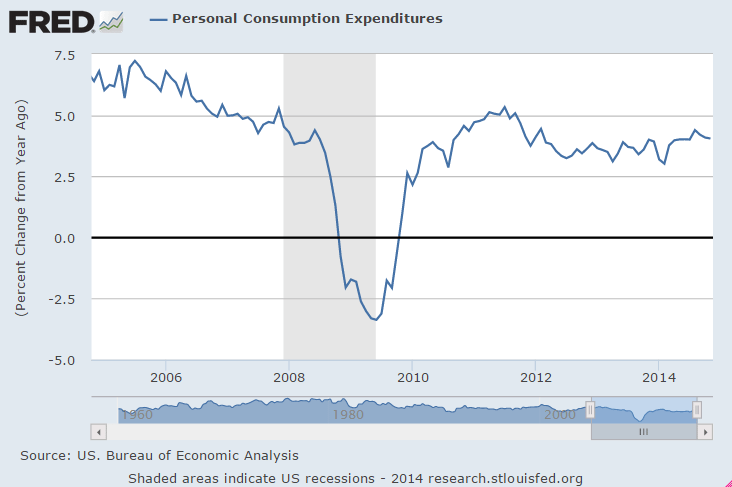
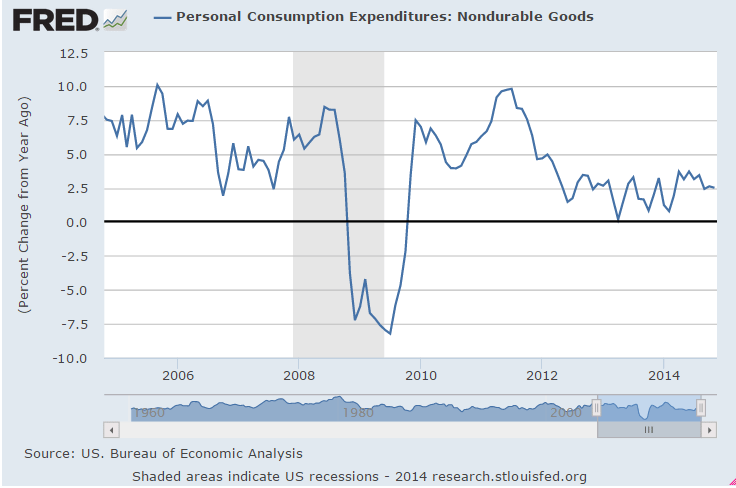
This tick up might mean nothing,
but could also be the start of a move up due to the fall off in oil capital expenditures:

Jobless Claims
claims-1-10
Highlights
Jobless claims jumped sharply in the January 10 week, up 19,000 to a 316,000 level that’s the highest since September. The 4-week average is up 6,750 to 298,000 which is about even with the month-ago comparison.
claims-1-10-graph

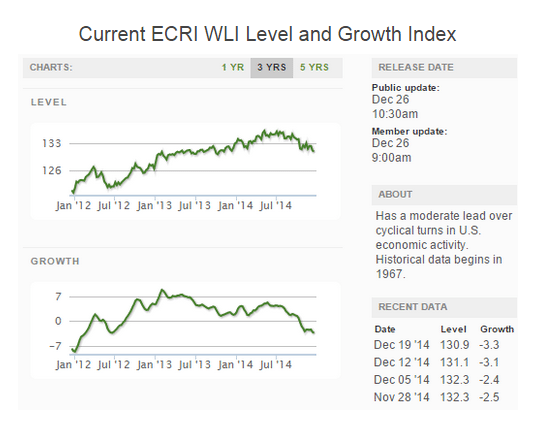
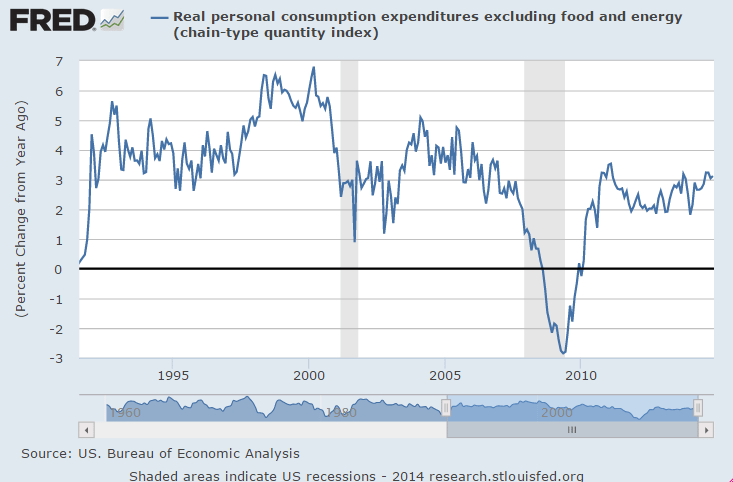
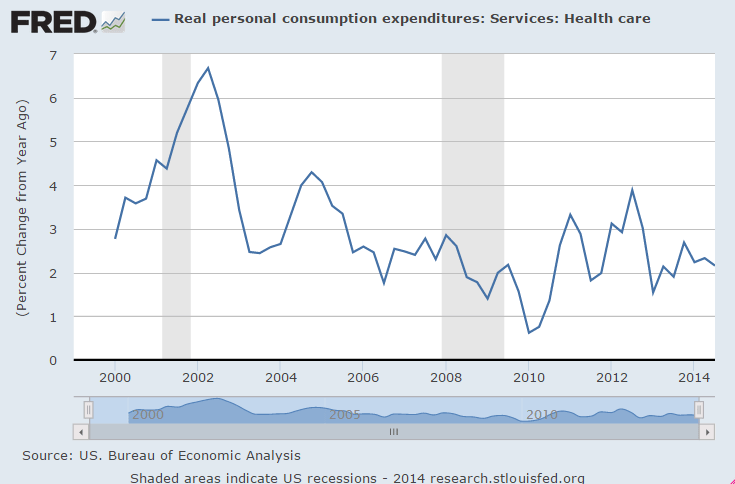
This tick down might mean nothing, but could also be the start of a move down due to the fall off in oil capital expenditures:

Philadelphia Fed Survey
philly-jan
Highlights
Abrupt slowing is the signal from the manufacturing report of the Philly Fed whose general conditions index for January fell to plus 6.3 from December’s plus 24.3 (revised from 24.5). Growth in new orders, however, does remain solid at plus 8.5 though down from December’s plus 13.6. The 6-month general outlook also is a positive, at a very strong 50.9 vs December’s 50.4.

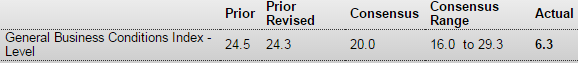
Now the weak readings led by shipments, which are in contraction at minus 6.9 vs December’s plus 15.1, and employment, now also in contraction at minus 2.0 vs December’s plus 8.4. Unfilled orders also are in the negative column, at minus 8.6 vs plus 2.7 in December. Price readings are soft with input price inflation moderating further and output prices now in modest contraction.
ism-dec
Empire did a bit better.

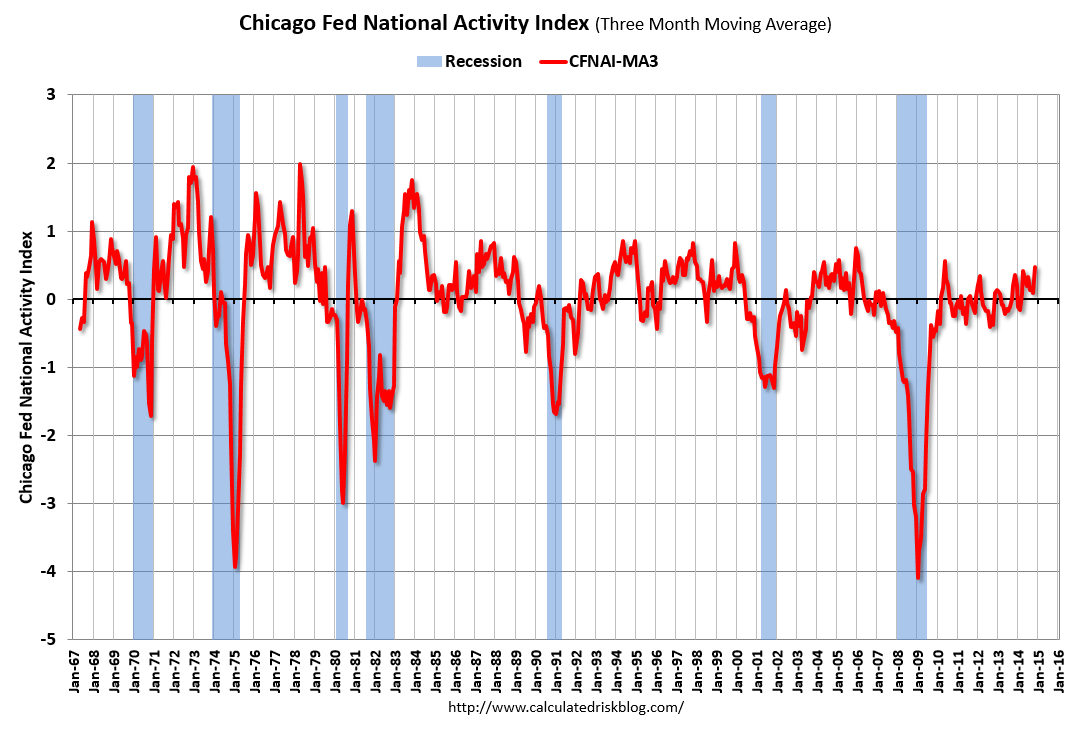
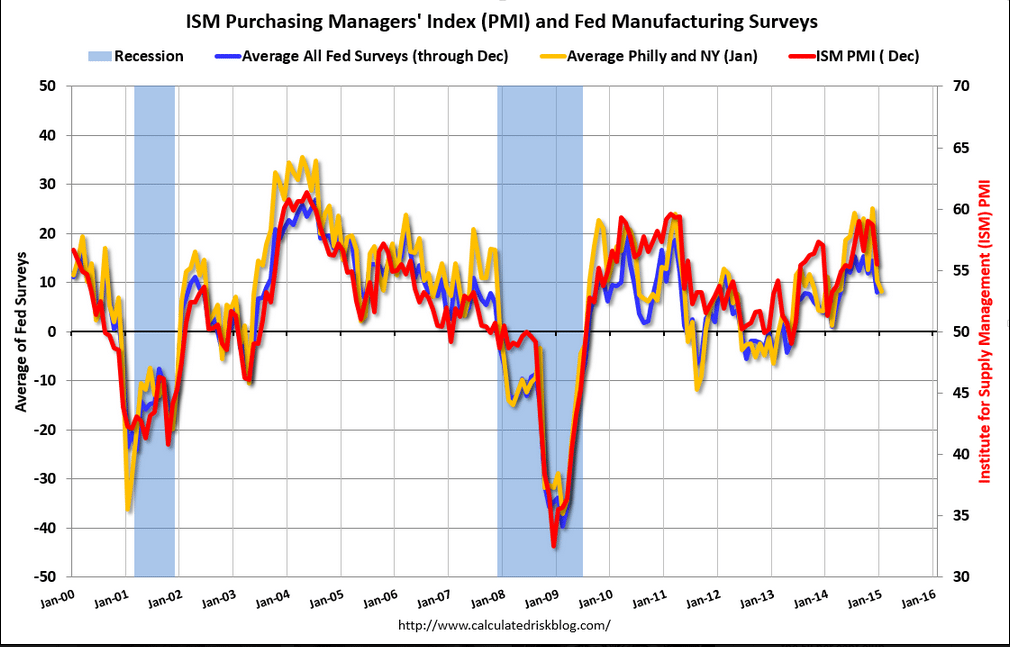
This came out before the Philly Fed 6.3 print so add that last data point to the red line on the chart:
emp-vs-philly

PMI Manufacturing Index, ISM manufacturing, Construction spending

PMI Manufacturing Index
1-2-1

Highlights
Slowing growth is the signal from Markit’s US manufacturing sample where the final composite score came in at 53.9, down from November’s 54.8. The flash reading for December was 53.7. New business gains and output both slowed in the month which respondents tied to uncertainty over the global economic outlook. Export orders did rise but weak demand was noted in the euro area and emerging markets. The news on hiring is downbeat with growth the slowest since July. A negative for employment is a marked slowing in backlog accumulation. Inventory data look lean the price data subdued. Coming up next will be the ISM’s manufacturing report at 10:00 a.m. ET.

The index was down and below expectation and note the fall in export orders. Part of the downside of low oil prices could be a drop in exports to producing nations experiencing sharp declines in oil revenues.

1-2-2
Highlights
The ISM report had been running hot compared to many other measures of the manufacturing sector which should help limit the impact from the slowdown in today’s report. The ISM composite index came in at 55.5, down a sizable 3.2 points from November for the slowest rate of monthly growth in six months.

Growth in new orders slowed substantially, to 57.3 from November’s exceptionally strong 66.0, while backlog accumulation also slowed, to 52.5 from 55.0. Production slowed to 58.8 vs 64.4.

1-2-3

1-2-4

Construction Spending
1-2-5

Highlights
Construction outlays slipped 0.3 percent in November after a sharp 1.2 percent rebound in October. Market expectations were for a 0.5 percent gain.

November’s decrease was led by public outlays which fell 1.7 percent after a 2.8 percent jump in October. Private residential spending rose 0.9 percent, matching the pace the month before. Private nonresidential construction spending dipped 0.3 percent in November after edging up 0.1 percent in October.

On a year-ago basis, total outlays were up 2.4 percent in November compared to 4.0 percent in October.

The construction sector is slowing, tugging down on fourth quarter GDP.
1-2-6

ecri still negative

As previously discussed, this is dismissed because of a prior false recession alarm. At that time the deficit was, in my opinion, high enough to support positive growth.

Today’s a different story. The economy always requires deficit spending from some agent to offset the tendency to not spend income (demand leakages). Looks like it’s been the high cost energy sector doing the deficit spending (new bank loans, new bonds, new equity, etc.) to support the modest growth we’ve had, picking up the slack as govt deficit spending receded. And now it looks like the energy related deficit spending is falling as the price of oil falls.

Not good for GDP!
ecri-12-26

existing home sales, Chicago Fed

Bad.
And prices down again.

As previously discussed, with mtg purchase apps down and cash buyers down it’s hard to see how sales can rise…

Existing Home Sales
Existing-home-sales-nov
Highlights
Existing home sales had been showing some life but not in November, sinking a very steep 6.1 percent to a 4.93 million annual rate which is below the low end of the Econoday consensus (4.97 million to 5.35 million). November, a month when the nation’s weather proved mostly mild and which should have given a boost to sales, ends 5 straight months of plus 5.0 million rates.

November’s weakness is broad based with all 4 regions showing single digit monthly declines. But the good news is that the weakness in sales is not inflating supply which, due to a draw down of homes on the market to 2.09 million from 2.24 million, held steady relative to sales, at 5.1 months.

Lower prices don’t seem to be giving a boost to sales. The median fell for a 5th straight month, down 1.1 percent in November to $205,300. Year-on-year the median price, where growth had been in the double digits through most of last year, is up 5.5 percent, holding in the mid-single digit area where it’s been since March.

Existing Home Sales in November: 4.93 million SAAR, Inventory up 2.0% Year-over-year

By Bill McBride

Existing-home-sales-nov-graph

A bit of a blip up in manufacturing, the rest not good:

Chicago Fed National Activity Index
chi-fed
Highlights
The big 1.1 percent jump in the manufacturing component of the industrial production fed a very strong plus 0.73 percent reading for November’s national activity index vs a revised plus 0.31 in October. Other components in November, however, were flat with the positive contribution from employment edging lower while the positive contribution from sales/orders/inventories all but disappeared. The drag from consumption & housing remained moderate. The outsized manufacturing gain also boosted the 3-month average which rose to plus 0.48 in November from October’s revised plus 0.09 for its strongest reading since May 2010.
chicago-fed-graph-1

Offsetting the demand leakages

As previously discussed the economy is continually subject to chronic ‘unspent income’, also known as ‘demand leakages’. Many are tax advantaged, such as pension fund and retirement contributions, insurance reserves, and other corporate reserves. Some are political, such as foreign central bank fx reserve accumulation.

And each period of expansion has been characterized by a ‘borrowing to spend’/’credit expansion’/’spending more than income’ that has more than offset the demand leakages.

The govt spending more than its income ordinarily gets things going, but then the non govt ‘spending more than its income’ has to take over as the ‘automatic fiscal stabilizers’ of falling unemployment and other benefits and increased tax collections ‘automatically’ reduce govt deficit spending.

In the 80’s the deficit went up with the tax cuts and spending increases, but the heavy lifting was done by the savings and loan expansion phase which added about $1 trillion of ‘suspect’ loans while it lasted. In the late 90’s it was the .com and y2k ‘borrowing to spend’ further supported by a surge in mortgage credit. In the early 2000’s it was the expansion phase of the sub prime fiasco that drove growth until that ended.

That’s why I’ve been looking for the credit expansion that’s been sustaining even the modest growth we’ve been getting in this latest cycle, particularly after the 180 billion tax hike that began Jan 1, 2013 and the 70+ billion in sequesters that followed a few months later. I couldn’t find the supporting credit expansion in the usual places- houses, C and I loans, student loans, and autos which did help some.

What I didn’t dig into was loans to the energy sector to develop what are now high priced oil. And now with that source of ‘borrowing to spend’ going into reverse, we’ll see how much support it’s been providing…

Early Signs Of A Slowdown In US Oil Fields

Early Signs Of A Slowdown In US Oil Fields Are Emerging. After leading the US economic recovery out of recession, some of the nation’s top oil states are showing early signs of a slowdown as a result of the plunge in crude prices. In Houston, the first oil industry layoffs have been announced, with realtors there predicting a sharp decline, up to 12%, in home sales next year.