Mortgage purchase apps, Durable goods orders

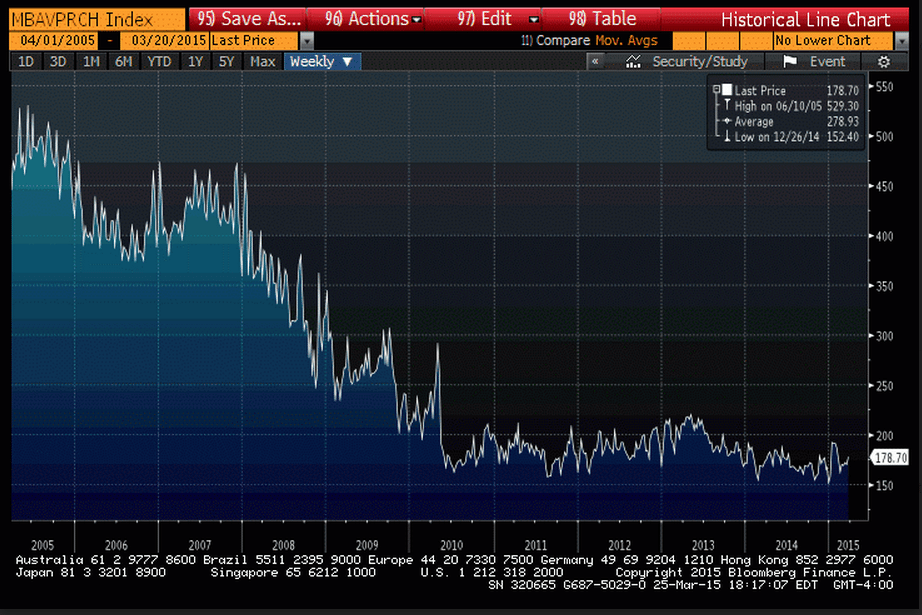
Still looking stone cold dead to me, with risk of going even lower.

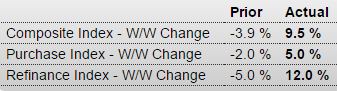
Purchase apps up only 3% from a dismal period last year:

MBA Mortgage Applications
mba-3-18

purchase-apps-10yr

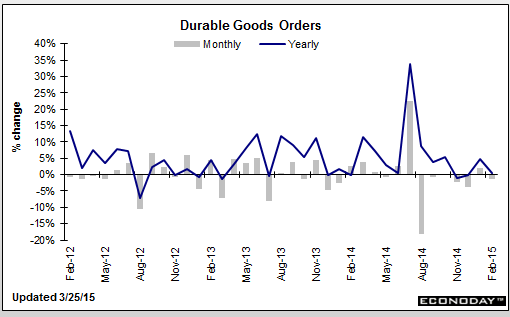
Way below expectations and prior month revised down, causing GDP estimates to be further cut as well:

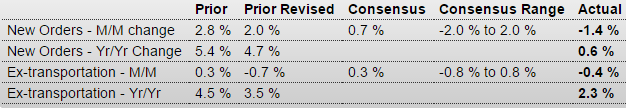
Durable Goods Orders
dgo-feb-table
Highlights
The manufacturing sector continues to look weak. Durables orders fell 1.4 percent in February after rebounding 2.0 percent the month before. Market expectations were for a 0.7 percent gain. Excluding transportation, the core declined 0.4 percent, following a 0.7 percent drop in January. Analysts projected a 0.3 percent gain in February.

Transportation dropped 3.5 percent, following a monthly rebound of 8.8 percent the prior month.

Motor vehicles slipped 0.5 percent, nondefense aircraft decreased 8.9 percent, and defense aircraft fell 33.1percent.

Outside of the core, orders were mixed. Industries that advanced were primary metals and electrical equipment. Declines were seen in fabricated metals, machinery, computers & electronics, and “other.”

Nondefense capital goods orders excluding aircraft were down 1.3 percent, following a 0.9 percent dip in January. Shipments of this series were flat in February after rising 1.0 percent the month before.

The latest orders numbers point to continuing weakness in the manufacturing sector and may soften Fed hawk rhetoric-especially taking into account the latest sluggish March manufacturing surveys.
dgo-feb-graph

GDP growth estimates tumble

March 25 (WSJ) — At least one first-quarter tracking estimate is already close to zero. The Federal Reserve Bank of Atlanta on Wednesday put its gauge at 0.2%, down from its earlier estimate of 0.3%. Macroeconomic Advisers trimmed its estimate down to 1.2% from 1.5% beforeWednesday. The U.S. economy contracted at a 2.1% annual pace in the first quarter of 2014, a drop many economists attributed to severe winter weather. The economy bounced back with growth at a 4.6% pace in the second quarter, 5% in the third quarter and 2.2% in the fourth quarter.

Weak U.S. business spending data points to tepid first quarter growth

March 25 (Reuters) — Non-defense capital goods orders excluding aircraft dropped 1.4 percent last month after a downwardly revised 0.1 percent dip in January. The so-called core capital goods orders were previously reported to have increased 0.5 percent in January. Shipments of core capital goods rose 0.2 percent last month after slipping by a revised 0.4 percent in January. They were previously reported to have gained 0.1 percent in January. Order books for core capital goods dropped 0.3 percent after barely rising in January.

car sales fall again

No surging consumer here either.

Third month down…

U.S. Light Vehicle Sales decrease to 16.2 million annual rate in February

By Bill McBride

Based on a WardsAuto estimate, light vehicle sales were at a 16.16 million SAAR in February. That is up 5.4% from February 2014, and down 2.4% from the 16.55 million annual sales rate last month. The comparison to February 2014 was easy (sales were impacted by the severe weather last year).
vehicle-sales-feb

eur/usd

Warren, euro continue to go down vs usd. Do you think draghi goal is to reach eur/usd 1:1 ?

Good question!

No one thinks the ECB is buying dollars so if that’s the case the world is getting short euros directly and indirectly in very large size, as per the EU trade surplus, which is a consequence of the overall increases in ‘competitiveness’ as wages are depressed by fiscal policy. It’s all part of the ‘purchasing power parity’ shift with the EU becoming the low cost producer. And these forces all work to make the euro very strong once the ‘portfolio shifting’ has run its course, which it hasn’t yet.

What’s happened with the euro is the same thing that happened with the USD- markets feared QE would be inflationary and cause currency depreciation, so they discounted that in advance of QE, depressing the dollar. And when it didn’t happen and QE ended, the dollar reversed as those caught short and those who had become underweight in dollars had to restore their dollar exposures.

So while portfolios with dollar liabilities that had reduced dollar exposure were returning to dollars, at the same time the ECB was moving towards negative rates and QE, causing portfolios to reduce euro exposures, driving the euro lower. And events surrounding Greece and Ukraine only added to euro fears, further driving portfolio managers to shift exposure away from euro.

What I can’t tell you is when the tide will turn, but looks to me that when it does, the euro goes up until the trade surplus reverses, and since the link between the rising euro and the trade balance is ‘loose’ the euro could easily get very high vs the dollar- say, over 1.5- before that happens.

To answer your question, what Draghi is doing- negative rates and QE, fundamentally makes the euro stronger, but he believes, as do market participants, that it makes the euro weaker. Same with the Fed, of course, as market participants believe higher rates are dollar friendly when in fact fundamentally they weaken it. So while Draghi may be targeting 1:1 as you suggest, and taking measures he believes and markets believe will get him there, in fact he and markets are ‘pushing on a spring’ as fundamentally net euro are being drained rather than added to the global economy.

What this also suggests is the next EU crisis could be that of the strong euro as it appreciates and starts hurting EU export industries, and the ECB just keeps doing more and more QE and cuts rate further which only makes it all worse.

Empire survey, MS on consumer spending, Housing index, e commerce

All these surveys are now declining:

From the NY Fed: Empire State Manufacturing Survey

empire-v-philly-fed-feb

The February 2015 Empire State Manufacturing Survey indicates that business activity continued to expand at a modest pace for New York manufacturers. The headline general business conditions index edged down two points to 7.8. The new orders index fell five points to 1.2—evidence that orders were flat—while the shipments index climbed to 14.1. Employment indexes pointed to an increase in employment levels and little change in the average workweek.

Indexes assessing the six-month outlook, though generally positive, conveyed considerably less optimism about future business activity than in recent months. The index for future general business conditions plunged twenty-three points to 25.6, its lowest level in more than two years.
emphasis added

Maybe it’s because lower oil prices merely shift income from sellers of oil to buyers of oil? Leaving falling capital expenditures as the net effect? Along with the negative effect of falling net worth as the value of energy holdings declines?

MORGAN STANLEY: US consumers just aren’t spending their gas savings like we thought they would

By Akin Oyedele

Feb 16 (BI) — US consumers are getting more cautious about how they spend their savings from low gas prices.

Gas prices have fallen 40% since September, giving consumers a ‘tax break’ of more than $60 billion, according to Morgan Stanley chief US economist Ellen Zentner.

As gas prices fell, the pace of real Personal Consumption Expenditures (PCE) growth accelerated above the 2% average of the last four years, Zentner said in a video Friday. It reached 4.3% for the fourth quarter of 2014.

Yet, that was less than what it could have been.

“What we found is some lingering caution, that sales could actually be stronger,” Zentner said. “So some of the discretionary categories have shown some weakening of late. Households simply aren’t spending as much out of the gas savings as we thought they would.”

“That lingering caution we think continues in the first quarter,” she added, showing that real PCE growth is estimated to fall to 3.2% for the first quarter. The benefit of the slowdown in spending is that people are using the extra money to pay off debt, or are stashing it away as savings, Zentner said. This ultimately improves households’ finances.
consumer-spending-impact

Housing Market Index
nahb-feb
Recent History Of This Indicator
The NAHB housing market index continued to report solid conditions with the housing market index at 57 in January versus an upwardly revised 58 in December. January was the 7th plus-50 score in a row. January’s strength was led by the most heavily weighted component, present sales, which held steady at 62. But the second most heavily weighted component, traffic, remained weak, down 2 points to 44 and reflecting a significant lack of first-time buyers in the new home market. The final component, future sales, did fall 4 points but remained very solid at 60.

E-Commerce Retail Sales
e-commerce-table

e-commerce

Consumer Sentiment

Whoops
This isn’t supposed to happen with the lower gas prices:

Consumer Sentiment
sentiment-index
Highlights
Consumer sentiment remains very strong but it did move down after spiking in January, to 93.6 for the mid-month February reading vs January’s 98.1 which was the best reading in 11 years. The 93.6 reading is still very solid, matching December’s reading as the second best of the last 8 years.

The fall back for the index is divided about equally between the two components, current conditions at 103.1 vs 109.3 and expectations at 87.5 vs 91.0. The dip for current conditions points to possible slowing in consumer activity this month, while the dip in expectations points to a little less optimism in the outlooks for jobs and income.
sentiment-index-graph

Dallas Fed

who would have thought?…

Dallas Fed Mfg Survey
dallas-fed-jan
Highlights
Texas factory activity was flat in January. The production index, a key measure of state manufacturing conditions, came in at 0.7, indicating output was essentially unchanged from December.

Other survey measures also reflected sluggish activity during the month. The capacity utilization index fell to 5.1, its lowest reading in five months. The shipments index plunged from 20.8 to 6, due to a much higher share of respondents noting a decline in shipments in January than in December. The new orders index moved down from 2.7 to minus 7.7, registering its first negative reading since April 2013.

Perceptions of broader business conditions worsened this month, with both the general business activity index and the company outlook index dropping below zero for the first time in 20 months. The general business activity index dropped to minus4.4, and the company outlook index fell 13 points, coming in at minus3.8.

Labor market indicators reflected unchanged workweeks but continued employment increases. The employment index was 9.0 in January, slightly below last month’s level but close to its average reading over the past two years. Twenty percent of firms reported net hiring compared with 11 percent reporting net layoffs. The hours worked index edged down from 0.7 to minus 0.1, indicating no change in hours worked in January. Wage pressures eased, while input and selling prices declined in January.

Indexes reflecting future business conditions fell notably in January. The index of future general business activity plummeted from 13 to minus 6.4. The index of future company outlook plunged from 21.8 to 2.5, its lowest reading in more than two years. Indexes for future manufacturing activity also declined this month but remained in positive territory.