
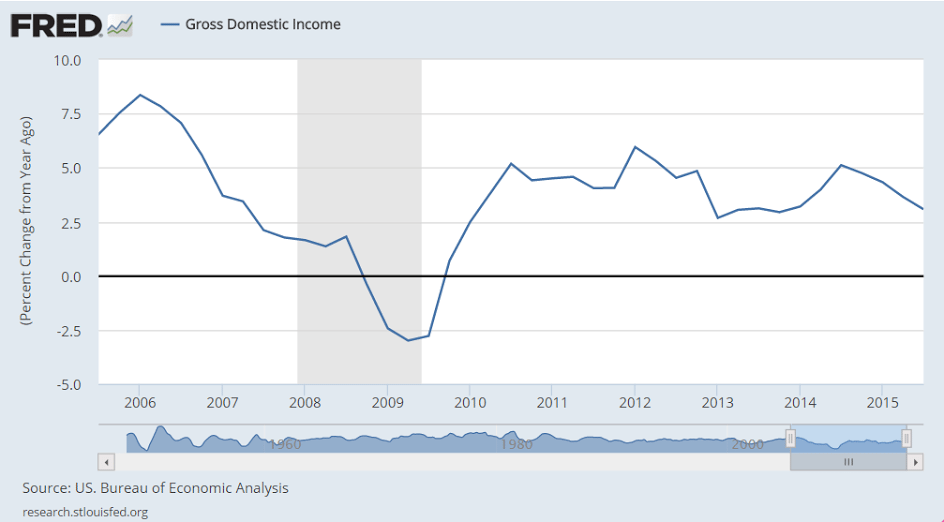
Output was revised up, but mainly due to growing unsold inventory, with other spending revised lower and showing more deceleration than the first release:
GDP
Highlights
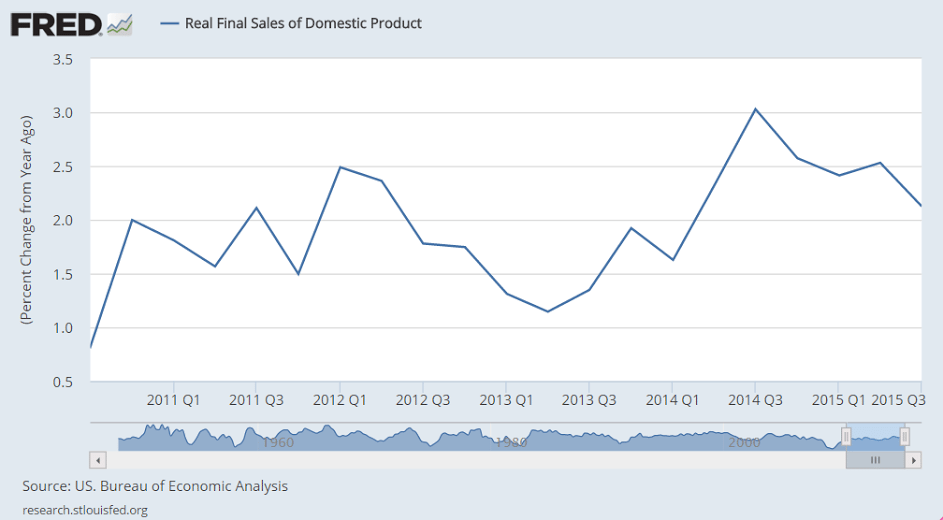
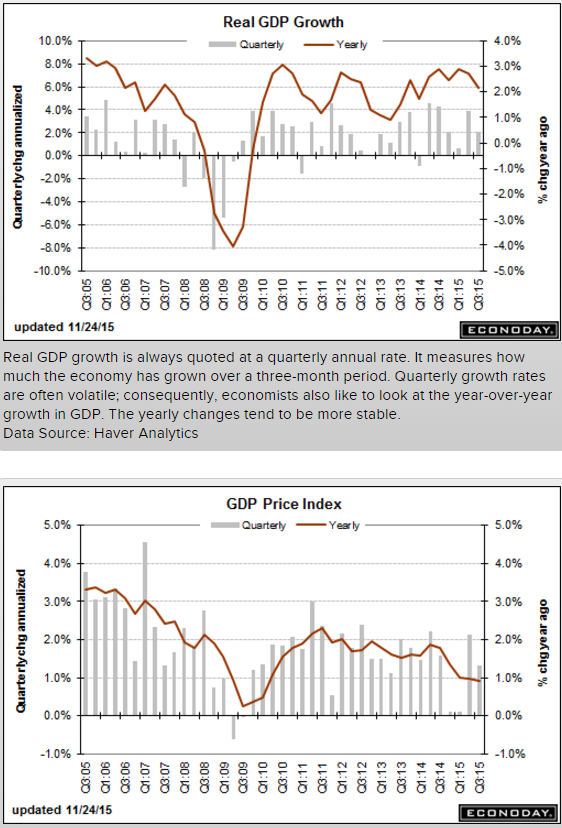
Third-quarter GDP is revised to an annualized plus 2.1 percent, up 6 tenths from the initial estimate but showing less strength by the consumer with final sales now at plus 2.7 from plus 3.0 percent. Higher inventories are a big factor in the upward revision, subtracting 6 tenths from GDP vs an initial 1.4 percent subtraction.
Net exports pulled GDP down by 2 tenths vs only a small negative effect in the first estimate. Exports rose only 0.9 percent in the quarter, down 1 percentage point from the initial reading. Readings on residential investment, adding 2 tenths to GDP, and nonresidential fixed investment, adding 3 tenths, are little changed.
Turning back to the consumer, personal consumption expenditures are revised to plus 3.0 percent, down 2 tenths from the initial estimate and reflecting less strength for durable goods and also services on lower spending for communications and natural gas.
The gain in inventories is not a positive for the fourth quarter, posing headwinds for businesses which may limit production and employment to pull down their inventories. Still, the readings on the consumer are a positive and a reminder that the nation’s economy is being driven by domestic demand. Other details include a tame plus 1.3 percent rise in the GDP price index, up 1 tenth from the initial reading.
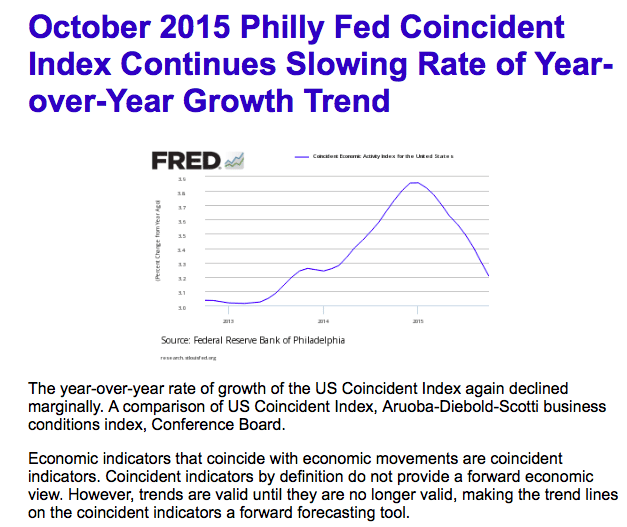
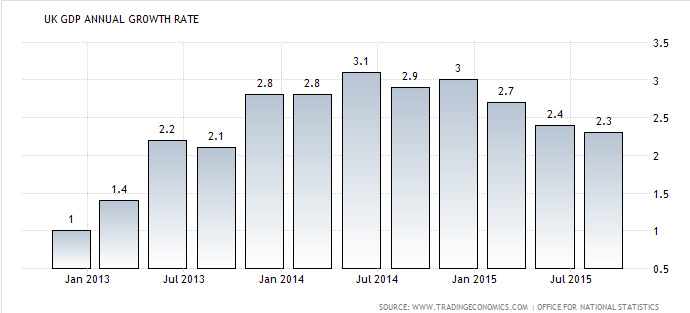
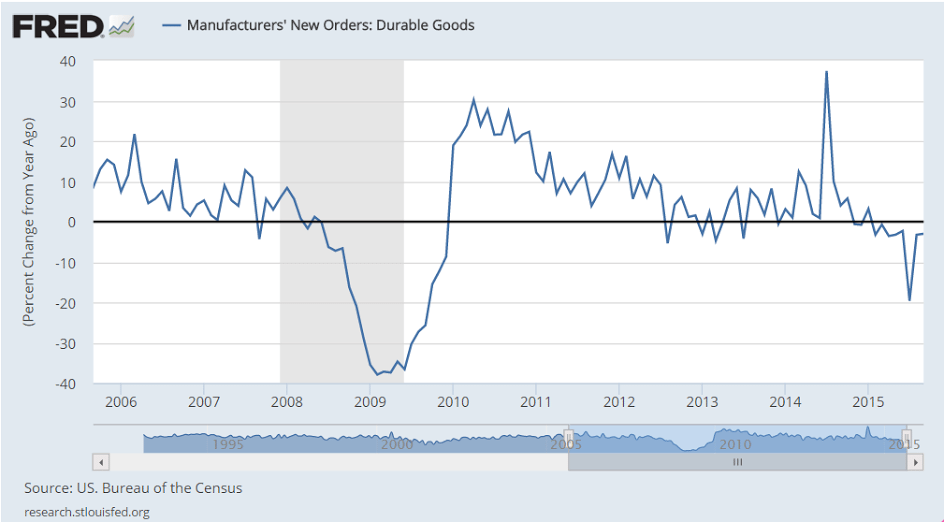
Note the decelration over the last year as oil prices and capital expenditure collapsed:
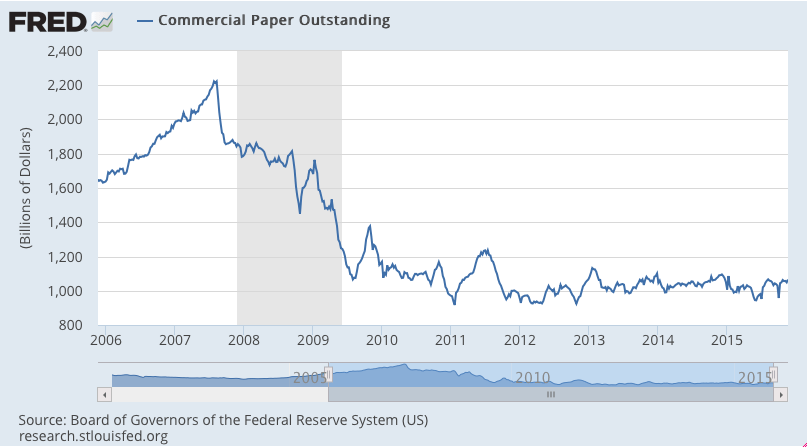
Collapsing?
Consumer Confidence
Highlights
Lack of confidence in the outlook for the jobs market sank the consumer confidence index in November, which fell to 90.4 vs a revised 99.1 in October. The November reading is far under expectations and is the lowest since September last year. Expectations, one of two main components in this report, fell more than 10 points to 78.6 which is the lowest reading since February last year. The employment subcomponent here shows fewer consumers seeing jobs opening up six months from now and more seeing fewer jobs ahead.
The present situation component shows less weakness, down 6.5 points to 108.1 which is the lowest reading since only July. Here the employment subcomponent also shows weakness but nothing dramatic, with 26.2 percent saying jobs are hard to get which is up from October’s 24.6 percent but still respectable. But those describing jobs as currently plentiful showed more noticeable deterioration, at 19.9 percent vs October’s 22.7 percent.
A plus in the report is a jump in buying plans for autos, at 12.4 percent vs October’s 9.8 percent in a reading that hints at renewed acceleration for the motor vehicle component of the government’s retail sales report. A negative is a dip in home buying plans, to 5.6 percent from 6.2 percent. Other readings include a 1 tenth dip in inflation expectations to 5.0 percent which, for this particular reading, is actually subdued but nothing dramatic.
But the decline in job expectations is dramatic and raises the question whether global effects, which have been negative for the U.S., are beginning to weigh on the American consumer — which would not be a positive for the holiday spending outlook.
Corporate Profits
Highlights
Corporate profits in the third quarter came in at a revised $1.786 trillion, up a year-on-year 1.4 percent. Profits are after tax without inventory valuation or capital consumption adjustments.
Richmond Fed Manufacturing Index
Highlights
Early indications for the November factory sector are soft right now after Richmond Fed reports a much lower-than-expected minus 3 headline for its manufacturing index. Order data are very negative with new orders at minus 6, down from zero in October, and backlog orders at minus 16 for a 9-point deterioration. Shipments are also in contraction, at minus 2, with the workweek at minus 3. Employment, at zero, shows no monthly change but the declines for backlog orders and the workweek don’t point to new demand for workers. Price data are subdued but do show some constructive upward pressure.
This report along with Empire State, as well as yesterday’s manufacturing PMI, are pointing to a downbeat month for the factory sector which is being held down by weak foreign demand, as evidenced in the decline for goods exports in this morning’s advance release of international trade data.
International trade in goods
Highlights
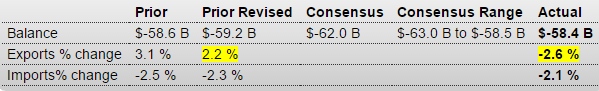
The nation’s trade gap in goods came in at a lower-than-expected deficit of $58.4 billion in October vs $59.2 billion in September. Though the month-to-month comparison points to improvement for the trade deficit, the details are not positive with exports down 2.6 percent and imports, in a sign perhaps of softening domestic demand, down 2.1 percent and following weakness also in September. Weak categories for imports include foods/feeds/beverages, industrial supplies and also capital goods as well as consumer goods with the latter hinting at weak business expectations for the holidays. Export categories showing weakness include foods/feeds/beverages and also industrial supplies.
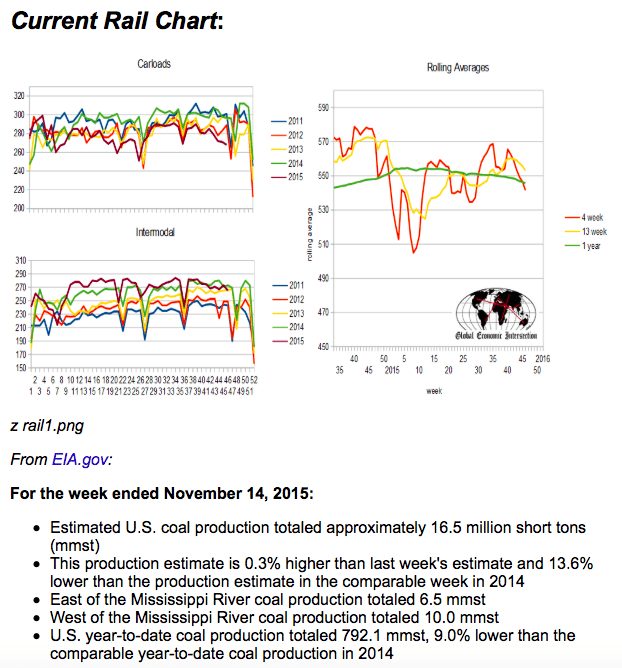
Rail Week Ending 14 November 2015: Contraction Grows
Week 45 of 2015 shows same week total rail traffic (from same week one year ago) declined according to the Association of American Railroads (AAR) traffic data. Intermodal traffic contracted year-over-year, which accounts for approximately half of movements. and weekly railcar counts continued in contraction. The 52 week rolling average contraction grew.
Not much happening:

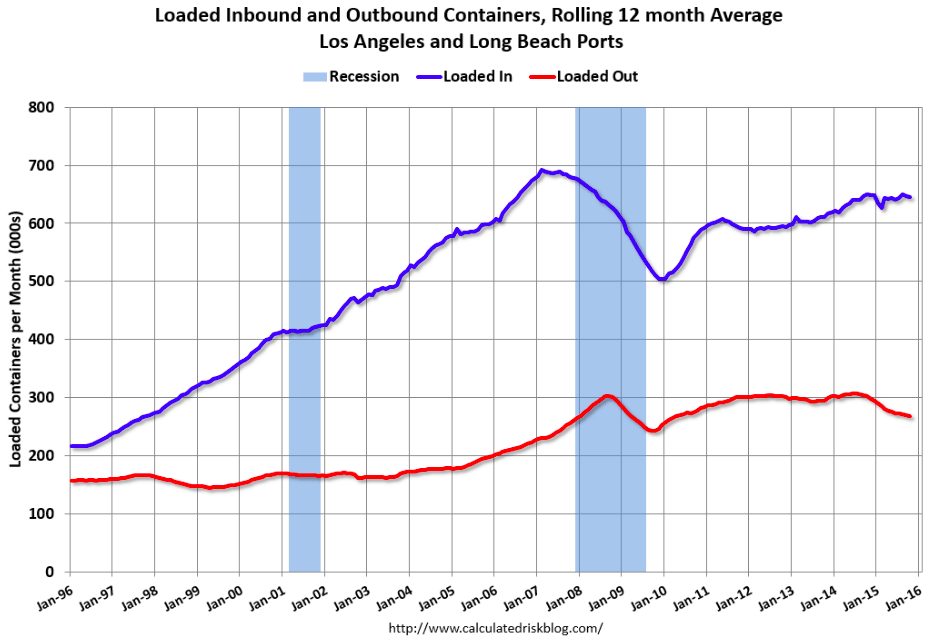
LA area Port Traffic declined in October
By Bill McBride
First, from the WSJ: Quiet U.S. Ports Spark Slowdown FearsFor the first time in at least a decade, imports fell in both September and October at each of the three busiest U.S. seaports, according to data from trade researcher Zepol Corp. analyzed by The Wall Street Journal. …
The declines came during a stretch from late summer to early fall known in the transportation world as peak shipping season, when cargo volumes typically surge through U.S. ports. It is a crucial few months for the U.S. economy as well: High import volumes can signal a confident view on the economy among retailers and manufacturers, while fears of a slowdown grow when ports are quiet.Note: There were some large swings in LA area port traffic earlier this year due to labor issues that were settled in late February. Port traffic surged in March as the waiting ships were unloaded (the trade deficit increased in March too), and port traffic declined in April.
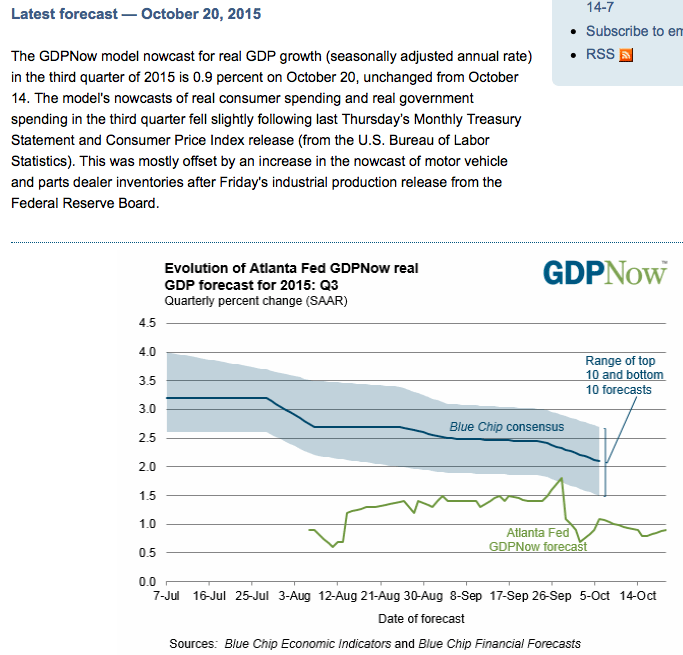
They’ve been starting too high and revising down for a very long time now!
Fourth Quarter 2015 Survey of Professional Forecasters Shave Their Growth Estimates for 2016 and 2017
from the Philadelphia Fed
Growth in real GDP in 2016 and 2017 looks a little slower now than it did three months ago, according to 45 forecasters surveyed by the Federal Reserve Bank of Philadelphia. The forecasters currently see growth in the annual-average level of real GDP at 2.6 percent in 2016 and 2.5 percent in 2017. These current estimates represent downward revisions to the outlook of three months ago, when the forecasters thought 2016 growth would be 2.8 percent and 2017 growth would be 2.6 percent. Notably, the forecasters have raised their growth estimates for 2018. They now see real GDP growing 2.8 percent in 2018, up from the previous estimate of 2.4 percent.
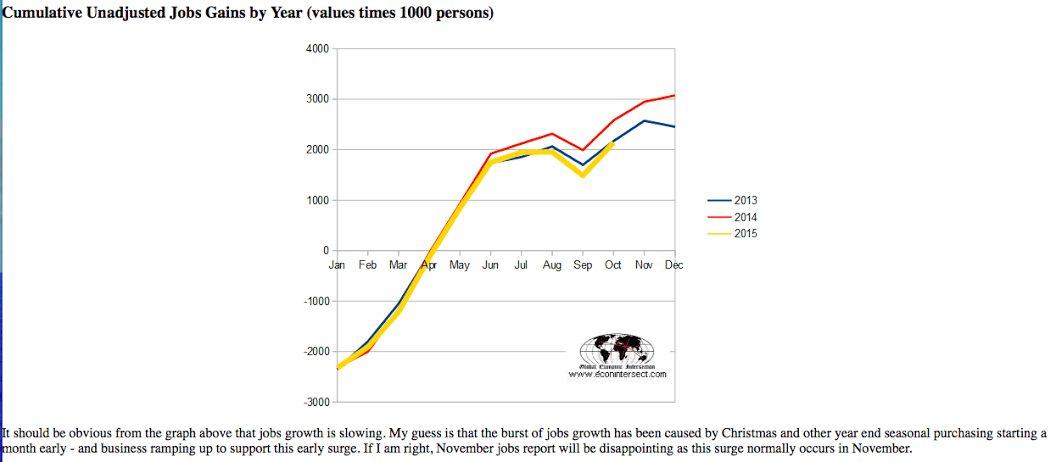
Jobs growth slowing:
Japan economy shrinks 0.8 pct in Q3, back in recession
Capitalism has always been characterized by a massive scrap heap of failures.
Not to say the ‘winners’ don’t make it all worthwhile!
;)
Why technology spending isn’t all its cracked up to be: Study
By Javier E. David
Oct 31 (CNBC) — Large companies often spend a good deal of money on cultivating their technology, but a new study suggests nearly 70 percent of what they spend may be misallocated.
In a study, Genpact Research Institute recently found that, of nearly $600 billion spent on digital projects, almost $400 billion of it was invested in projects that fall short of expectations and returns on investment (ROI). In fact, much of what companies invest in technology sustains existing, or “legacy” systems, rather than new technology, the report found.
In a global market for technology spending estimated at $4 trillion, an amount that research firm Gartner expects to shrink by nearly 5 percent this year, the wasted money can be significant. It suggests companies will be operating from a smaller pool of money, and will need to invest it wisely.
Last I checked this ‘counts’ as ‘personal consumption expenditure’:
Premiums for Health Insurance Bought on Exchanges to Climb in 2016
Oct 26 (WSJ) — The Obama administration said many consumers will see noticeable premium increases when buying health coverage on insurance exchanges in 2016. Federal officials said Monday that the price of the second-lowest-cost midrange “silver plan”—a key metric for premiums around the country—will increase by 7.5% on average across the three-dozen states that rely on Washington to administer the health law for them. And 60% of enrollees—across 30 of the largest markets in the U.S.—will see the average rate for that benchmark plan rise by 6.3%.
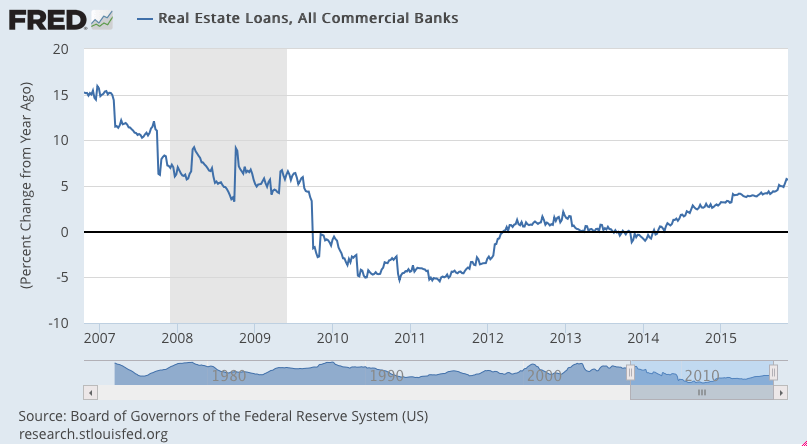
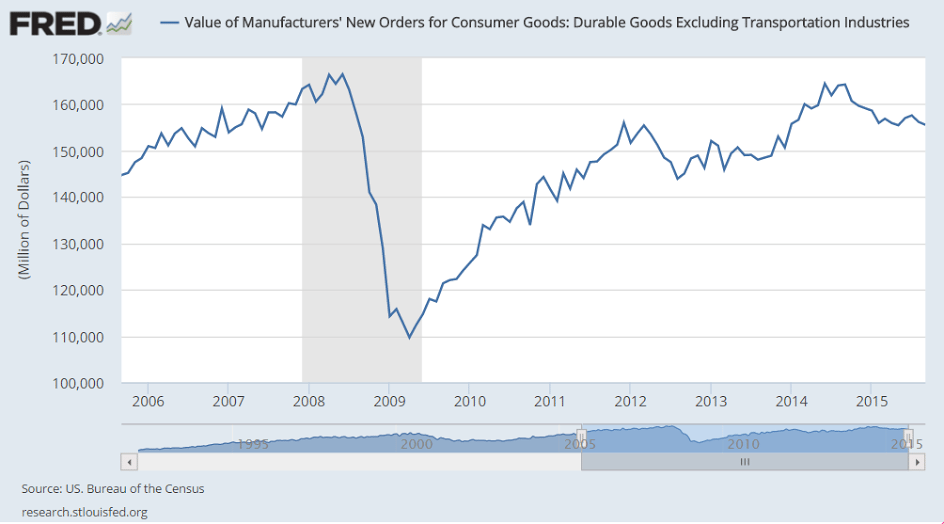
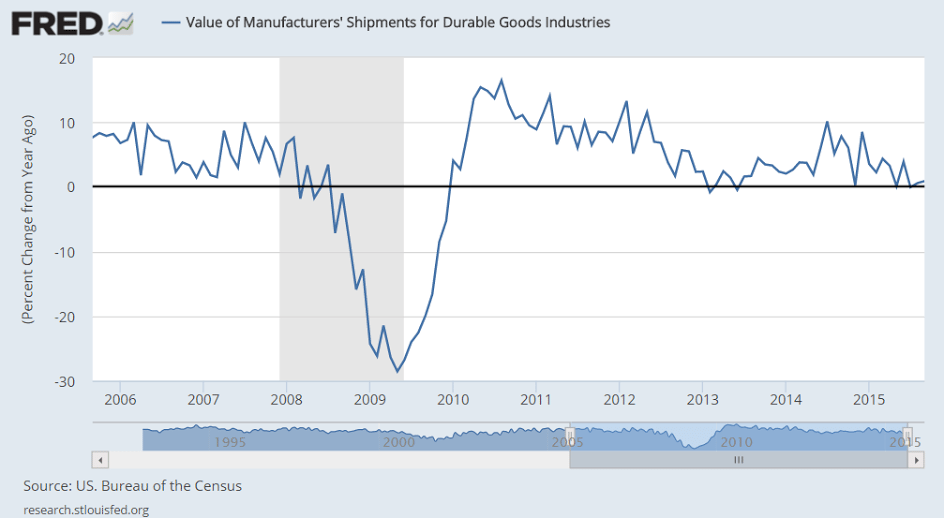
Also decelerating since oil prices collapsed:
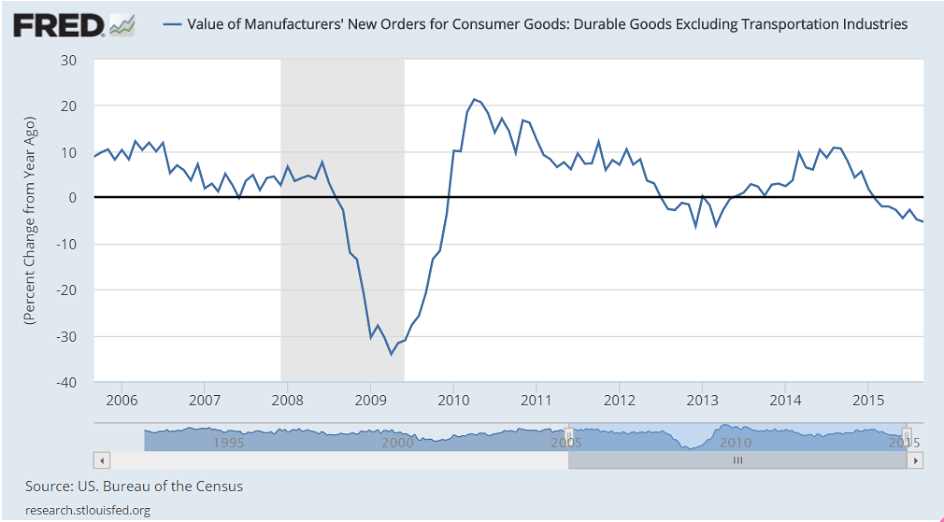
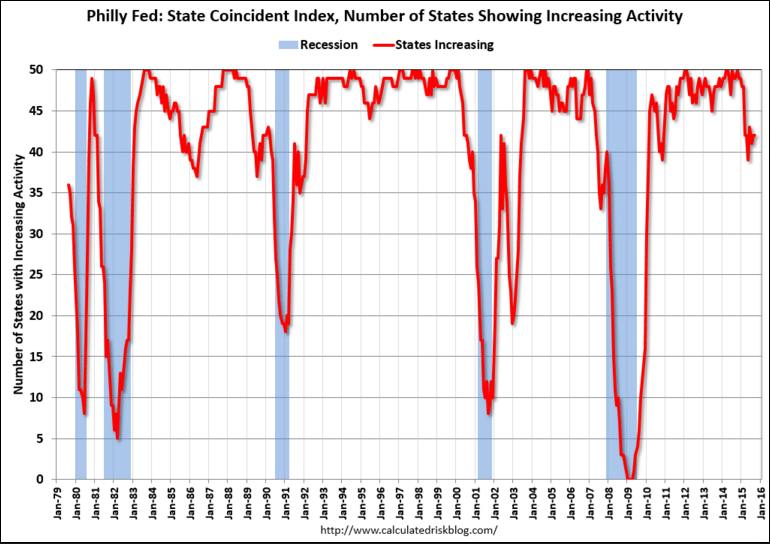
Up off the bottom some but no where near enough to levels historically coincident with lower unemployment, etc:

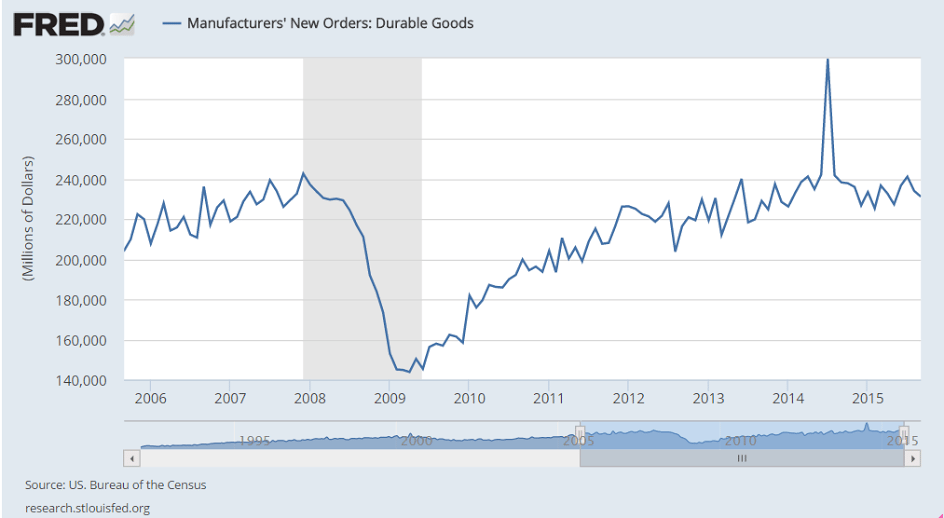
Bad and the prior month revised down, and with employment growth slipping motor vehicles could be hit next:
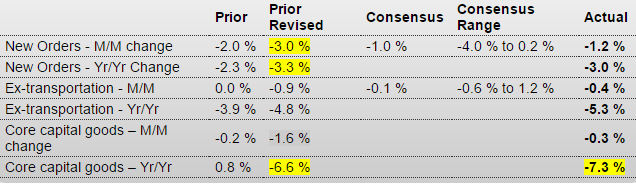
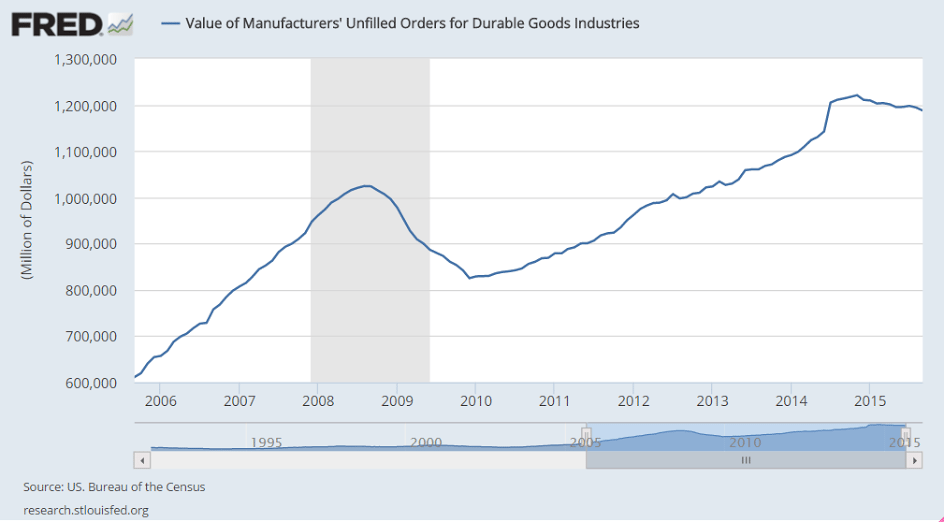
United States : Durable Goods Orders
Highlights
The factory sector is showing cracks with orders contracting slightly more than expected, down 1.2 percent in September with August’s contraction revised lower to minus 3.0 percent. Other readings are likewise weak with ex-transportation down 0.4 percent following a downward revised 0.9 percent decline in August and with core capital goods orders down 0.3 percent after falling a downward revised 1.6 percent in August.
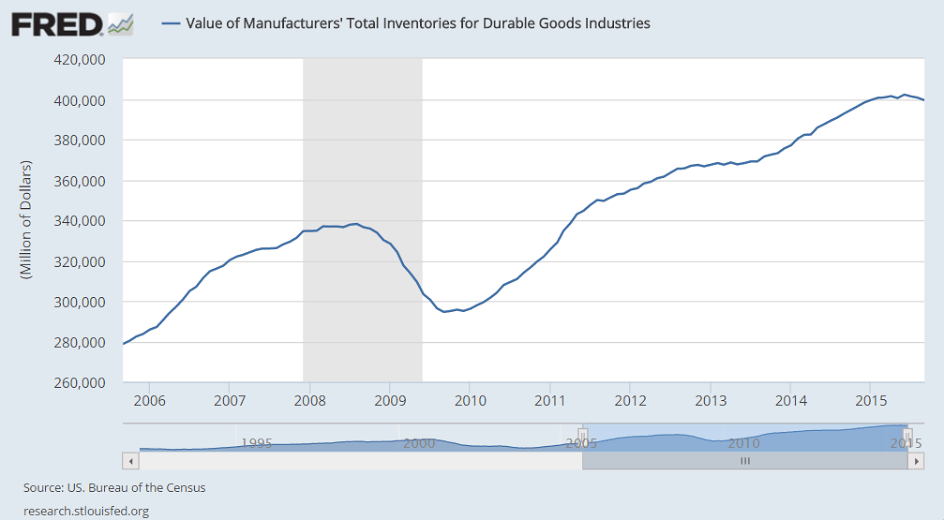
Other readings include a second straight and sharp 0.6 percent decline in unfilled orders and a third straight decline in inventories, down 0.3 percent which is the sharpest decline since May 2013. The decline in unfilled orders suggests that factories, lacking new orders, are working down backlogs while the decline in inventories points to growing caution in the business outlook. But factories are keeping up shipments which is good for GDP, up 0.2 percent after August’s 0.5 percent decline with core capital goods shipments up 0.5 percent after a 0.8 percent decline.
Motor vehicles are a positive in the report, showing a 1.8 percent gain in new orders and a 1.6 percent gain in shipments with both reversing similar sized declines in August. Also positive are electrical equipment and fabricated metals, with both perhaps getting a boost from construction, along with defense aircraft and defense capital goods.
Industries showing declines in new orders include primary metals, machinery, and computers & electronics. Orders for civilian aircraft fell 62 percent in September following a 23 percent decline in August.
This report falls in line with industrial production data where manufacturing in September slipped for the fourth time in five months. Weakness in exports is the balancing factor tipping the factory sector away from growth.
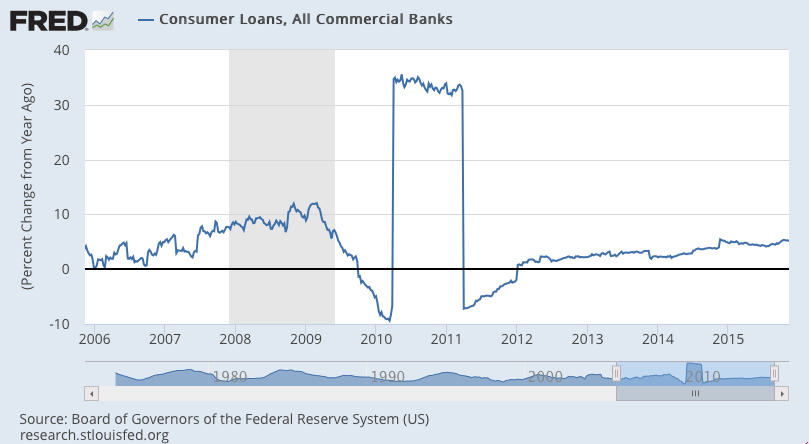
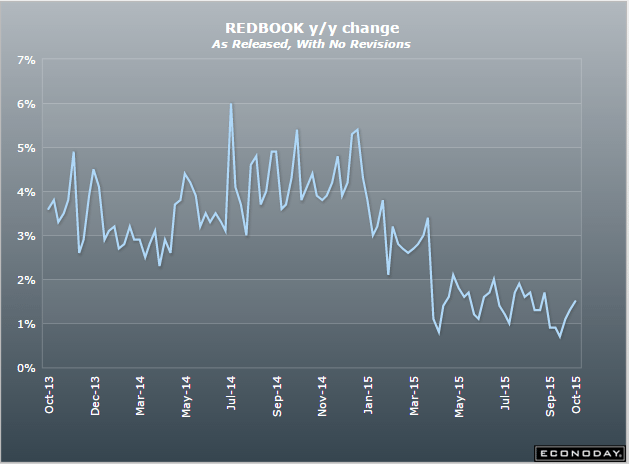
Redbook retail sales still growing at depressed rates:
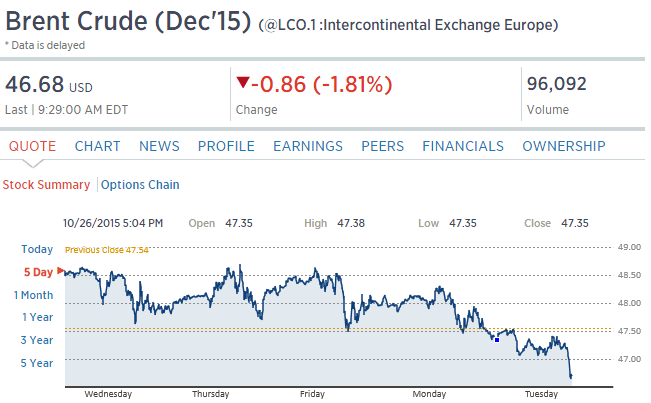
Price continues to fall as the increased Saudi discounts continue:
ECRI’s WLI Growth Index Declines Again and Remains In Contraction
ECRI’s WLI Growth Index which forecasts economic growth six months forward – declined and remains in negative territory. This index had spent 28 weeks in negative territory, then 15 weeks in positive territory – and now is in its tenth week in negative territory. Also discussed below is the coincident and lagging index which is in decline.
Rail Week Ending 17 October 2015: Contraction Continues
Week 41 of 2015 shows same week total rail traffic (from same week one year ago) and monthly total rail traffic (from same month one year ago) declined according to the Association of American Railroads (AAR) traffic data. Intermodal traffic modestly expanded year-over-year, which accounts for approximately half of movements. but weekly railcar counts continued in contraction.
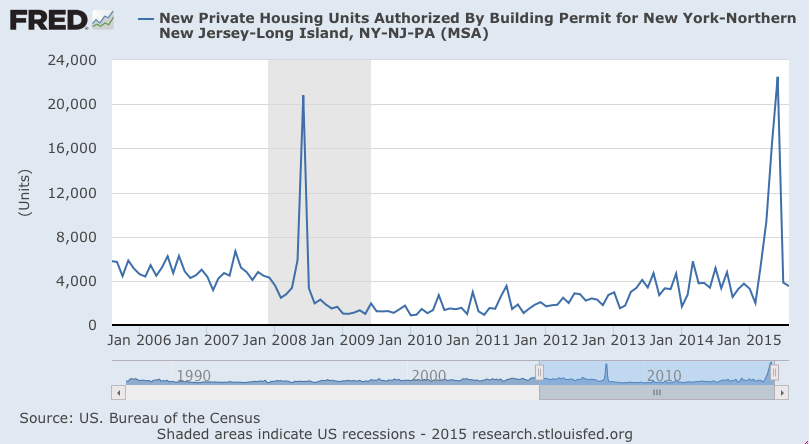
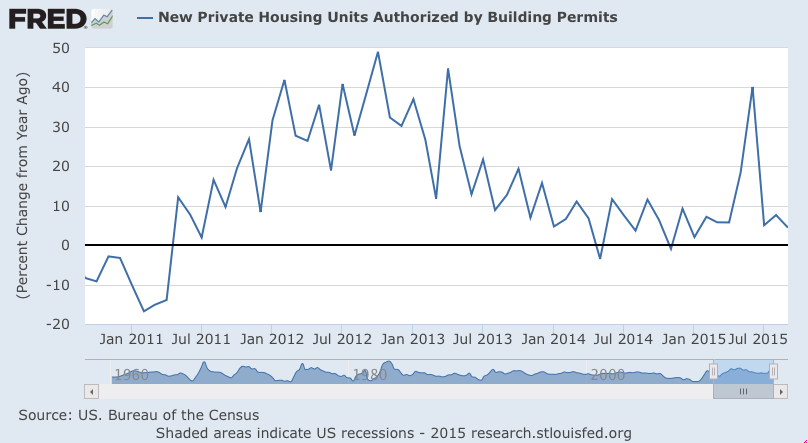
You can see the spike just before the NY tax break expired, followed by prior, lower levels of growth.
This is not a sign of an ‘acceleration’ in housing, or even a housing ‘recovery’:
This hasn’t updated yet: