Wholesale inventories, Small business index, Redbook retail sales

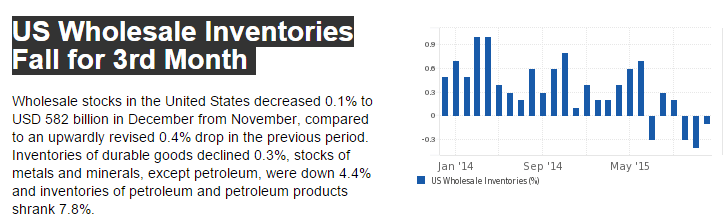
And another bad one as sales are falling just as fast as inventories:

Wholesale Trade
er-2-9-1
Highlights
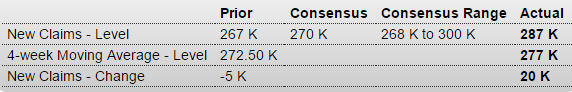
Wholesale inventories fell an as-expected 0.1 percent in December with November revised 1 tenth lower to minus 0.4 percent. Wholesalers have been liquidating inventories as sales have been falling, down 0.3 percent in the latest month following a 1.3 percent sales decline in November. And they’ve been successful, keeping down the stock-to-sales ratio at 1.32 the last two reports which is still however up noticeably from 1.24 in December 2015. The factory sector hasn’t been as successful keeping down inventories, showing a 0.2 percent rise in December. This sets the stage for December retail inventories which will be released with the business inventories report on Friday following the retail sales report.

er-2-9-2
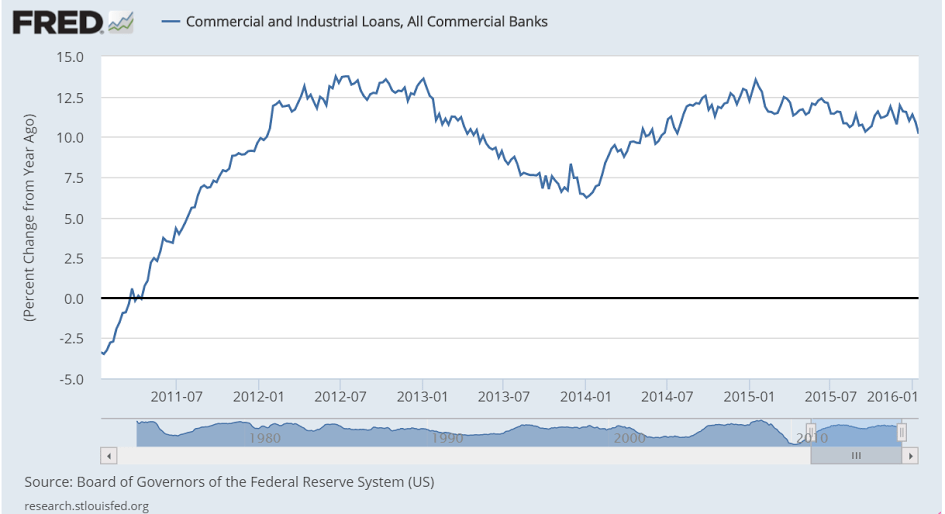
Been heading south ever since oil capex collapsed:
er-2-9-3

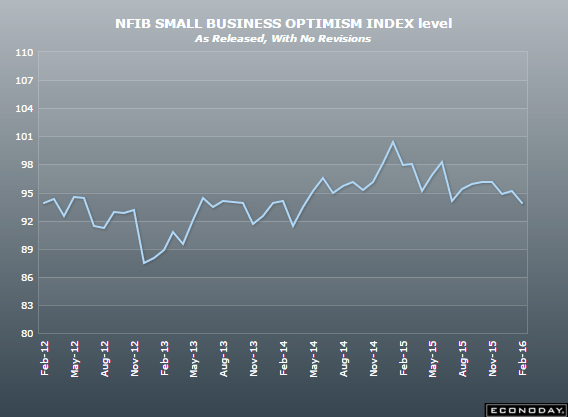
Small business optimism index fell back sharply in January, to 93.9 from December’s 95.2 and reflecting deepening pessimism over both the economic outlook and sales expectations. Plans to increase employment also came down but nevertheless remain solidly in the plus column. And two important components remain exceptionally positive, jobs hard to fill and plans to increase capital outlays with the latter pointing to future hiring and belying the negative expectations for the economy. But key negatives also include pessimism over earnings, a trend that doesn’t support hiring or business investment. The details are mixed to downbeat in this report, one that falls in line with the general tenor so far of January’s economic data.

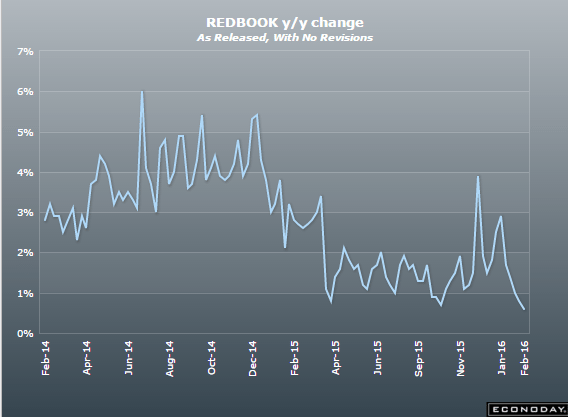
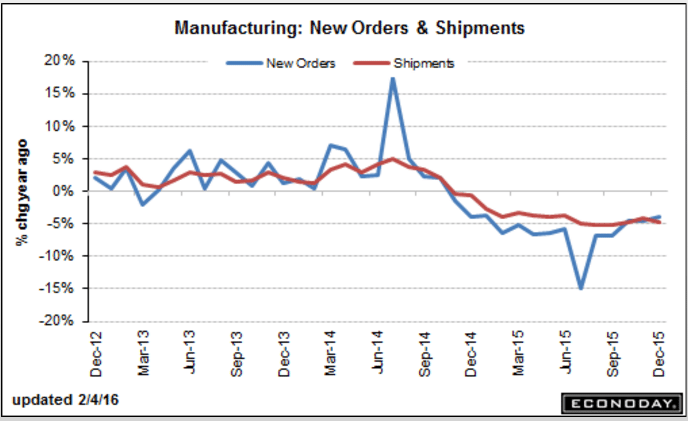
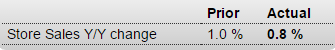
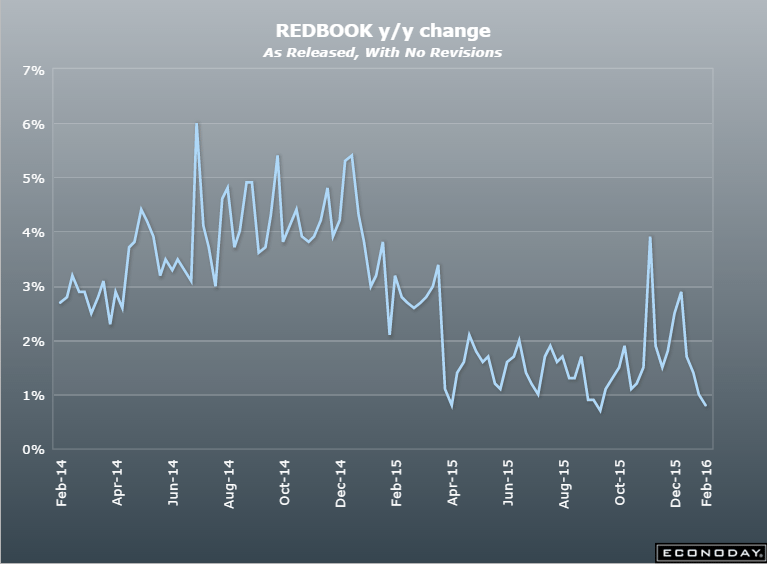
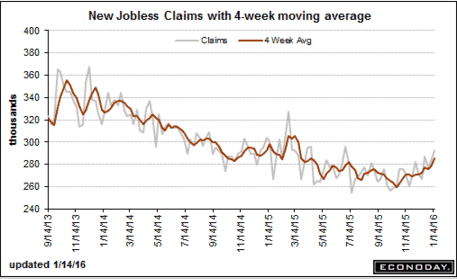
This keeps getting worse even as comps with last year get ‘easier’:
er-2-9-4

Productivity, Factory orders,Truck orders

As previously discussed, the numbers are showing that business is hiring more than output is increasing, which doesn’t seem to make sense to me.

That is, it wouldn’t surprise me to see this reconciled by a drop in hiring, or a downward revision to employment in general.

Productivity and Costs
er-2-4-1
Highlights
Flat output and a rise in hours worked combined to sink fourth-quarter productivity to an annualized rate of minus 3.0 percent. The Econoday consensus was minus 1.8 percent with the low estimate at minus 2.6 percent. Weak output together with a moderate 1.3 percent rise in compensation lifted unit labor costs to a plus 4.5 percent rate which is just at the consensus for 4.4 percent.

Lack of output, at only a plus 0.1 percent rate, is the weak baseline in this report. The rise in hours worked, at a sharp 3.3 percent rate, is the highest since fourth-quarter 2014 while, in a plus for profits but less for the inflation outlook, the rise in compensation is the lowest result since second-quarter 2014.

Year-on-year data are more favorable with productivity at plus 0.3 percent, still very weak, and labor costs at a less severe plus 2.8 percent.

The nation’s productivity has been soft for the last three years, posing questions for policy makers and underscoring the effects of full employment and limited investment in new technologies.

More bad:

Factory Orders
er-2-4-2
er-2-4-3

U.S. January Class 8 truck orders fell 48 percent on the year, preliminary data from freight transportation forecaster FTR showed, indicating that 2016 could be another weak year for truck makers.

FTR estimated that orders for the heavy trucks that move goods around America’s highways totaled 18,062 units in January. This follows on from a full-year decline in 2015 of nearly 25 percent to 284,000 units from 276,000.

“It is not looking to be a strong year,” for the market, FTR chief operating officer Jonathan Starks said in a statement.

Amid uncertainty over U.S. economic growth and a lackluster performance for retailers in the fourth quarter, trucking companies have been holding back on buying new models

Car sales, Redbook retail sales, Bank loans

This is being spun as a positive, when all I see is a chart showing the seasonally adjusted annual rate of sales peaked several months ago and is going down:

U.S. Light Vehicle Sales at 17.46 million annual rate in January

Based on an estimate from WardsAuto, light vehicle sales were at a 17.46 million SAAR in January.

That is up about 5% from January 2015, and up about 1.4% from the 17.2 million annual sales rate last month.
er-2-3-1
This graph shows the historical light vehicle sales from the BEA (blue) and an estimate for December (red, light vehicle sales of 17.46 million SAAR from WardsAuto).

This close to the consensus forecast of 17.5 million SAAR (seasonally adjusted annual rate).

The second graph shows light vehicle sales since the BEA started keeping data in 1967.
er-2-3-2
Vehicle SalesNote: dashed line is current estimated sales rate.

This was at expectations, and vehicle sales in 2016 are off to a solid start.

Highlights
Unit vehicle sales slowed going into year-end but moved higher in January, to a 17.6 million annual pace vs expectations for 17.4 and against December’s 17.3 million. Strength was centered in North American-made vehicles where the annual sales rate rose to 14.2 million vs expectations for only 13.6 million and vs 13.9 million in December. Sales of imports slowed to 3.4 million from 3.5 million. Strength on the domestic side of this report not only points to strength for vehicle manufacturing but also to strength for the motor vehicle component of the monthly retail sales report where results have been uneven. This report is another positive indication for the U.S. consumer.
er-2-3-3

Another bad report being spun as good:

Redbook
er-2-3-4
Highlights
The severe snowstorm that hit the Mid-Atlantic and Northeast held down same-store sales growth in the January 30 week, to plus a year-on-year 0.8 percent. This is the lowest weekly reading since October and, together with the 1.2 percent rate for the whole month, hints at another month of trouble for the government’s retail sales report. But the report focuses not on January but on February where it sees year-on-year sales finishing at a more respectable 1.4 percent. The major events for February are the Super Bowl, Valentine’s Day, and President’s Day.
er-2-3-5

Investors aren’t the only ones running for safety as the market tumbles and the economy wobbles.

Businesses, too, are indicating an unwillingness to take on risk as loan demand declined for the first time in about four years, according to the Federal Reserve’s Senior Loan Officer Survey released this week.

Demand for commercial and industrial loans has plunged in 2016, with declines happening across business sizes. Large- and medium-sized businesses had an 11.1 percent decline, while demand from small businesses fell 12.7 percent.

Maybe stocks aren’t buying the spin any more?
er-2-3-6

Claims, Philly Fed

Possible bottom and now moving higher:
er-1-21-1
This month’s negative reading doesn’t look so bad because the revised last month’s down so much…
;)

Philadelphia Fed Business Outlook Survey
er-1-21-2
Highlights
The factory sector continues to slow this month though, in good news, the rate of contraction is flattening out. The Philly Fed’s general business conditions index for January is minus 3.5, a little better than the Econoday consensus for minus 4.0 and the best reading since all the back in August. The new orders index likewise is improving, at minus 1.4 for the best reading since September. And shipments, for the first time also since September, are positive, at a strong 9.6.

But most readings in this report are in the negative column including employment, unfilled orders, the workweek, and also inventories where destocking is becoming more aggressive. And judging by the six-month outlook, down 5 points to 19.1 for the softest level since 2012, the destocking is defensive and intentional.

Price data are also negative but less so than prior months. And this is the clear theme from this report, that the factory sector may be beginning to level out following a very flat 2015 that was held down by weak global demand and weak energy markets.

er-1-21-3
er-1-21-4

Weather comment, oil capex reductions, NFIB small business index

This time the warm weather is cited for the weakness as utility spending fell. Yes, capitalism is about sales, and unspent income reduces sales, unless other agents spend more than their income, etc. etc.

And with the private sector in general necessarily pro cyclical, unspent income stories beg fiscal adjustments, which at the moment are universally out of style.

U.K. Industrial Output Plunges Most in Almost Three Years

By Jill Ward

Jan 12 (Bloomberg) — UK industrial production fell the most in almost three years in November as warmer-than-usual weather reduced energy demand.

Output dropped 0.7 per cent from the previous month, with electricity, gas and steam dropping 2.1 per cent, the Office for National Statistics said in London on Tuesday. Economists had forecast no growth on the month.

The data highlight the uncertain nature of UK growth, which remains dependent on domestic demand and services. After stagnating in October and falling in November, industrial production will have to rise 0.5 per cent to avoid a contraction in the fourth quarter.

Manufacturing also delivered a lower-than-forecast performance in November, with output dropping 0.4 per cent on the month. On an annual basis, factory output fell 1.2 per cent, a fifth consecutive decline.

To the same point, capital expenditures constitute spending that offsets unspent income, etc. And so without some other spending stepping up to replace this lost capex GDP goes nowhere, as previously discussed. This $90 billion cut is only one source of capex reductions:

Oil Plunge Sparks Bankruptcy Concerns

Jan 11 (WSJ) — As many as a third of American oil-and-gas producers could tip toward bankruptcy and restructuring by mid-2017, according to Wolfe Research. Together, North American oil-and-gas producers are losing nearly $2 billion every week at current prices, according to AlixPartners. American producers are expected to cut their budgets by 51% to $89.6 billion from 2014, according to Cowen & Co. In a biannual review by a trio of banking regulators, the value of loans rated as “substandard, doubtful or loss” among oil and gas borrowers almost quintupled to $34.2 billion, or 15% of the total energy loans evaluated. That compares with $6.9 billion, or 3.6%, in 2014.

Still trending lower since the oil capex collapse a little over a year ago:
er-1-12-1

EU growth, NY Fed consumer survey

A bit of growth in the EU supported by the low euro from the CB euro selling and consequent trade/current account surplus. However, without ECB euro selling the fundamentals will inevitably firm the euro until that growth component ceases. But meanwhile, watch for signs of ECB hawkishness:

Ever so slowly, the euro zone economy awakes

By Jeremy Gaunt

Jan 10 (Reuters) — Economic growth was running at an annual rate of 1.6 percent in the third quarter, roughly twice the average annual growth rate between 2003 and 2014 (itself dragged down by the sharp contraction of 2009). Unemployment has been falling fairly steadily. It was at 10.5 percent in November, which is high, but the lowest in more than four years and well below the 12 percent of 2013. In the first half of 2015, for example, big gun Germany’s export growth to China fell to just 0.8 percent and engineering exports shrank by 4.9 percent. Yet German gross domestic product (GDP) growth was running at 1.8 percent at last count even with the slide.

Latest from the NY Fed:
er-1-11-1
er-1-11-2

Saudi production

The Saudis post prices and let their clients buy all they want at the posted prices.

So their policy has been to discount the price of their oil vs benchmarks until their sales increase to meet their production capacity, which is reportedly 12 million bpd.

That means the price goes low enough to cause other suppliers to cut back, such as US shale producers, which translates into higher Saudi sales and output. Or demand has to increase.

Seems they haven’t made much progress so far, as the discounting policy continues:

sg2015123147596

Chicago PMI, Jobless claims

Way below consensus and way bad:

Chicago PMI
er-12-31-1
The Chicago Business Barometer contracted at the fastest pace since July 2009, falling 5.8 points to 42.9 in December from 48.7 in November

There was also ongoing weakness in New Orders, which contracted at a faster pace, to the lowest level since May 2009. The fall in Production was more moderate but still put it back into contraction for the sixth time this year. The Employment component, which had recovered in recent months, dropped back below the 50 neutral mark in December, leaving it at the lowest since July.
er-12-31-3

Jobless Claims
er-12-31-2
Highlights
Initial jobless claims unexpectedly jumped 20,000 to 287,000 in the December 26 holiday week, the highest level since the July 4 holiday week. The Econoday consensus expected an increase of 3,000 to 270,000. The 4-week moving average was up 4,500 to 277,000 in the December 26 week, the highest since the July 18 week. The level of continuing claims increased 3,000 to 2.198 million in the December 19 week. The seasonally adjusted insured unemployment was unchanged at 1.6 percent in the December 19 week. It should be noted that readings in this report can be volatile during the holiday weeks.
er-12-31-4

HNY!