Employment report, consumer credit

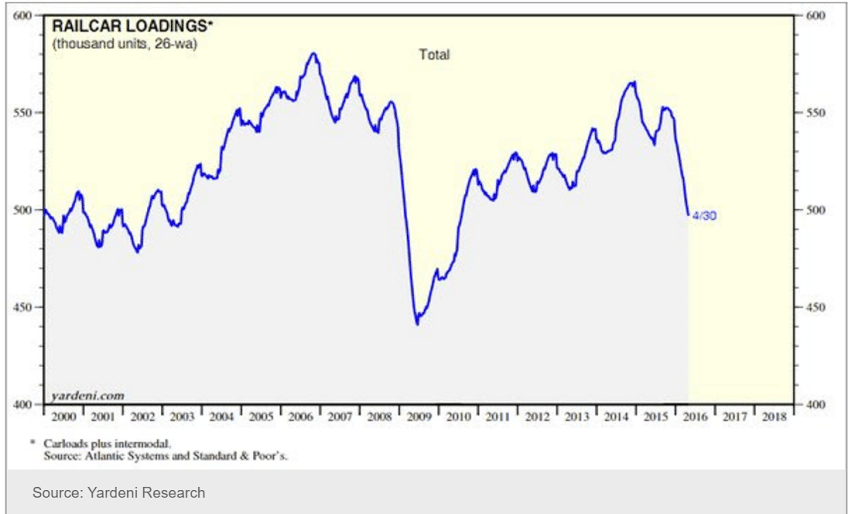
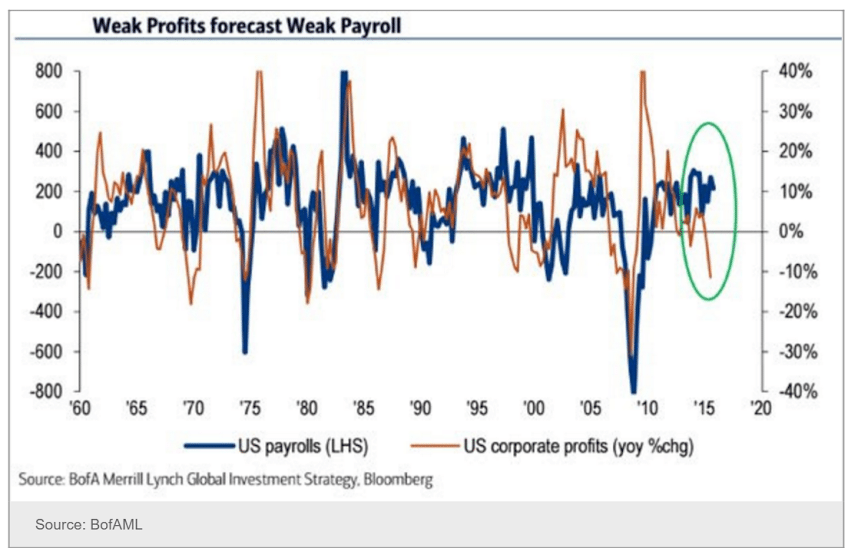
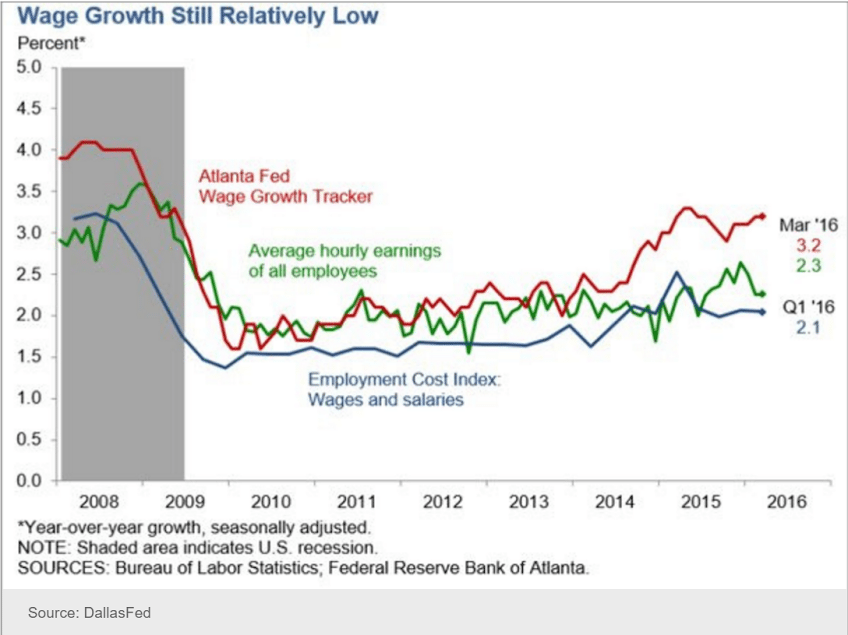
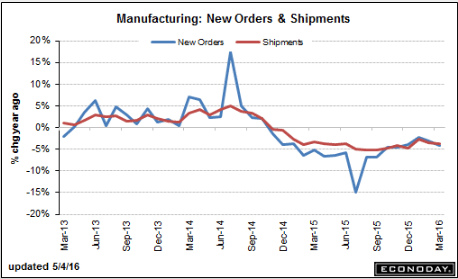
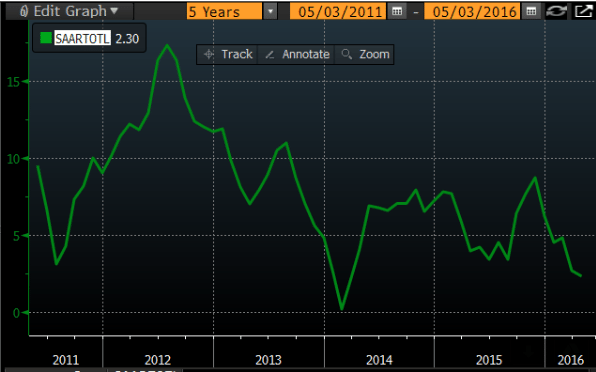
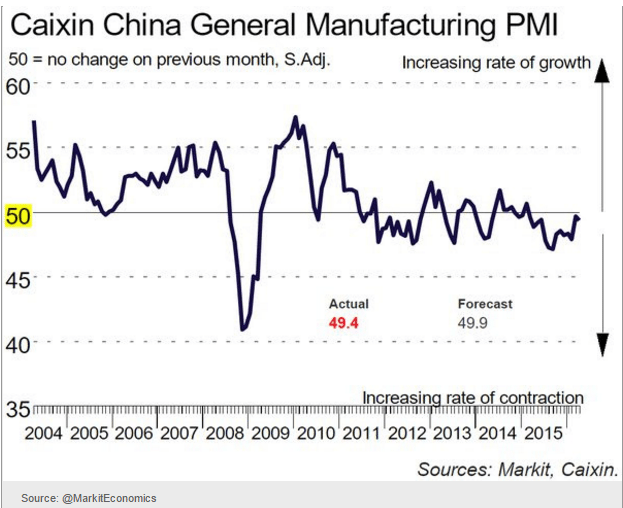
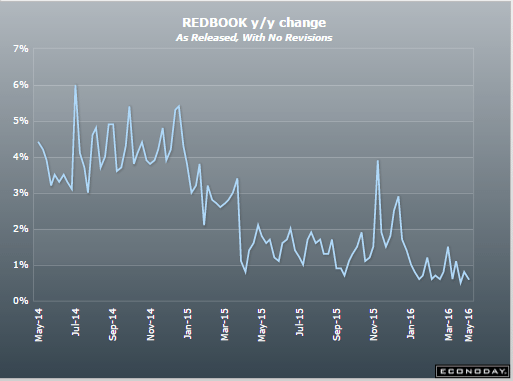
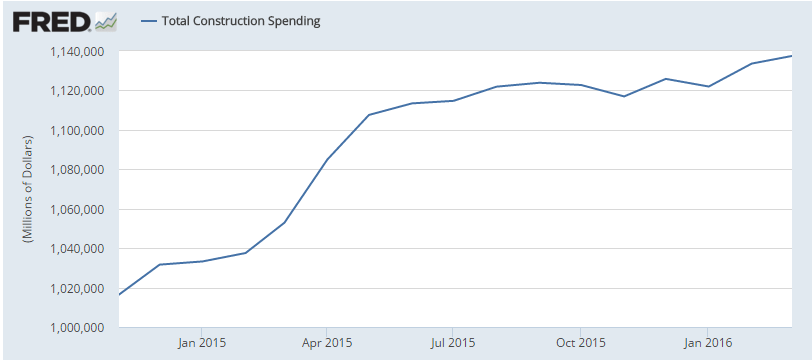
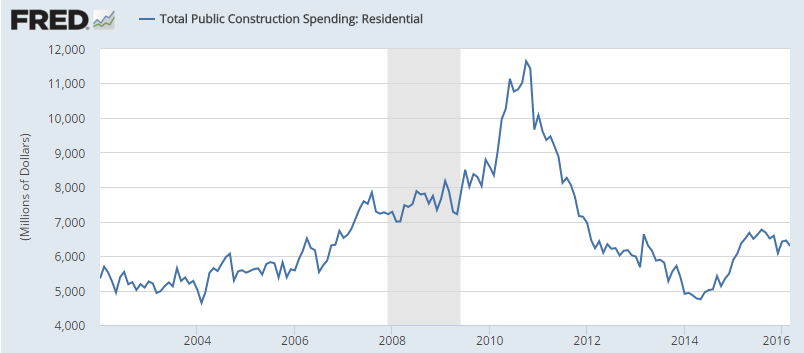
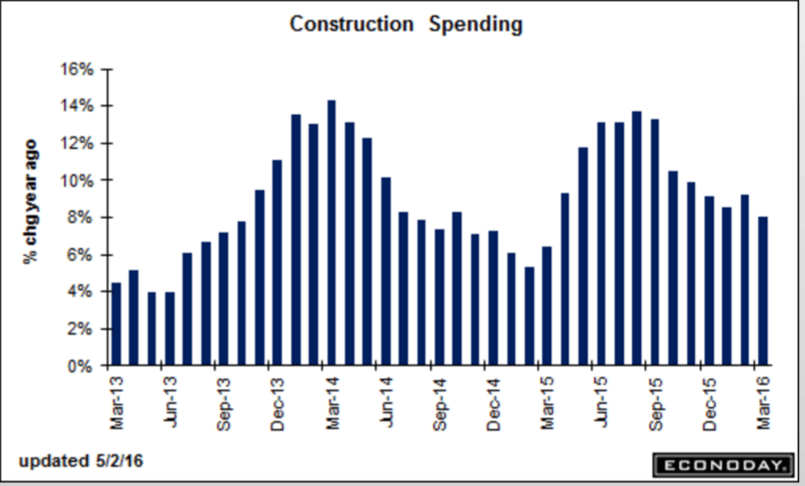
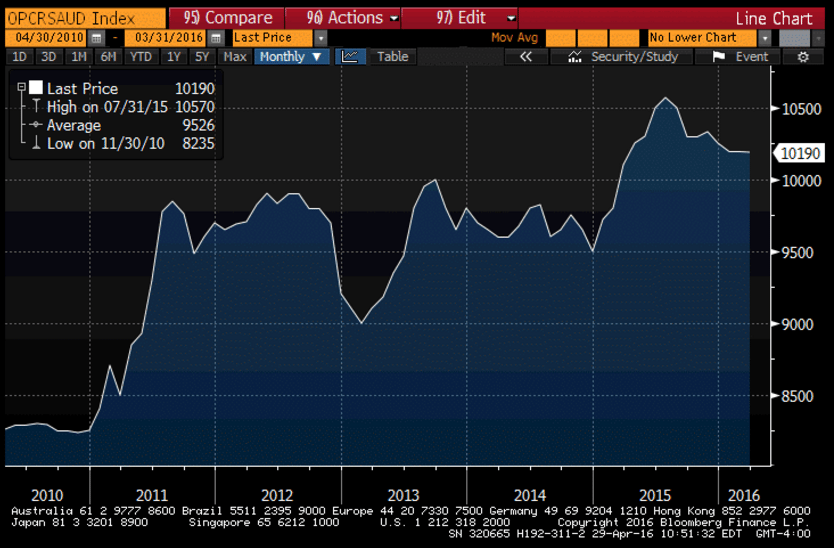
The chart shows the year over year and ongoing deceleration that in general began when oil capex collapsed.

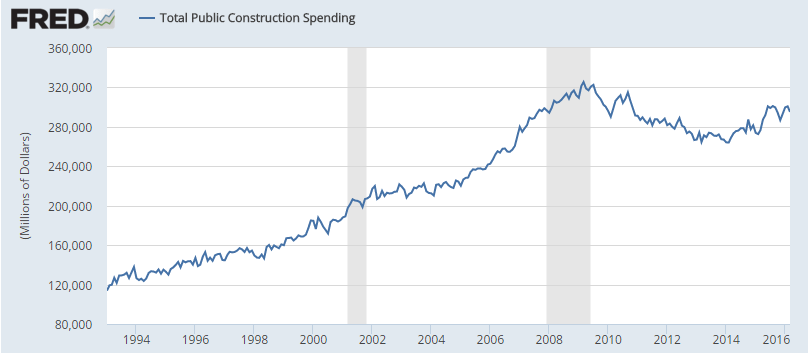
Nor will there be a reversal until after deficit spending increases- public or private- and I see no evidence of that happening:

Employment Situation
er-5-8-1
Highlights
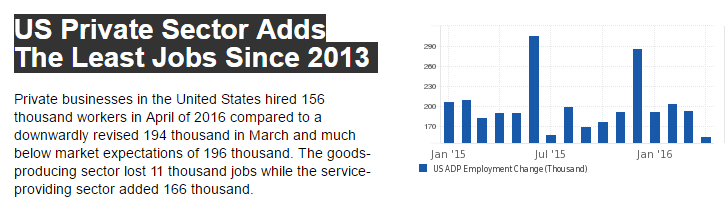
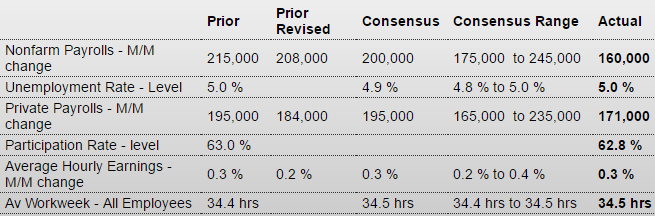
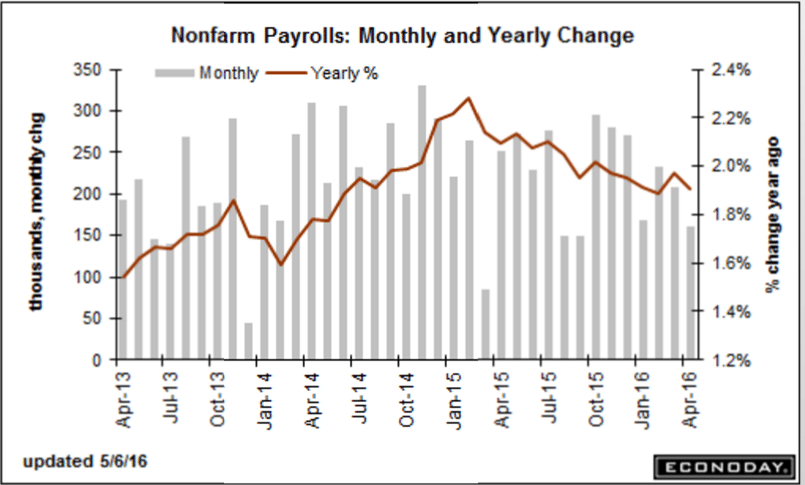
Add employment to those reports showing weakness, at least moderate weakness as nonfarm payrolls rose a lower-than-expected 160,000 in April. Revisions are minor, down a combined 19,000 in the two prior months with March now at 208,000. Government is a weak spot in April, down 11,000, with retail also showing weakness, down 3,000 after a series of outsized gains.

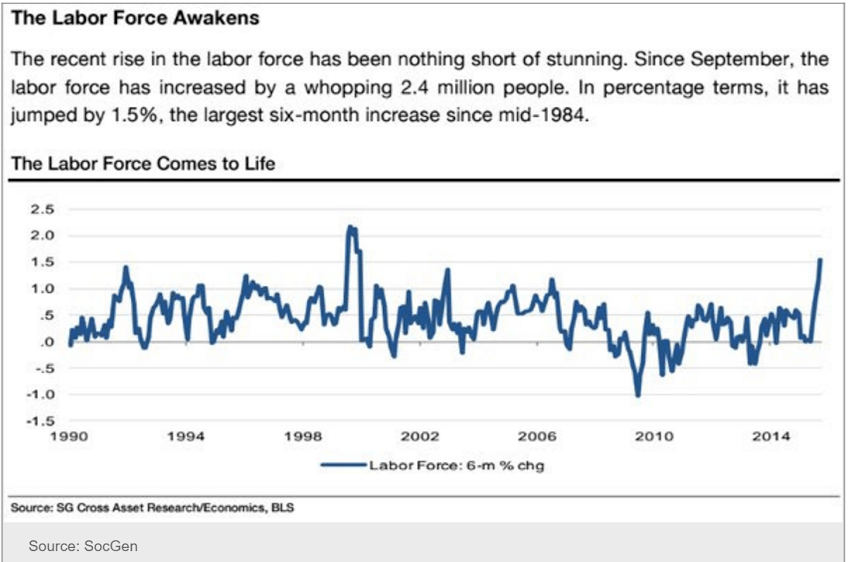
The unemployment rate is unchanged at 5.0 percent but the size of the labor force did fall in this reading. And the participation rate, which had been jumping, slipped 2 tenths to 62.8 percent.

Earnings are a positive, up 0.3 percent in the month with the year-on-year rate back on the climb at 2.5 percent for a 2 tenths gain. The workweek is also a positive up 1 tenth to 34.5 hours.

Turning back to industry sectors, mining extended its long trail of contraction with a 7,000 decline. But there is definitely strength especially for the closely watched professional & business services reading, up a very strong 65,000 and pointing to the need for additional permanent hiring in the months ahead. The temporary help services subcomponent of this reading is up 9,000 for a second month. Financial activities also show strength, up a very solid 20,000 with manufacturing back in the plus column but not by much with a 4,000 gain and reflecting a snap-back for the auto industry.

There’s give and take in the April data especially for labor participation which, however, is still trending higher, at least modestly. Employment is still the central strength of the economy but less so in what is less than a gangbuster opening to the second quarter. Though there’s still one more employment report to go ahead of the June FOMC, today’s report lowers whatever chances there are for a rate hike. Note that the ongoing strike by 40,000 Verizon workers do not appear to have affected April’s data.

er-5-8-2
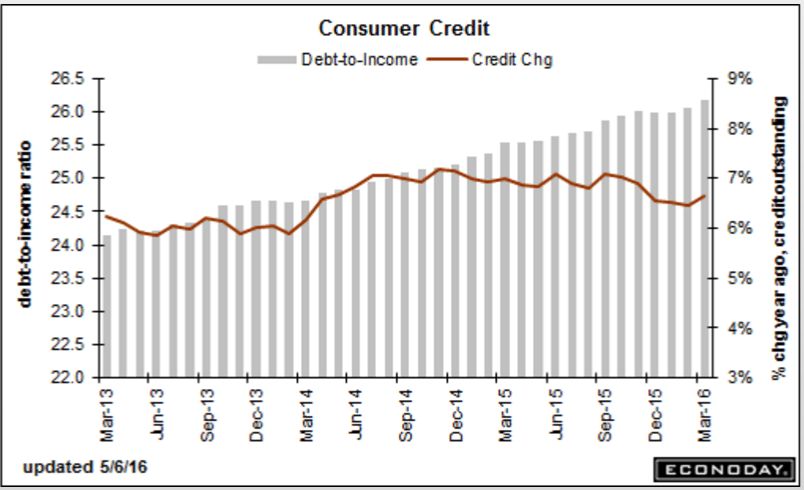
Up more than expected for the month, but the year over year didn’t move much. And note last month was revised down, so in any case best to withhold judgement regarding this series for at least a month. And a jump in borrowing can also indicate a fall off in income, particularly with retail sales growth as low as it is, with consumers borrowing to make ends meet. And check out how the debt to income level, also shown on the chart, continues to rise:
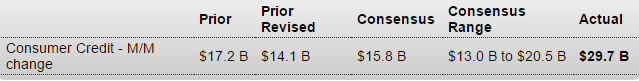
Consumer Credit
er-5-8-3
Highlights
The consumer may be showing limited enthusiasm for spending but certainly was borrowing in March. Consumer credit rose $29.7 billion in a surge that makes up for several months of prior weakness and includes a very strong $11.1 billion gain for revolving credit, indicating less reluctance to run up credit cards. Non-revolving credit rose $18.6 billion and once again reflects student loans and vehicle financing. The monthly headline is the strongest since a break in this series 5 years ago while the gain for the revolving component is the strongest since a prior break 10 years ago. The willingness to borrow hints at improved consumer confidence in the general outlook and reflects the strength of the labor market.

er-5-8-4

Euro reserves, Rail week, St. Louis Fed, China, Profits and Payrolls

The euro level is in dollar terms, but in any case, as previously discussed, the chart shows that there was an exit from the euro when the ECB initiated its aggressive interest rate and QE policies. And the way I see it it was that selling that weakened the euro, not anything ‘fundamental’:
er-5-6-16-1

Rail Week Ending 30 April 2016: Rail Contracted 11.8 Percent From Same Month One Year Ago

Week 17 of 2016 shows same week total rail traffic (from same week one year ago) declined according to the Association of American Railroads (AAR) traffic data. All rolling averages moved deeper into contraction.

er-5-6-16-2

Negative Interest Rates: A Tax in Sheep’s Clothing

The Development Bank has been stepping up its ‘off balance sheet deficit spending’:
er-5-6-16-3
er-5-6-16-4

UK, health care costs, US labor force

er-5-5-16-1
As discussed back when the law was first proposed, this version of ‘moral hazard’ renders the entire program unworkable and to the best of my knowledge and understanding there is no ‘fix’:

Health Insurers Struggle to Offset New Costs

May 4 (WSJ) — Insurers have begun to propose big premium increases for coverage next year under the 2010 health law. The companies also have detailed the challenges in their Affordable Care Act business in a round of earnings releases. The health law instigated a sweeping overhaul to the way insurance is priced and sold in the U.S. Insurers can’t deny coverage to consumers with risky medical histories, or charge them more for plans. A number of popular insurers say the enrollees who bought plans through the exchanges have had higher health costs than they originally predicted—when they knew less about the impact of the law.

Seems to me they’ve always been there, but for one reason or another just now being ‘counted’?

And seems to me there are lots more to come, as it’s always looked to me that the decline in the participation rate was suspect. If so, this means unemployment has, all along, been pushing 9-10%:
er-5-5-16-2
er-5-5-16-3
And this is exactly what you would expect if headline unemployment was 10%:
er-5-5-16-4

Saudi pricing, layoffs

If true, the $1.10 increase in the differential for Asia is substantial.

However the other, much smaller adjustments are not material, so it’s hard to say from this information whether or not this is a policy move designed to stabilize prices at current levels:

(Bloomberg) — Saudi Aramco raised prices for most crude grades sold to Northwest Europe, Mediterranean next month while lowering prices for most grades it sells to U.S.

  • Official pricing statement confirms increased prices for Asia reported earlier today by Bloomberg
  • Differential for Arab Light crude sold to U.S. kept unch at 35c/bbl premium to ASCI benchmark
    • Other grades sold to U.S. all lowered by 20c m/m, to $2.40 premium for Extra Light, $1.25 discount for Medium, $1.75 discount for Heavy
  • Light crude to NWE raised 15c to discount of $4.45 versus ICE Bwave marker; other grades raised except Extra Light
  • Light crude to Mediterranean raised 25c to discount of $3.95 versus ICE Bwave marker; other grades raised except Extra Light

Saudis Said to Boost Oil Pricing for Asia by Most in 14 Months

By Serene Cheong

May 5 (Bloomberg)

Arab Light said to be set at 25 cent premium to Oman-Dubai
That’s strongest differential for grade since September 2015

Saudi Arabia was said to raise its pricing for June oil sales to Asia by the most since April 2015, in a sign that the world’s biggest exporter is expecting demand to recover as the global crude market rebalances.

State-owned Saudi Arabian Oil Co. increased its official selling price for Arab Light crude to Asia by $1.10 a barrel to 25 cents more than regional benchmarks Oman and Dubai, said people with knowledge of the matter who asked not to be identified because the information is confidential. The company, known as Saudi Aramco, was predicted to raise its pricing for the grade by 65 cents a barrel, according to the median estimate in a Bloomberg survey of five refiners and traders.

Looks like this is continuing to trend higher, post oil capex collapse:
er-5-5-16-5

Mtg purchase apps, ADP, Trade, Factory orders

Same story, depressed and growing too slowly to matter:

MBA Mortgage Applications
er-5-4-16-1
Highlights
Purchase applications for home mortgages managed to rise 1.0 percent in the April 29 week, but refinancing continued to decline, down 6.0 percent after falling 5.0 percent in the prior week. Though purchase applications are 13 percent higher than the same week a year ago, the year-on-year gain has narrowed sharply from the 30 percent gains seen as recently as March. Rates crept slightly higher, with the average 30-year mortgage for conforming loans ($417,000 or less) up 2 basis points to 3.87 percent.

Weak:
er-5-4-16-2

ADP Employment Report
er-5-4-16-3
Highlights
Consumer spending and economic growth are slowing and now the labor market, at least based on ADP’s estimate, is softening. ADP sees private payrolls rising only 156,000 in April for what would be one of the weakest prints of the economic cycle and the lowest since 142,000 in February 2014. ADP, whose reputation as a leading indicator isn’t perfect, has nevertheless been on a 4-month hot streak and today’s report is certain to raise talk of trouble for Friday’s employment report.

er-5-4-16-4
And here’s the year over year growth chart. Can you spot the point where oil capex collapsed? ;)
er-5-4-16-5

Global trade continues its collapse:

er-5-4-16-6
Highlights
The nation’s trade gap narrowed in March but, unfortunately, is not a positive for the economic outlook. The gap came in at $40.4 billion in March vs a revised $47.0 billion in February and largely reflects a downgrade for imports which fell 3.6 percent in the month vs the prior month’s 1.3 percent rise. Contraction in imports, though a positive for the gap, is however a negative indication for domestic demand, especially in this report as consumer goods show unusual weakness. And indications on foreign demand are also negative with exports, despite the positive effects of this year’s depreciation in the dollar, slipping 0.9 percent vs February’s 1.1 percent rise.

Imports of consumer goods fell a very steep $5.1 billion in the month followed, in yet another major negative, by core capital goods which fell $1.6 billion. The former points to weak consumer demand and the latter points to weakness in business expectations. Oil was not a factor on the import side, averaging $27.68 per barrel vs February’s $27.48 and making for a total petroleum deficit of $3.0 billion vs February’s $3.5 billion deficit.

Weakness on the export side is also concentrated in consumer goods, down $1.6 billion in the month, and includes a separate $0.7 billion decline for autos. Industrial supplies are also down. One positive is a $1.3 billion rise in core capital goods which, however, follows a long string of declines. A solid positive is a further gain for service exports, up 0.5 percent in the month and generally reflecting demand for the nation’s technical and managerial expertise.

The nation’s gap with China, reflecting the decline in imported consumer goods, narrowed very sharply, to $20.9 billion in March from February’s $28.1 billion. The narrowing with China offset widening gaps with the EU, at $13.1 billion, and with Mexico, at $5.4 billion, and also with Japan, at $6.7 billion.

Trade data are always very revealing, in this case pointing unfortunately to declining cross-border demand and showing little benefit, at least so far, from this year’s decline in the dollar.

Factory orders and shipments continue in negative territory on a year over year basis:
er-5-4-16-7
A bit of improvement here but still looking like growth in this sector will be lower this year than it was last year, and may still be trending lower:
er-5-4-16-8

Car sales, Home prices

Car sales came in about as expected.

Note the year over year 3 month moving average continues its deceleration, and so far not adding as much to growth this year as last year:
er-5-3-5
er-5-3-6
er-5-3-7

The luxury home market may be losing some of its luster.

Average sales prices for homes listed at $1 million or more fell 1.1 percent in the first quarter compared with a year earlier, marking the biggest decline in more than two years, according to Redfin.

The decline at the top marks a stark contrast with the broader housing market, which continues to gain strength. The bottom 95 percent of the housing market saw prices jump 4.7 percent in the first quarter compared with a year ago.

Sales volume of homes priced at $1 million or more rose 4.9 percent — marking slower growth than the rest of the market, where sales volume grew 6 percent.

China, Redbook retail sales, UK manufacturing, yen comments

Still in negative territory:
er-5-3-1
Still stone cold dead:
er-5-3-2
er-5-3-3
Exporters have serious clout over there.

Intervention on their behalf would be no surprise:

Japan exporters stand to take nearly $10bn hit from rising yen

The yen’s sharp appreciation threatens to undercut profits at major Japanese exporters by more than 1 trillion yen ($9.37 billion) this fiscal year, outweighing any benefits of a stronger home currency for some companies, estimates by The Nikkei show.

Even at exchange rates of 110 yen to the dollar and 125 yen to the euro — levels on which many companies are basing their fiscal 2016 earnings estimates — 25 of the country’s biggest exporters, including Toyota Motor and Komatsu, would see their combined operating profits fall 1.14 trillion yen on the year owing to currency movements alone.

er-5-3-4

CNY/EUR, construction spending

Good chance China is now rebuilding euro reserves sold when they panicked over negative rates, qe, etc. In fact, they could now be targeting the euro area for export growth:
er-5-2-16-1
This came out this am. Note how construction flattened in the middle of last year when the NY tax incentives expired, and so far there is no sign of a repeat of last year’s growth for this year:
er-5-2-16-2
When it comes to downsizing govt, Obama looks to have been the best ever. What more could the Tea Party ask for?
er-5-2-16-3
er-5-2-16-4
er-5-2-16-5
er-5-2-16-6

ISM manufacturing, Construction spending, PMI manufacturing index

Another worse than expected report, and now it’s been over a year since it all started going bad, even as analysts continue to find reasons to be optimistic that have yet to pan out:

ISM Mfg Index
er-5-2-1
Highlights
April’s 50.8 for the ISM manufacturing index may be moderately below expectations for 51.5 but details in the report are positive. New orders did slow by 2.5 points but the level at 55.8 still points to a very solid rate of growth. New export orders, offering positive evidence on the effects of the lower dollar, are also positive, unchanged at 52.5 which isn’t dramatically above breakeven 50 but is still very solid for this reading and the best since December 2014. Production did slow 9 tenths but at 54.2 is also more than respectable. Backlog orders are still rising, though just barely at 50.5, but this along with March’s 51.0 are the best two months for this reading also since December 2014.

Now the weaknesses in the report, led by employment which did rise 1.1 points but is still below 50 at 49.2. Supplier deliveries, down 1.1 points at 49.1, pulled the composite index lower in the month and likely reflect lack of inventories at suppliers. And ISM’s sample continues to be very defensive regarding inventories with both raw materials and finished goods in accelerating contraction. Prices paid, at 59.0 for a sharp 7.5 point gain, reflects higher oil-related costs. There are no indications in this report on selling prices but other readings, including from this morning’s April PMI, have been negative.

But there’s reasons for optimism in this report centered entirely where it must be — in orders.

er-5-2-2
As per the chart, the year over year growth rate continues to decline, meaning this year’s construction activity won’t be adding as much to growth as last year’s did:

Construction Spending
er-5-2-3
Highlights
Home sales may be puttering along but construction spending nevertheless remains one of the strongest reports on the calendar. Construction spending did inch 0.3 percent higher in March, which is lower than expected, but February is now revised sharply higher, from a 0.5 percent decline to a 1.0 percent gain. Gains for March and February are positives for near-term momentum though they are offset by a sharp downward revision in January to minus 0.3 percent from plus 2.1 percent.

Back to March, residential spending rose 1.6 percent driven by gains for multi-family homes with single-family homes flat. The latter is a disappointment but does follow a trend of steady strength in prior reports.

Non-residential spending rose 0.7 percent in March led by transportation and including a respectable gain for manufacturing, one that may hint at better results for capital spending. Public spending on educational building and on highways is also up though Federal spending remains weak and state & local spending, which has been strong, fell in the month.

Year-on-year, total construction spending is up 8.0 percent, which includes a 7.8 percent gain on the residential side and a 9.3 percent gain on the non-residential side. These are down from 10 percent rates in prior reports but are still very hard to match anywhere else in the economy.

er-5-2-4
Also below expectations and not good:

PMI Manufacturing Index
er-5-2-5
Highlights
The manufacturing sector has started out the second quarter completely flat, based at least on the April PMI which fell 7 tenths to 50.8. New orders did rise modestly in the month but that’s the only good news in the report. Export orders, contracting at the fastest pace in more than a year, are not showing any lift yet from the lower dollar. And higher oil prices are not helping capital spending in the energy sector which remains a major negative for the sample. Output is flat, backlog orders are in contraction for a third straight month, and employment has completely stalled. And manufacturers continue to work down inventories as much as possible. Prices for raw materials, reflecting higher costs for oil-related products, did rise but not selling prices which are decreasing further. This report isn’t closely watched but the ISM manufacturing report is, and similar results for ISM, which will be posted at 10:00 a.m. ET, could shake the U.S. outlook and perhaps global markets with it.

Saudi production, GDP comment, rig count

Saudi production remains well below their claimed 12 million bpd current max capacity, as they continue to set price and let sales and output float.

Market action suggest they have altered their posted prices, but so far publicly available information doesn’t indicate a change in pricing policy. If so, the latest move up in prices will prove temporary:
er-5-1-16-1
er-5-1-16-2

The American Consumer is Doing Less to Support GDP Growth

By Rick Davis

Summary and Commentary

Although the headline remained positive, this is not a report that shows a robust economy. Among the troubling aspects of the report:

The growth rate for consumer spending took another significant hit, dropping substantially for the third consecutive quarter. In fact, the growth rate for consumer spending on goods was barely positive, at a miserable +0.03%. And non-discretionary spending on health care and housing provided most of the remaining growth in consumer services spending.Private investment contracted for the first time since the first quarter of 2011.Exports went deeper into the red.

Looking at the past three quarters as a group, we can see a slow-motion slide into either stagnation or contraction. It is truly sad when stagnation looks to be the better alternative.

This continues to fall. Production is already declining and this means more of same, which means oil imports will continue to rise, adding to the US trade deficit and increasing that fundamental source of dollar weakness. And while the higher prices add to the cost of imported oil, the prices aren’t high enough for additional capital expenditures. So you might say we’re in the ‘sour spot’ where the higher price is a negative for GDP until it gets high enough for capex to increase. But with the Saudis still firmly in control of price doesn’t seem to me that’s likely to happen?

Baker-Hughes Rig Count
er-5-1-16-3
Highlights
The Baker Hughes North American rig count is down 14 in the April 29th week to 457. The U.S. rig count is down 11 at 420 and is down 485 rigs from last year. The Canadian rig count is down 3 rigs from last week to 37 and, compared to last year, is down 42 rigs.

er-5-1-16-4