Redbook retail sales, Q1 corporate profits revision, Q1 GDP revision, Brexit chart, Richmond Fed, Consumer confidence

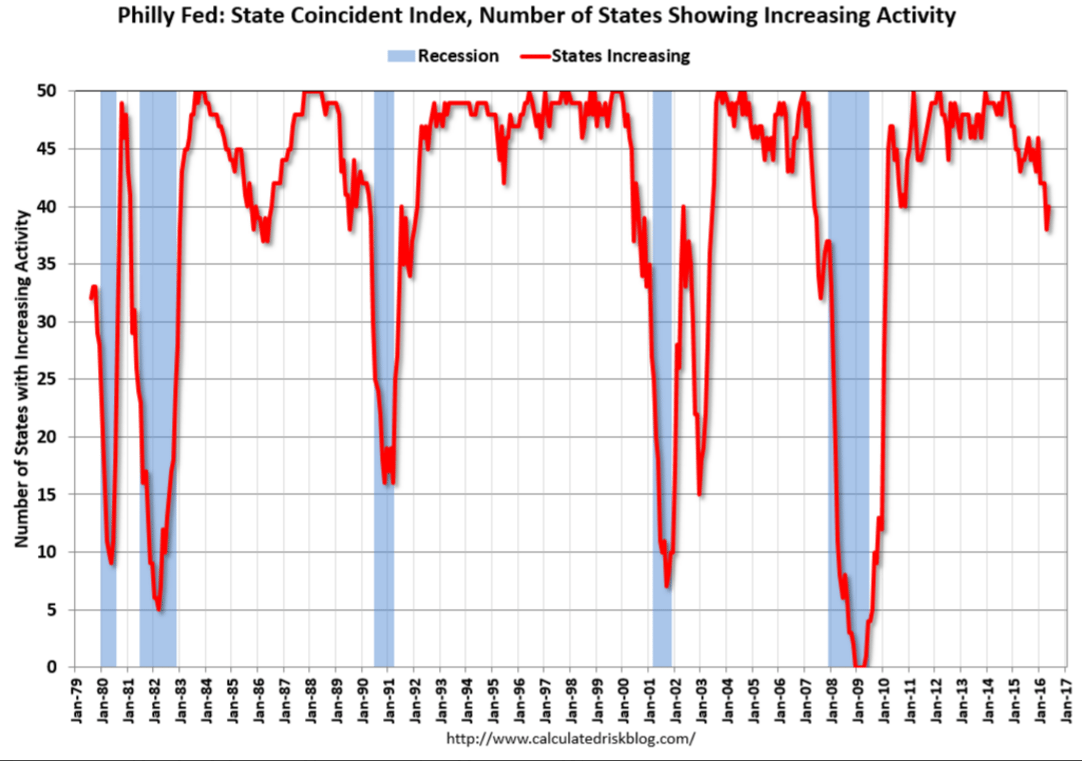
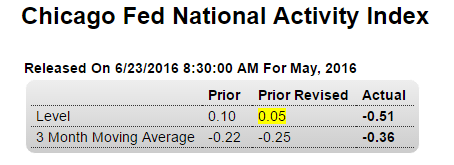
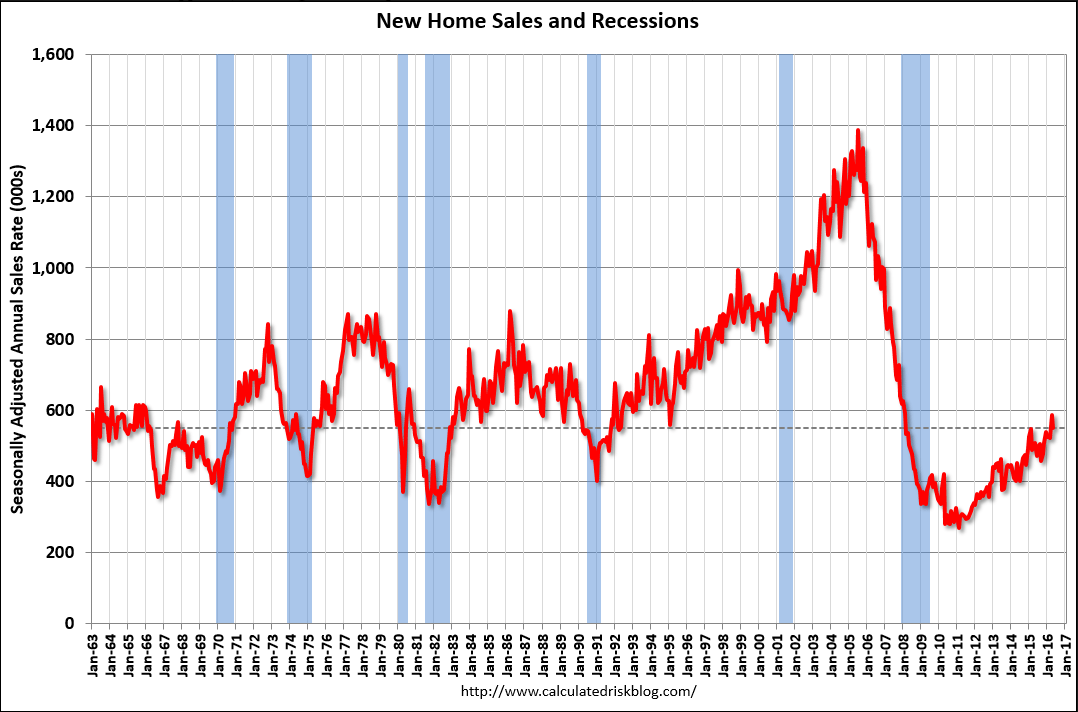
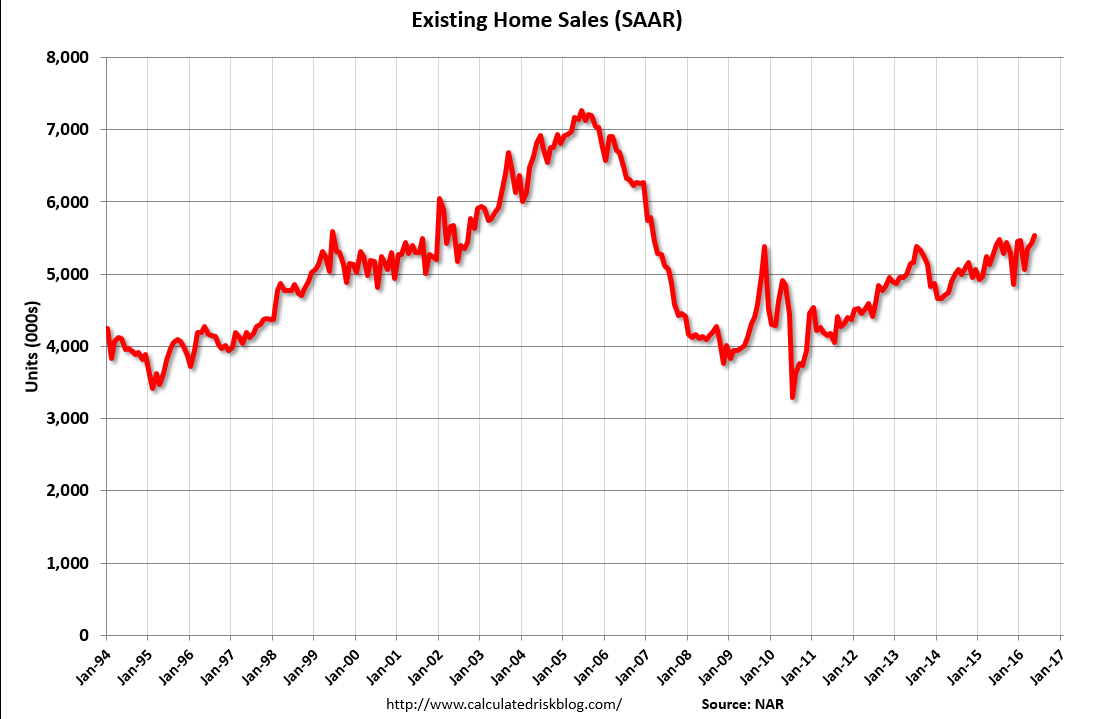
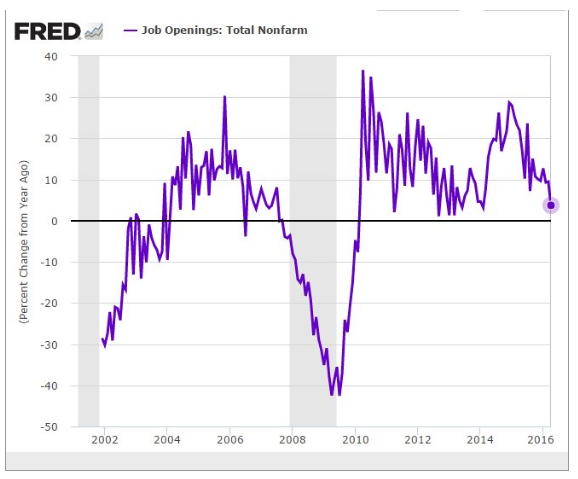
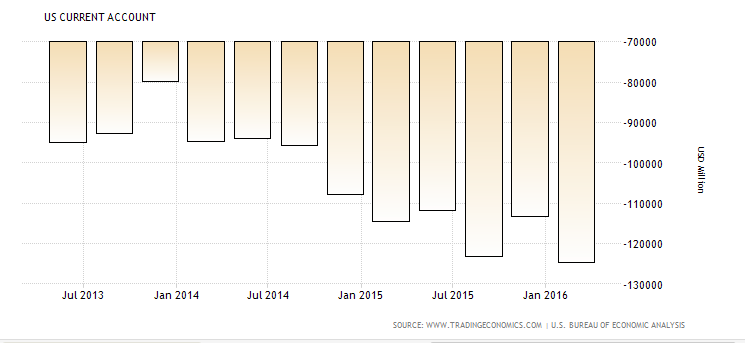
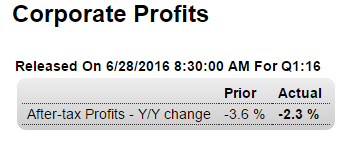
Still at recession levels:
6-28-2
6-28-3

Highlights
Corporate profits sank in the first quarter, revised to minus 2.3 percent year-on-year vs the initial estimate of minus 3.6 percent. Profits are after tax without inventory valuation or capital consumption adjustments.

6-28-4
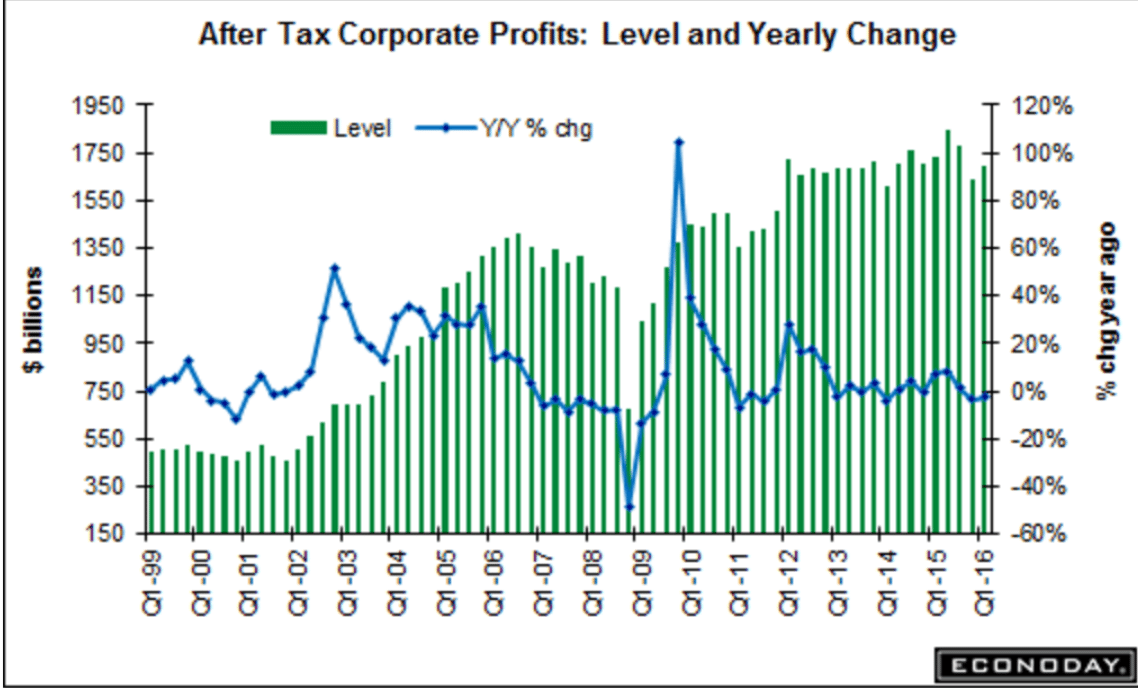
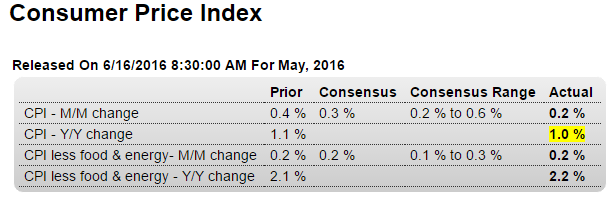
Revised up mainly due to residential investment, which isn’t looking so good in q2. And the downward revision to personal consumption weakens the ‘resilient consumer’ narrative, especially with employment softening in q2. Also, prices a bit softer than previously reported:
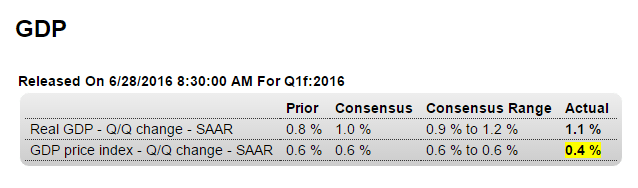
6-28-5

Highlights
Strength in net exports and less weakness in nonresidential fixed investment gave a boost to first-quarter GDP which rose 1.1 percent in the 3rd estimate vs plus 0.8 percent for the second estimate. Net exports added more than 1 tenth to GDP as exports rose slightly in the quarter and imports fell. An upward revision to software helped shave the negative contribution from nonresidential investment by 2 tenths to 6 tenths. On the downward side, the positive contribution from personal consumption expenditures was lowered by nearly 3 tenths to 1 percentage point as service spending was cut. Inventories were little changed in the revision, subtracting 2 tenths from GDP which is welcome news as inventories are poised to be restocked. Residential investment was a main positive in the quarter, adding 5 tenths to GDP. Early estimates for second-quarter GDP are running at about 2 percent, a more respectable rate but still far from robust especially with the third-quarter outlook clouded by Brexit.
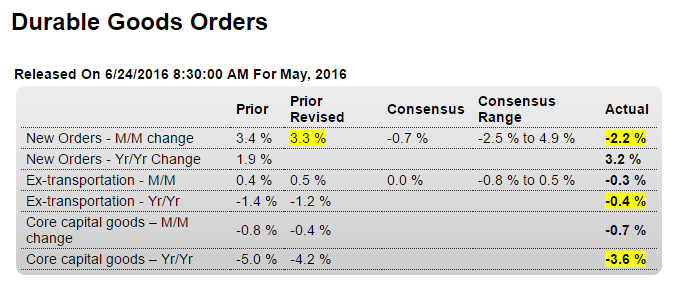
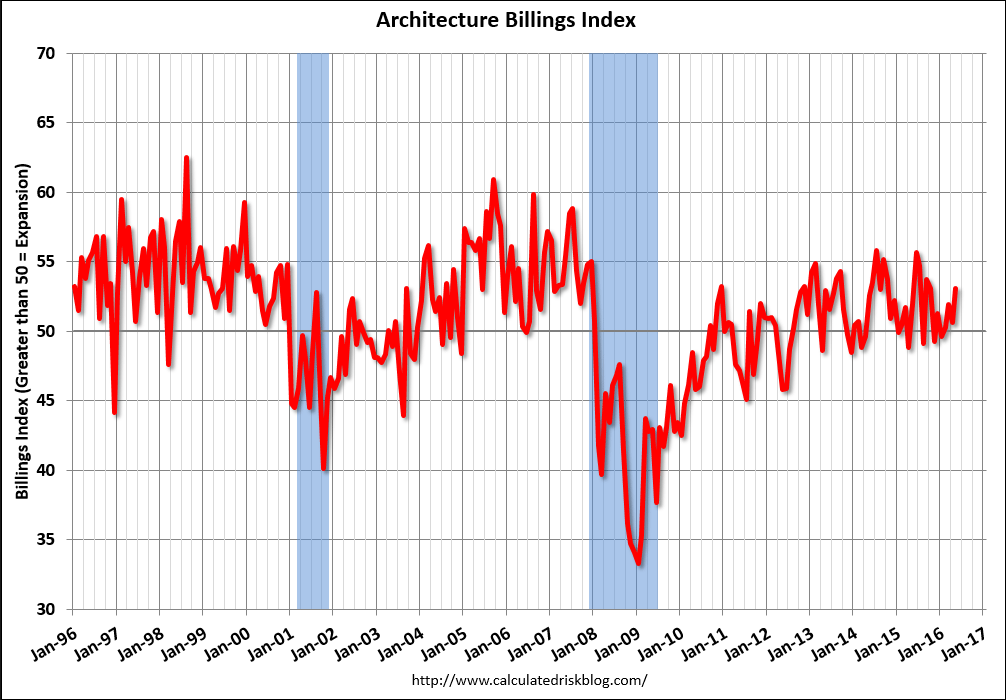
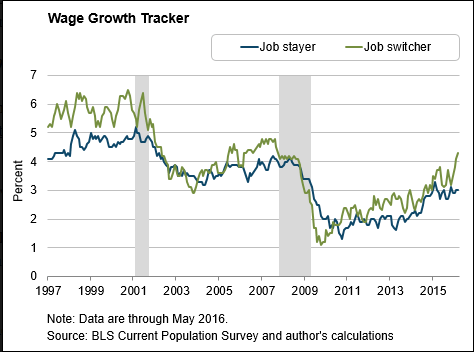
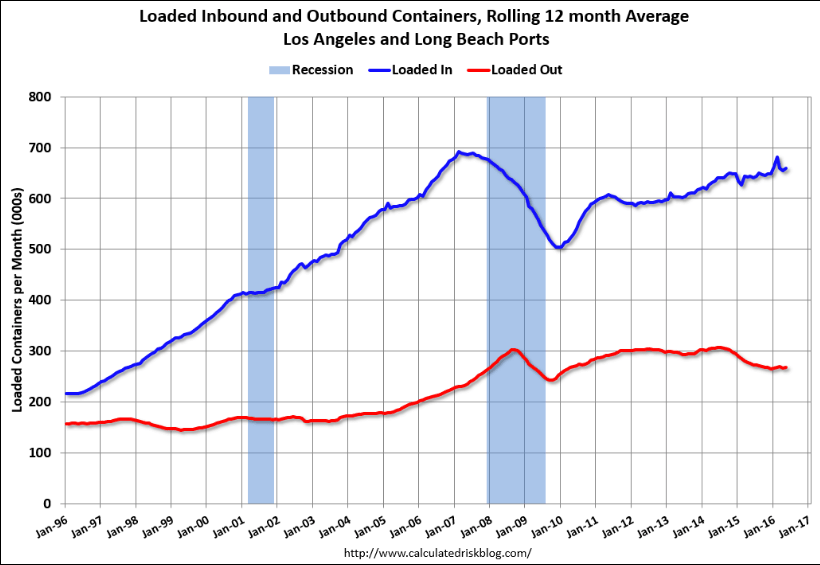
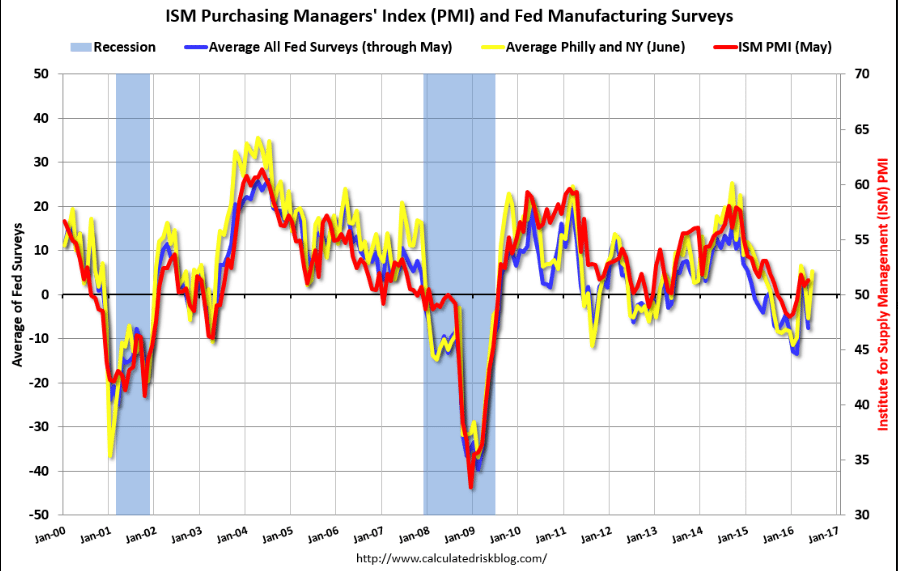
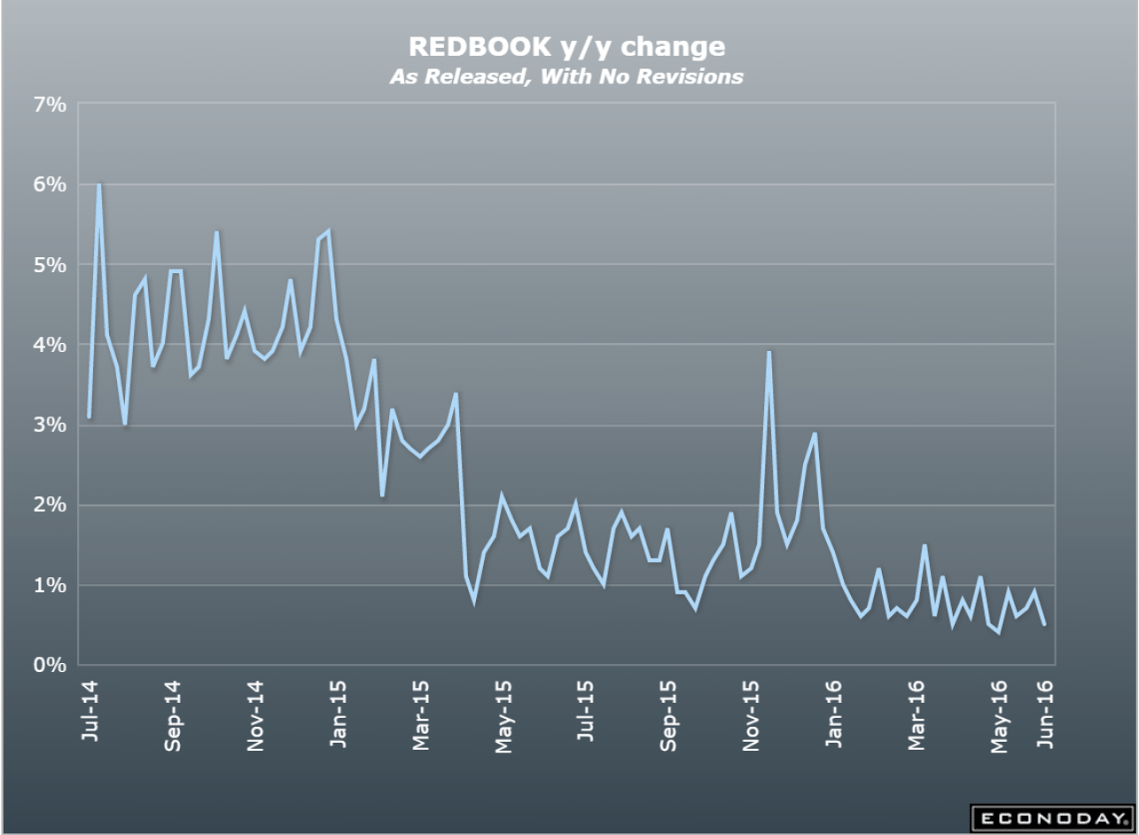
6-28-6
Another bad one:
6-28-7
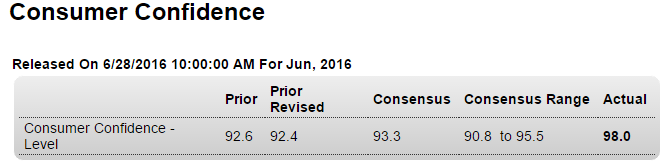
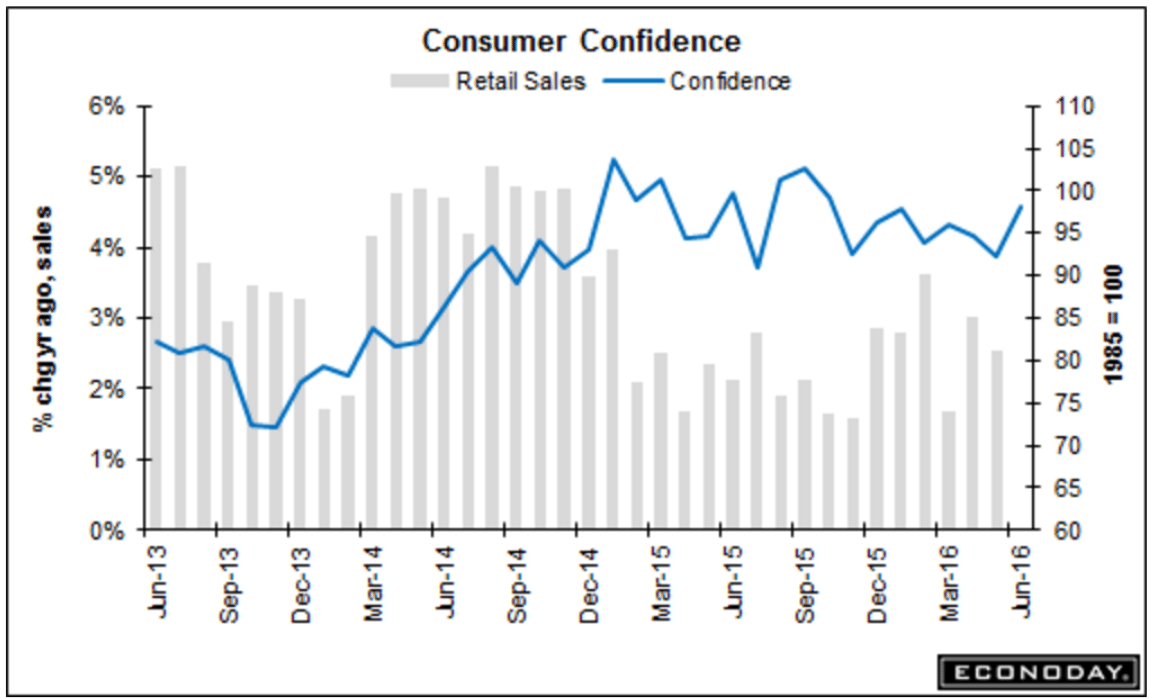
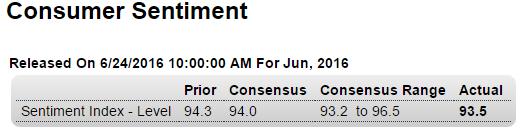
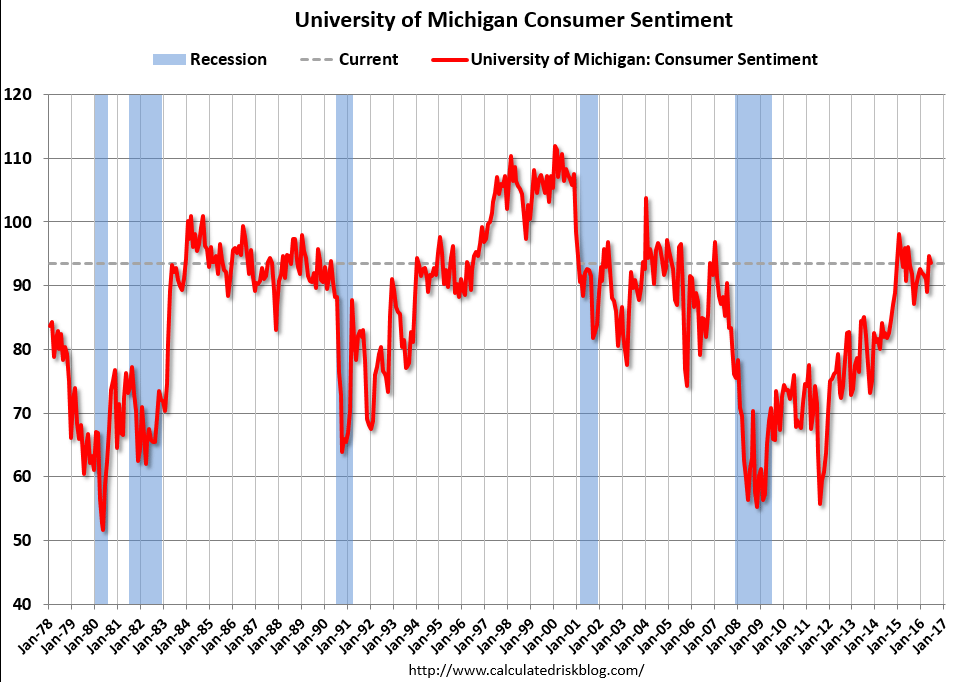
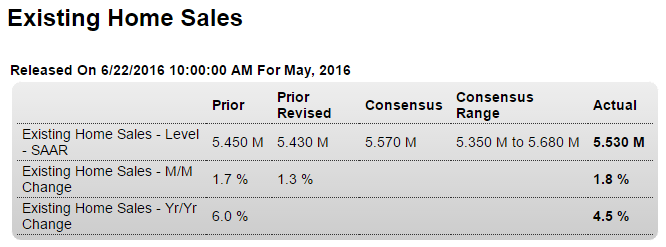
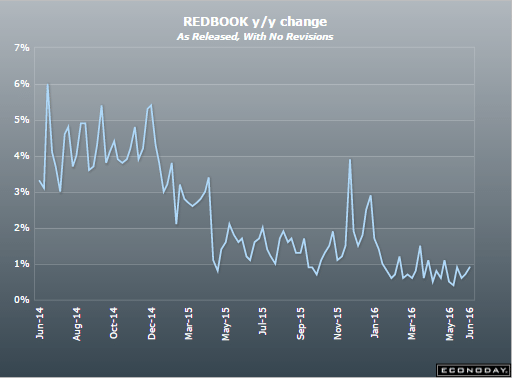
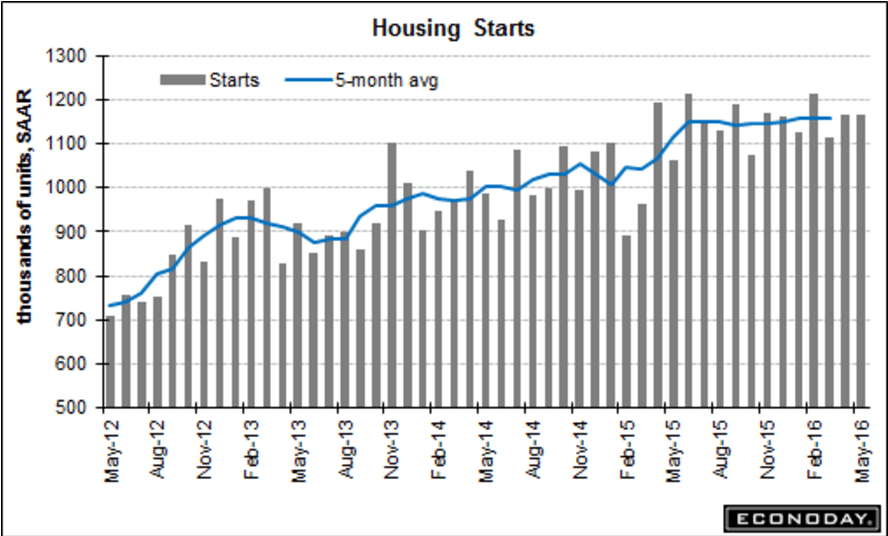
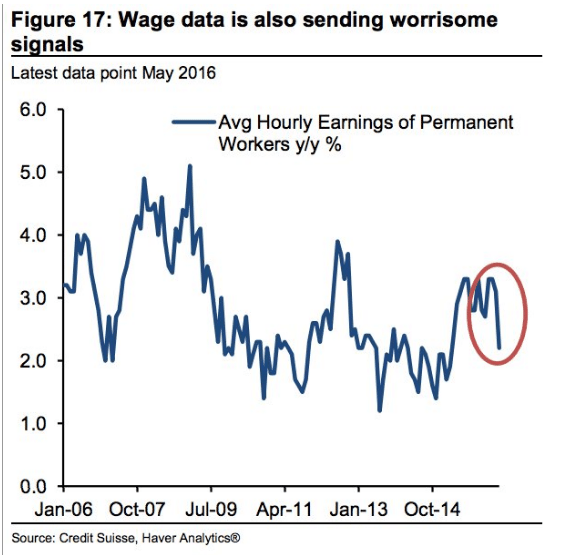
Upside surprise here! But hasn’t been much of a forecaster of retail sales since oil prices collapsed:
6-28-8

6-28-9

Credit check, Comments on the great moderation

Gradual deceleration looks to be continuing:
6-25-1
Growth here had been increasing, helping to offset the decline in govt. deficit spending, but after the oil capex collapse this measure of credit growth leveled off:
6-25-2
Real estate as well as consumer loan growth have also leveled off:
6-25-3
6-25-4
This story is all about income here as well. The consumer has been hit hard twice due to the recession and then tax hikes and it’s all ratcheted down a notch each time. Even in the prior recession personal income didn’t go down, as it has twice just in the last 8 years.

So if you look at the total growth from 2007 to 2016 it’s pretty much in line with the reduced rate of growth of output and the lower levels of employment:
6-25-5

June car sales forecasts, Philly Fed recession indicator

Looks like another small decrease as the deceleration continues:

Vehicle Sales Forecasts: Sales to be Over 17 Million SAAR again in June

By Bill McBride

June 24 (Calculated Risk Blog) — The automakers will report June vehicle sales on Friday, July 1st.

Note: There were 26 selling days in June, up from 25 in June 2015.
From WardsAuto: Forecast: June Sales to Reach 11-Year High

A WardsAuto forecast calls for U.S. automakers to deliver 1.57 million light vehicles this month.

The expected daily sales rate of 60,314 over 26 selling days represents a 2.5% improvement from like-2015 (25 days), with total volume for the month rising 6.6%.

The report puts the seasonally adjusted annual rate of sales for the month at 17.3 million units, shy of last month’s 17.37 million SAAR, but ahead of the current 3-month SAAR (17.0 million) and the year-to-date SAAR through May (17.2 million).

From TrueCar: June Auto Sales Likely to Rebound From May’s Shortfall on Buoyant Retail Demand

The seasonally adjusted annualized rate (SAAR) for total light vehicle sales in June is an estimated 17.2 million units, up from 17 million units a year ago.

Looks like another strong month for vehicle sales.
Read more at http://www.calculatedriskblog.com/#Hjzw6i0mUYk2as6A.99

6-24-8

6-24-9

Durable goods orders, Consumer sentiment, UK comments

Weaker than expected, and turns out it was up in April followed by down in May as previously discussed:

6-24-5

Highlights
May proved to be a generally weak month for the factory sector. Minus signs spread across the durable goods report with total new orders down a very sizable 2.2 percent and ex-transportation orders, which exclude aircraft and vehicles, down 0.3 percent.

The worst news comes from capital goods, a sector where weakness points to weakness in business investment and ultimately the nation’s productivity. Orders for core capital goods fell 0.7 percent in the month while shipments, which are inputs into the nonresidential investment component of GDP, fell 0.5 percent.

Overall shipments also fell, down 0.2 percent with inventories in thankful contraction, down 0.3 percent and holding the inventory-to-shipments ratio unchanged at 1.65. Unfilled orders, which outside of April’s 0.6 percent gain have not been strong, rose a modest 0.2 percent in May.

Vehicles, like they were in the industrial production report, were once again very weak with orders down 2.8 percent and shipments down 3.4 percent. Vehicle sales, however, have been solid and point to a rebound for the related factory data. Orders and shipments for commercial aircraft remain solid with orders in May up an unusually tame 1.0 percent. Machinery orders, at the heart of the capital goods group, are down for a second month with both primary and fabricated metals showing order declines.

The decline in capital goods is certain to pull back second-quarter GDP estimates which, in the 2 percent range, aren’t that strong to begin with. The dollar’s decline this year has not done much to lift exports or the factory sector which going into Brexit, and the ensuing spike in the dollar, was simply flat.

Revised down a bit:
6-24-7
6-24-6
Brexit comments:

So should Parliament follow through and somehow break their EU ties, what’s left is to (re)negotiate what I’ve read is thousands of trade related agreements. And at the rate of maybe one per year that could take quite a while….

The question then is whether current arrangements are allowed to remain pending negotiations, or if trade itself is halted pending negotiations. Seems the former is in the best interest of both sides, which is not to say that’s what they will do, of course.

As for other EU members leaving, it’s a whole lot more problematic as it would entail creating new currencies, which has not had the support of the majority of the voters in any euro area member nation.

Wouldn’t surprise me if the whole thing falls out of the news cycle over the next week or so.

Chicago Fed, New home sales, Architecture Billings Index

Remember the enthusiasm around last month’s move up? As suspected, it’s reversed and the 3 month average remains negative:

6-24-1

Highlights
May was a weak month based on the minus 0.51 result for the national activity index, one that drives the 3-month average to a minus 0.36 level consistent with below average growth.

Production, not employment, is by far the weakest component in May, at minus 0.32 and reflecting contraction in industrial production and factory utilization. Employment, despite the very weak 38,000 total for nonfarm payrolls, fell only slightly, to minus 0.09 from minus 0.06 getting a lift from the month’s 3 tenths drop in the unemployment rate (a drop however tied to a fall in participation and one widely considered a sign of weakness, not strength). The sales/orders/inventories component fell slightly to minus 0.01 while personal consumption & housing, despite isolated bursts of strength in related indicators, fell to minus 0.09 from minus 0.02.

The readings in this report are broadly but not deeply negative, though they would be a bit deeper still if the report’s methodology picked up the counter-intuitive move in the unemployment rate.

Last month’s exceptionally large increase was revised lower, and this month’s is lower still. Looks to me like fears of higher rates and builders discounting to clear inventory may have contributed to the higher April sales and now it’s all reversing. And in any case sales remain at historically depressed levels, as per the chart, which is not population adjusted:

6-24-2

Highlights
Data on new home sales, due to small samples, are always volatile, but underlying the monthly swings is a trend of strength. New home sales fell a severe looking 6.0 percent in May but the annualized sales rate, at 551,000, is second best of the cycle, next only to April’s 586,000 (revised downward from an initial 619,000).

Home builders were offering concessions in the month based on the price data where the median fell 9.3 percent to $290,400. Year-on-year, the median price is up only 1.0 percent. A positive in the report is supply as 3,000 more new homes entered the market bringing the total to 244,000. Relative to sales, supply improved to 5.3 months vs 4.9 months in April.

The South is the driving force in the data, dipping 0.9 percent to a 323,000 rate but still up 13.3 percent year-on-year. In contrast, sales in the West, which is also an important region for new homes, fell 15.6 percent in the month to a 124,000 rate which is down 8.8 percent on the year.

Trends right now in the housing market do not appear to be red hot but only moderate, which perhaps is a positive for an often boom-and-bust sector.

6-24-3

6-24-4

Mtg purchase apps, Existing home sales

6-23-2

Highlights
Despite another fall in rates, the purchase index is not pointing to acceleration for home sales, down 2.0 percent in the June 17 week with year-on-year growth slowing 4 percentage points to 12 percent. Low rates, however, are an immediate plus for refinancing where the index rose 7.0 percent. And rates are indeed low, at an average 3.76 percent for conforming loans ($417,000 or less) which is down 3 basis points in the week and at its lowest since May 2013.

Not much going on here either:
6-23-1
6-23-3

Chemical activity barometer, Fed Atlanta job tracker, Recession article

Looks to me like it’s still decelerating?

From the American Chemistry Council: Chemical Activity Barometer Continues Solid Growth in June; Signals Higher U.S. Business Activity Through End Of The Year

Read more at http://www.calculatedriskblog.com/#fcgmQuzJH31oFHbc.99

er-6-21-6

Wage ‘pressures’ indicators, after all this time, are finally moving up towards what would have been considered historically very low levels, so time to slam on the brakes? (Not that rate hikes are slamming on the brakes, but that they think they are.)

er-6-21-5

The next recession is already here—and there isn’t much the Fed can do

By Michael Pento

June 21 (CNBC)

Housing starts, Beijing bans iPhone 6

Not good. Note from the chart how growth has stalled, and housing is not likely to add as much to GDP this year as it did last year:
er-6-17-1

Highlights
Housing starts are solid but not permits. Starts did slip 0.3 percent to a 1.164 million annualized rate in May but the trend is positive with the year-on-year gain at a very strong 9.5 percent. Permits, in contrast, popped 0.7 percent higher in the month to a 1.138 million rate but here the year-on-year rate remains deep in the contraction column, at minus 10.1 percent.

er-6-17-2

Building Permits:
Privately-owned housing units authorized by building permits in May were at a seasonally adjusted annual rate of 1,138,000. This is 0.7 percent above the revised April rate of 1,130,000, but is 10.1 percent below the May 2015 estimate of 1,266,000.
Read more at www.calculatedriskblog.com/#2o0RYeSxs7oQoXgd.99

Interesting:

Beijing bans iPhone 6, saying it’s too similar to Chinese phone

By Kate Rooney
er-6-17-3

CPI, US current account, Philly Fed, Housing market index, Wage data

Continues well below the Fed’s target:

er-6-16-1
Highlights
Whatever pressure may be building in import & export prices or even producer prices, it has yet to give much of a boost to consumer prices which rose only 0.2 percent in May. Core prices, that is prices excluding food and energy, also came in at plus 0.2 percent.

Year-on-year rates aren’t going anywhere, at only plus 1.0 percent for total prices and plus 2.2 percent core prices. Though the 2.2 percent rate does exceed the Fed’s 2 percent target, core consumer prices are not what the Fed tracks most closely, rather core PCE prices which typically run 1/2 point lower.

Housing costs rose 0.3 percent and at a year-on-year 2.4 percent are showing tangible pressure. Medical care is at the top of list showing pressure, up 0.3 percent but still at a manageable year-on-year rate of plus 3.2 percent.

Other readings are much flatter, including a 0.7 percent year-on-year rise for food and a 0.5 percent rise for apparel. Energy prices, though rising 1.2 percent in the month, are still down 10.1 percent on the year with gasoline down 16.9 percent.

It’s the trend that counts most and the trends for consumer prices are still flat, not yet reflecting the recovery in oil prices. This report does not lift the chances for a rate hike at the July FOMC.

You could say it’s ‘flooding the world with dollars’:

US Current Account Gap At 7-Year High

er-6-16-2

er-6-16-3
Highlights
The Philly Fed’s headline index, which is a measure of general sentiment based on a single question, can often read much differently than the assessment of actual conditions. And this is the case for the June report where the constructive looking 4.7 headline doesn’t match the details which are almost uniformly negative.

New orders, at minus 3.0, are contracting for a second month while contraction in unfilled orders, at minus 12.6, is deepening. At minus 2.1, shipments are in a third month of contraction. Employment, at minus 10.9, has been in contraction for the entire year. The sample appears to be destocking and delivery times are shortening, both indications of weakness.

The only signs of actual life in this report are in prices. Input costs are going up, a reflection of fuel and raw materials, while selling prices are edging higher.

Otherwise this report, including the 6-month outlook which continues to show less and less optimism, does not confirm the strength of Wednesday’s Empire State report and will not lift the outlook for what is a very flat factory sector.

er-6-16-4

Up a bit:

er-6-16-5
Canadian wages:
er-6-16-6