Continues well below the Fed’s target:
Highlights
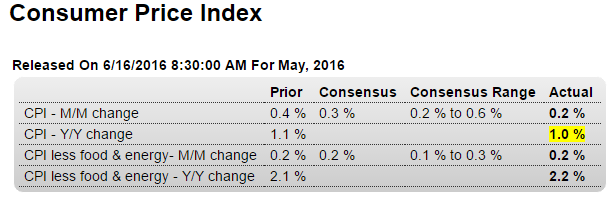
Whatever pressure may be building in import & export prices or even producer prices, it has yet to give much of a boost to consumer prices which rose only 0.2 percent in May. Core prices, that is prices excluding food and energy, also came in at plus 0.2 percent.
Year-on-year rates aren’t going anywhere, at only plus 1.0 percent for total prices and plus 2.2 percent core prices. Though the 2.2 percent rate does exceed the Fed’s 2 percent target, core consumer prices are not what the Fed tracks most closely, rather core PCE prices which typically run 1/2 point lower.
Housing costs rose 0.3 percent and at a year-on-year 2.4 percent are showing tangible pressure. Medical care is at the top of list showing pressure, up 0.3 percent but still at a manageable year-on-year rate of plus 3.2 percent.
Other readings are much flatter, including a 0.7 percent year-on-year rise for food and a 0.5 percent rise for apparel. Energy prices, though rising 1.2 percent in the month, are still down 10.1 percent on the year with gasoline down 16.9 percent.
It’s the trend that counts most and the trends for consumer prices are still flat, not yet reflecting the recovery in oil prices. This report does not lift the chances for a rate hike at the July FOMC.
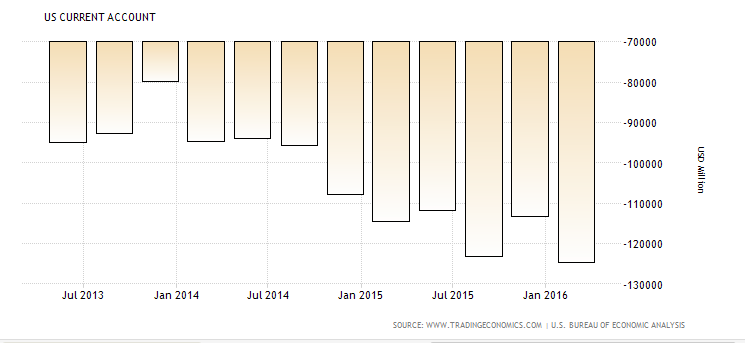
You could say it’s ‘flooding the world with dollars’:
US Current Account Gap At 7-Year High
Highlights
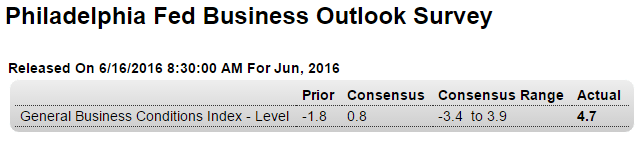
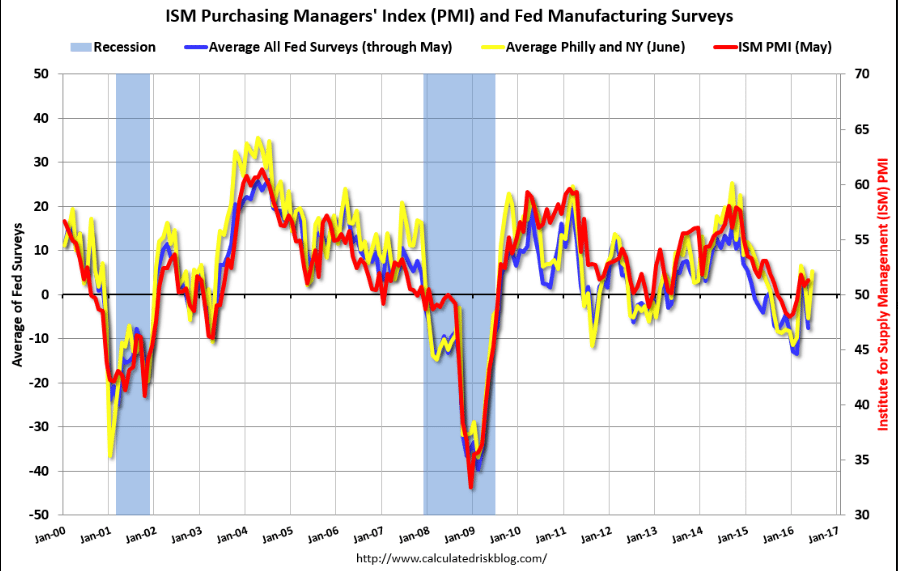
The Philly Fed’s headline index, which is a measure of general sentiment based on a single question, can often read much differently than the assessment of actual conditions. And this is the case for the June report where the constructive looking 4.7 headline doesn’t match the details which are almost uniformly negative.
New orders, at minus 3.0, are contracting for a second month while contraction in unfilled orders, at minus 12.6, is deepening. At minus 2.1, shipments are in a third month of contraction. Employment, at minus 10.9, has been in contraction for the entire year. The sample appears to be destocking and delivery times are shortening, both indications of weakness.
The only signs of actual life in this report are in prices. Input costs are going up, a reflection of fuel and raw materials, while selling prices are edging higher.
Otherwise this report, including the 6-month outlook which continues to show less and less optimism, does not confirm the strength of Wednesday’s Empire State report and will not lift the outlook for what is a very flat factory sector.
Up a bit:
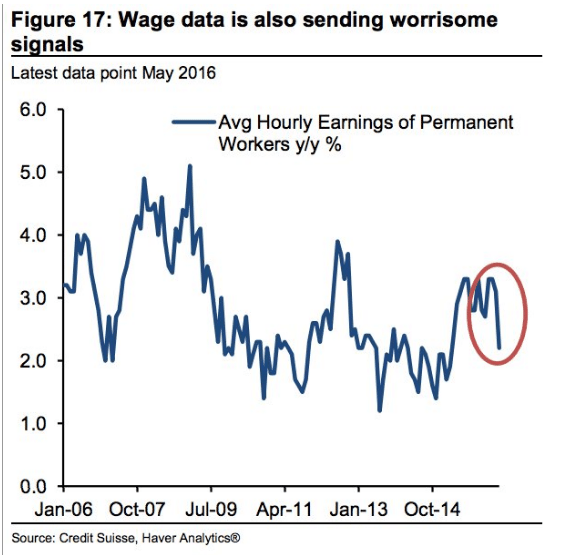
Canadian wages: