Remember the enthusiasm around last month’s move up? As suspected, it’s reversed and the 3 month average remains negative:
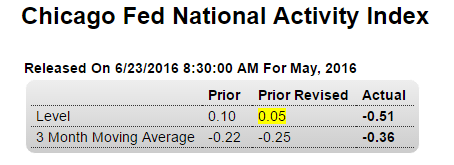
Highlights
May was a weak month based on the minus 0.51 result for the national activity index, one that drives the 3-month average to a minus 0.36 level consistent with below average growth.Production, not employment, is by far the weakest component in May, at minus 0.32 and reflecting contraction in industrial production and factory utilization. Employment, despite the very weak 38,000 total for nonfarm payrolls, fell only slightly, to minus 0.09 from minus 0.06 getting a lift from the month’s 3 tenths drop in the unemployment rate (a drop however tied to a fall in participation and one widely considered a sign of weakness, not strength). The sales/orders/inventories component fell slightly to minus 0.01 while personal consumption & housing, despite isolated bursts of strength in related indicators, fell to minus 0.09 from minus 0.02.
The readings in this report are broadly but not deeply negative, though they would be a bit deeper still if the report’s methodology picked up the counter-intuitive move in the unemployment rate.
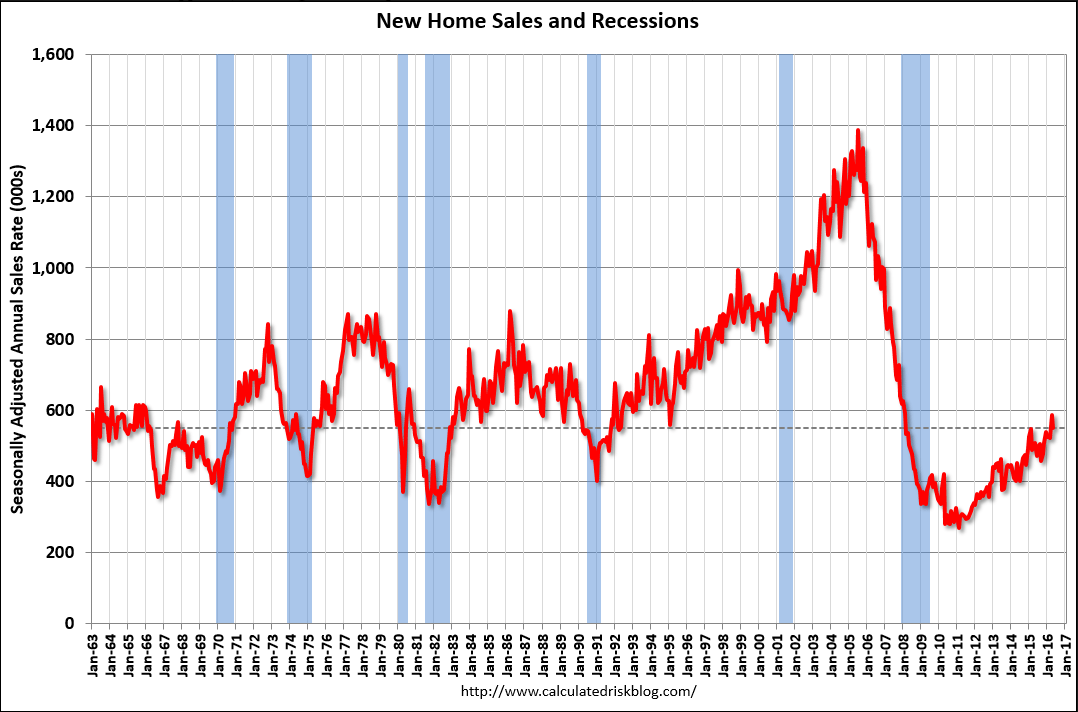
Last month’s exceptionally large increase was revised lower, and this month’s is lower still. Looks to me like fears of higher rates and builders discounting to clear inventory may have contributed to the higher April sales and now it’s all reversing. And in any case sales remain at historically depressed levels, as per the chart, which is not population adjusted:
Highlights
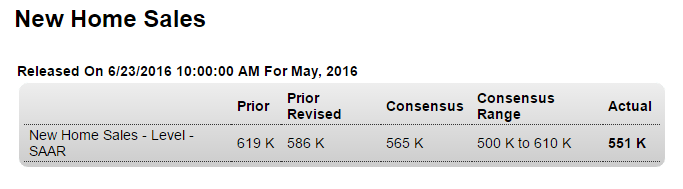
Data on new home sales, due to small samples, are always volatile, but underlying the monthly swings is a trend of strength. New home sales fell a severe looking 6.0 percent in May but the annualized sales rate, at 551,000, is second best of the cycle, next only to April’s 586,000 (revised downward from an initial 619,000).Home builders were offering concessions in the month based on the price data where the median fell 9.3 percent to $290,400. Year-on-year, the median price is up only 1.0 percent. A positive in the report is supply as 3,000 more new homes entered the market bringing the total to 244,000. Relative to sales, supply improved to 5.3 months vs 4.9 months in April.
The South is the driving force in the data, dipping 0.9 percent to a 323,000 rate but still up 13.3 percent year-on-year. In contrast, sales in the West, which is also an important region for new homes, fell 15.6 percent in the month to a 124,000 rate which is down 8.8 percent on the year.
Trends right now in the housing market do not appear to be red hot but only moderate, which perhaps is a positive for an often boom-and-bust sector.