Consumer credit, Corporate profits, Bank lending

Still decelerating on a year over year basis:
7-9-6

United States Consumer Credit Change
Consumer credit in the United States increased by $18.56 billion in May 2016 following a downwardly revised $13.4 billion rise in April and above market expectations of a $16 billion gain.

7-9-1

7-9-2
This was decelerating and below stall speed when the boom in oil capex reversed that trend early in 2014. Then in late 2014 oil capex collapsed and bank lending growth reversed and resumed its deceleration:

7-9-3

7-9-4
And rising delinquency necessarily leads to restrictive tighter standards which slows spending growth, which causes further delinquency, until the curve ‘goes vertical’:

7-9-5

Employment, Bank losses, German Banks

Nice rebound as Verizon workers return to work, but the year over year deceleration continues and, of course, this number will be revised next month. And the lower average hourly earnings gains could put off fears of the US turning into Zimbabwe and Weimar for several hours:

781
The payroll gain in June is what is striking in this report. Yet smoothing the big ups and downs, second-quarter payroll growth averaged a monthly 147,300 vs a more substantial 195,700 in the first quarter. The labor market is solid but perhaps slowing, this and still subpar wage growth (not to mention Brexit) may not be pointing to any urgency for a new Federal Reserve rate hike.

782
This chart is the change in the 3 month average payroll growth this year vs the same period last year:

783
Employment isn’t currently keeping up with population growth:

784
Apparently the ‘conspiracy theory’ of the CB’s ‘helping the banks’ at the expense of the macro economy needs a bit of rethinking? Maybe policy has been drilling holes in the boat to let the water out, and it’s all going down? ;)

The Big-Bank Bloodbath: Losses Near Half a Trillion Dollars

By David Reilly

July 6 (WSJ) — Since the start of 2016, 20 of the world’s bigger banks have lost a quarter of their combined market value. Added up, it equals about $465 billion, according to FactSet data. In fact, among the group of 20 big banks only one bank—Wells Fargo—trades at a premium to its book value. Only one other, J.P. Morgan Chase, trades near book value. The fact that some banks are trading at less than half their book value flags even deeper concerns. Among the likely issues: A brewing battle within the EU over rules curtailing governments’ ability to bail out banks and whether those could be put on hold.

The problem with bank issues is when lending is cut back which directly reduces spending/output/employment:
Europe’s Bank Crisis Arrives In Germany: €29 Billion Bremen Landesbank On The Verge Of Failure.

Unemployment claims, Online help wanted ads, Italian bank comment

Record lows, particularly population adjusted, for record periods of time, and no one even suggests it might be because they’ve become that much harder to get? Meanwhile, the consequence is less govt. spending than otherwise potentially making this recession that much worse:

7-7-9

7-7-10
Note the peak was just after oil capital expenditures collapsed:
7-7-11

The Italian bank crisis isn’t going away. There is no way under current policy to recapitalize. The EU considers any funds from the Italian govt. to be additions to the public debt, so that avenue is closed.

At the same time, the economy is slowing, so loan performance is likely to deteriorate further. That leaves the depositors as the only ‘source of funds’, with even the possibility of that likely to trigger a further run on deposits. And at this point in time, the German banks don’t look to me like much of a ‘safe haven’, so there’s no where to go without taking some kind of currency risk, while liabilities are almost entirely payable in euro.

As long as EU policy is to use the liability side of banking for market discipline, the entire payments system faces collapse.

So looks to me like it’s a rerun of events that led up to the ECB’s declaration to ‘do what it takes to prevent default’ in 2012. Up to that point the (failed) policy was to use the liability side- private debt markets- to discipline national govts and bring them back into compliance with deficit and debt limits.

The ‘answer’ is the same this time. Nothing short of an ECB liability guarantee will do the trick. This guarantee could take the form of ECB deposit insurance, unlimited and unsecured ECB bank liquidity provision, some kind of permission of national govts. to support bank liquidity, directly or indirectly, regardless of deficit and debt limits, maybe some kind of ‘euro bonds’, or whatever else they may dream up that removes the use of the liability side of banking for market discipline.

As described in 2001:
http://www.mosler.org/docs/docs/rites_of_passage.htm

Trade, PMI services, ISM non manufacturing, Atlanta Fed

More weakness:

7-7-1

Highlights
There is some weakness in the May trade report as the nation’s trade deficit widened sharply to $41.1 billion from April’s $37.4 billion. The net deficit for goods widened to $62.2 billion from April’s $58.6 billion while the net surplus for services narrowed slightly to $21.1 billion.

In a negative indication on global demand, exports of both goods and services fell slightly in the month. But in a positive indication on domestic demand, imports rose a sharp 1.9 percent on top of April’s 2.3 percent gain. Much of the import gain is tied to the dollar effects of higher oil prices, which jumped nearly $5 in the month, but not all of it as imports of consumer goods and autos show solid gains.

The export side of this report, however, is decidedly weak with contraction sweeping capital goods and also civilian aircraft, two areas where weakness may be deepening.

An offset to May’s widening is the narrowing in April where the deficit is unrevised at $37.4 billion. The deficit in April and May together is tracking lower than the first quarter which is a plus for second-quarter GDP. But this report will be most watched come July’s data which will offer early indications on both Brexit effects and the ongoing rise in dollar.

7-7-2
Still very low:
7-7-3

7-7-4

Highlights
New orders picked up but only to a moderate pace for Markit Economics’ U.S. service sector sample where the final PMI for June came in at 51.4, little changed from 51.3 readings for both the June flash and May final. New orders are at their best reading of the year but are still below trend. And backlog orders continue to decline, down now for 11 straight months. Firms in the sample are hiring but not very much with job growth at a 17-month low. Optimism in the general outlook, down four of the last five months, is at a survey low. Price data are muted despite the rise in fuel costs. The bulk of the U.S. economy is chugging along at marginal rates of growth heading into Brexit fallout.

7-5-6
This service sector survey reports a large increase from May but my read of the chart tells me to wait another month before concluding it’s turned upwards:

7-7-5

7-7-6

7-7-7

Highlights
ISM’s non-manufacturing sample is reporting its strongest rates of growth of the year, headlined by a big 3.2 point jump in the composite index to 56.5. New orders are even further above break-even 50 at 59.9 with new export orders up 4 points to 53.0. Employment is also up, 3 points higher at 52.7 in a reading that hints at sizable improvement for Friday’s employment report.

Deliveries are slowing which is a sign of rising demand and inventories are rising in what perhaps hints at restocking and new confidence in the outlook. Business activity, which is a measure of production, is also very strong, at 59.5 which points to strength for the June economy. To keep production up in the month, the sample worked down its backlogs which are in contraction for the first time in more than a year. But the rise in new orders should help fill backlogs back up while the strength in exports underscores global demand for the nation’s technical and managerial services.

This report historically is not volatile which makes June’s gains impressive. The bulk of the nation’s economy may very well be picking up steam heading to the Brexit fallout.

Starting to drift lower as somewhat stronger April data reverses in May and June:

7-7-8

Factory orders, Small business borrowing, NY business conditions, Shadow lending, US jobs diffusion index

Worse than expected as another April gain reverts in May:

US Factory Orders Fall More Than Expected

New orders for manufactured goods shrank 1% mom in May, compared to a downwardly revised 1.8% gain in April. Figures came slightly worse than market expectations of a 0.9% drop. Meanwhile, orders for non-defense capital goods excluding aircraft fell 0.4%, lower than a 0.7% drop in April and excluding transportation, factory orders edged up 0.1%.
7-5-1
Highlights
May was a weak month for the factory sector as new orders fell 1.0 percent and show specific weakness in capital goods. New orders for core capital goods (nondefense ex-aircraft) fell 0.4 percent following a 0.9 percent drop in April while shipments fell 0.5 percent to nearly reverse April’s 0.6 percent gain.

Commercial aircraft orders, which have been soft, improved on the month with vehicle orders, where growth has been respectable, also showing a bounce. Monthly weakness in transportation came from defense aircraft and ships & boats, two smaller components that show large double-digit declines. Excluding transportation, factory orders inched up 0.1 percent on the month.

This report would be weaker were it not for price-related gains in oil-related subcomponents, specifically on the non-durables side where orders rose 0.3 percent. Durables orders fell 2.3 percent on the month, 1 tenth deeper than last week’s advance report for this component.

Weakness in capital goods means weakness in business investment and reflects weakness in business expectations. And expectations aren’t getting any lift from Brexit. Weakness in capital goods also means extended trouble for the nonresidential investment component of the GDP report, here trouble for the second quarter.

Still no sign of an expansion of private sector credit growth needed to support GDP growth:

7-5-2

U.S. small business borrowing fell in May -PayNet

By Ann Saphir

June 30 (Reuters) — U.S. small business borrowing fell for the third straight month in May, data released on Thursday showed, a pullback that suggests economic growth prospects were already dimming before Britain’s shock vote last week rocked global financial markets.

Loans more than 30 days past due rose in May to 1.54 percent, the highest in more than a year, separate data from PayNet showed.

7-5-3

Jobs index:
7-5-4

United States ISM New York Index 1993-2016

The ISM NY Current Business Conditions Index came in at 45.4 in June of 2016 compared to 37.2 in May. Yet, business activity in New York City contracted in back-to back months for the first time since the Great Recession, as employment (35.9 from 44.6 in May) and quantity of purchases (46.7 from 37.5) continued to fall and current (55.6 from 60) and expected revenues (57.1 from 68) grew less. In contrast, prices paid recovered (55 from 45.7) and the 6-month outlook increased to 59.5, the highest in three months. Ism New York Index in the United States averaged 55.65 percent from 1993 until 2016, reaching an all time high of 88.80 percent in December of 2003 and a record low of 23.40 percent in October of 2001. Ism New York Index in the United States is reported by the Institute for Supply Management.

Slowdown in Shadow Lending Tightens Credit on Main Street

By Serena Ng

July 4 (WSJ) — America’s shadow banking system slowed sharply through the end of June, with the value of bonds backed by personal, corporate and real-estate loans falling $98 billion from the first half of 2015. That drop, which excludes bonds from state-backed issuers like Fannie Mae, represents a 37% decline from a year earlier, according to industry newsletter Asset-Backed Alert. At $31 billion so far this year, CMBS issuance is down nearly 44% from the same period in 2015. Through mid-June, some $4.5 billion in CMBS loans were transferred to special servicers that specialize in debt workouts, according to Fitch Ratings.

7-5-5

Vehicle sales

This is a major negative. Along with today’s construction report seems to me my narrative of a general deceleration since oil capex collapsed is intact. Particularly the part about no recovery until after deficit spending- private or public- accelerates:

6-29-10

Highlights
The first hard look at consumer spending in June is negative as unit vehicle sales fell a very sharp 4.6 percent to a 16.7 million annualized rate which, outside of March’s 16.6 million, is the lowest rate since April last year. Sales of North American-made vehicles fell 3.7 percent to a 13.2 million pace from 13.7 million with imports down 5.4 percent to 3.5 million. Data on cars and light truck show similar declines. These results are worrisome, suggesting that consumer spending, which surged in April and proved strong in May, may have slowed sharply in June. Today’s results point to a decline for motor vehicle sales in the June retail sales report, a component that showed strength in the two prior months and was a regular source of retail strength during 2015.

PMI manufacturing, ISM manufacturing, Construction spending, China PMI, Manhattan apartment sales

Manufacturing historically just chugs along at maybe a 3% growth rate or so. However as oil capital expenditures collapsed, manufacturing ratcheted down accordingly. And now it looks like it may be resuming it’s traditional modest growth rate from a much lower base than otherwise. This is not to say that the reduction in spending on capex is being replaced, as the spending deficiency now continues after having spread to the (much larger) service sector.

Still on the low side but better than expected:

7-1-1

Highlights
The final manufacturing PMI for June is little changed from the flash, down 1 tenth to a 51.3 level that points to no more than modest growth for the sector. But the news is mostly good in June, at least compared to May when the index was even weaker at 50.7. June saw a pickup in new orders and a 2-year high in export growth. Production was also up as was employment. But inventories were down as the sample, in a defensive move, keeps a lid on restocking. Coming up next is the closely watched ISM manufacturing where a modest 51.5 headline is expected.

This chart is about a month old:
7-1-2
Also better than expected:
7-1-3

Highlights
ISM’s sample is reporting significant acceleration to a level that is still, however, no more than moderate. The index easily beat expectations, at 53.2 in June and the best reading since February last year. New orders are especially solid, at 57.0 for a 1.3 point gain and the best reading since March. And export orders are keeping up, 1.0 point higher at 53.5 for the 4th straight plus-50 showing. Production is active, inventories may be on the climb, but employment is flat. A negative for profits but a plus for the inflation outlook is continued pressure in raw material costs. New orders are very closely watched in this report and the strength will lift expectations for June’s factory data.

7-1-4
Growth in construction spending continues its decline, as this hope as a driver of positive growth continues to disappoint:
7-1-5

Highlights
Construction spending proved surprisingly weak in May, down 0.8 percent vs expectations for a 0.6 percent gain. The decline follows an even steeper and downwardly revised 2.0 percent drop in April. Spending on single-family homes, despite the rise underway in housing starts, fell 1.3 percent in May for a third straight decline with the year-on-year gain moving slightly lower to a still constructive 6.3 percent. Spending on multi-family homes has been much stronger, up 1.8 percent in the month for a 23.9 percent year-on-year gain.

Construction spending on non-housing has been very soft with May down 0.7 percent following April’s 0.1 percent dip. Year-on-year, private nonresidential spending is up 3.9 percent led by the office category and pulled down by manufacturing. Public spending on buildings and highways has been flat to slightly negative.

Housing is on the climb this year but a gradual one, which has its positives given the bubbles of the past. The construction sector as a whole still looks to be a positive contributor to overall economic growth.

7-1-6
Remember when markets cared about China’s economy?

;)
7-1-7
Looks like the collapse in oil capex hit the NYC rentiers as well ;):
7-1-8

Chicago PMI, Restaurant performance index, Brexit comment

Nice move higher in this highly volatile series. Employment however, moved lower as it has in most surveys:
6-29-9

Highlights
Volatility is the name of the game when it comes to the Chicago PMI which surged in June to a 56.8 level that is far beyond expectations and follows a sub-50 contractionary reading of 49.3 in the May report. And there was no indication in the May report of the strength to come as both new orders and backlog orders were in outright contraction. But that was for May! For June, new orders are suddenly at their best level since October 2014 while backlog orders are rising at their fastest pace since May 2011. Production is now at its best level since January this year while inventories, in what may be a sign of intentional restocking given the strength in orders, are rising sharply from a 6-1/2 year low. A negative in the report is employment which is at its lowest reading of the recovery, since November 2009. Yet should the strength in orders extend to a second month, employment is bound to get a boost. This report covers both the manufacturing and non-manufacturing sectors of the Chicago economy.

April’s gain more than reversed with this decline in May as the downtrend looks to have dipped into stall speed:
6-29-8
And, as previously discussed, looks to me like Brexit’s influence in financial markets is collapsing and the whole thing will soon be all but forgotten.

Mtg purchase apps, Personal income and spending, Pending home sales, US oil production, Atlanta Fed

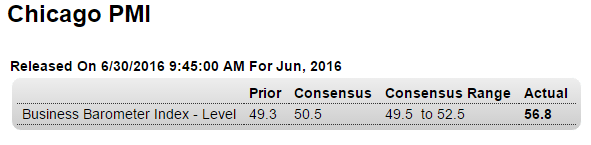
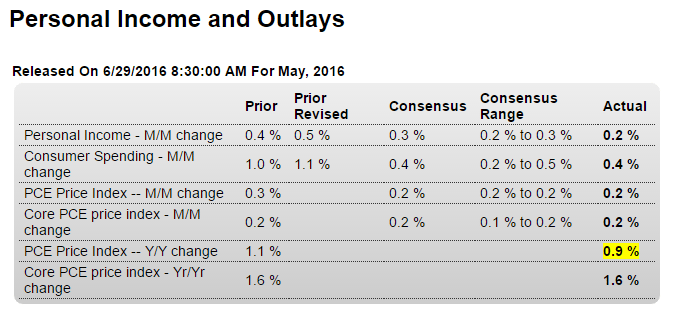
Continues to decline and now down for the month:

6-29-1

Highlights
The lowest mortgage rates in three years are not causing much of a stir in purchase applications for home mortgages, down 3 percent in the June 24 week for the third weekly decline straight. The year-on-year increase in purchase applications volume is a still very strong 13 percent, though far below the 30 percent gains seen in March. Even mortgage refinancing activity abated, down 2.0 percent after rising 7 percent in the prior week. The average rate for 30-year fixed rate mortgages on conforming loans ($417,000 or less) fell 1 basis point to 3.75 percent, the lowest rate since May 2013.

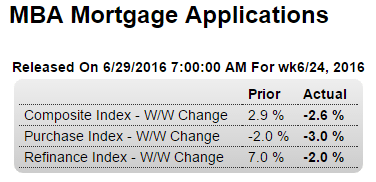
Reversing April’s uptick, as previously discussed:

6-29-2

Highlights
Personal income as well as personal spending slowed in May at the same time that price data remained quiet. Income rose at the low end of expectations, up only 0.2 percent, while spending showed a little life, up 0.4 percent.

The PCE core price index rose only 0.2 percent with the year-on-year rate unchanged and still below the Fed’s 2 percent target at 1.6 percent. Overall prices also rose 0.2 percent with the year-on-year rate dipping 2 tenths to only plus 0.9 percent.

Details on income show only a 0.2 percent rise in wages & salaries, down from April’s outsized 0.5 percent gain. With income growth stalling, consumers may have tapped into their savings slightly to fund May’s spending as the savings rate edged 1 tenth lower to 5.3 percent for the lowest rate of the year. Details on spending show gains concentrated in nondurable goods where price effects for gasoline and energy are inflating the totals. Spending on durable goods, despite a solid rise in vehicle sales during May, rose a soft 0.3 percent. Service spending was respectable with a 0.4 percent gain.

The spending side of May’s report isn’t robust though it was robust in April, revised in fact 1 tenth higher to a recovery best 1.1 percent. When adjusted for inflation, the two months combined show an annualized growth rate of about 4 percent which, with June’s results still pending, will support a jump in second quarter GDP.

But based on trends including May’s results, April may very well prove to be an outlier for spending. April aside, today’s report is consistent with moderate economic growth and does not point, especially with the uncertainty of Brexit in play, to a Fed rate hike anytime soon.

6-29-3
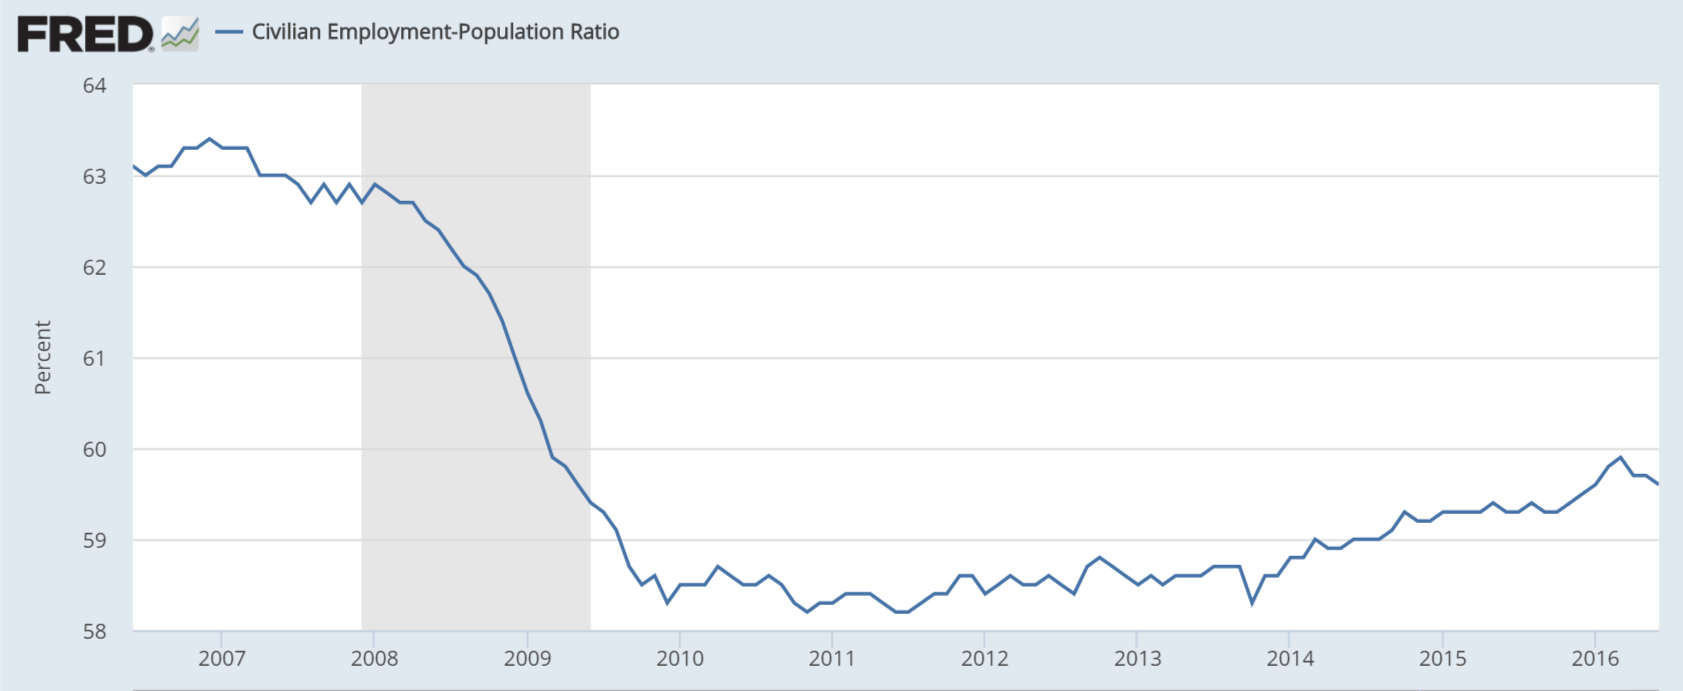
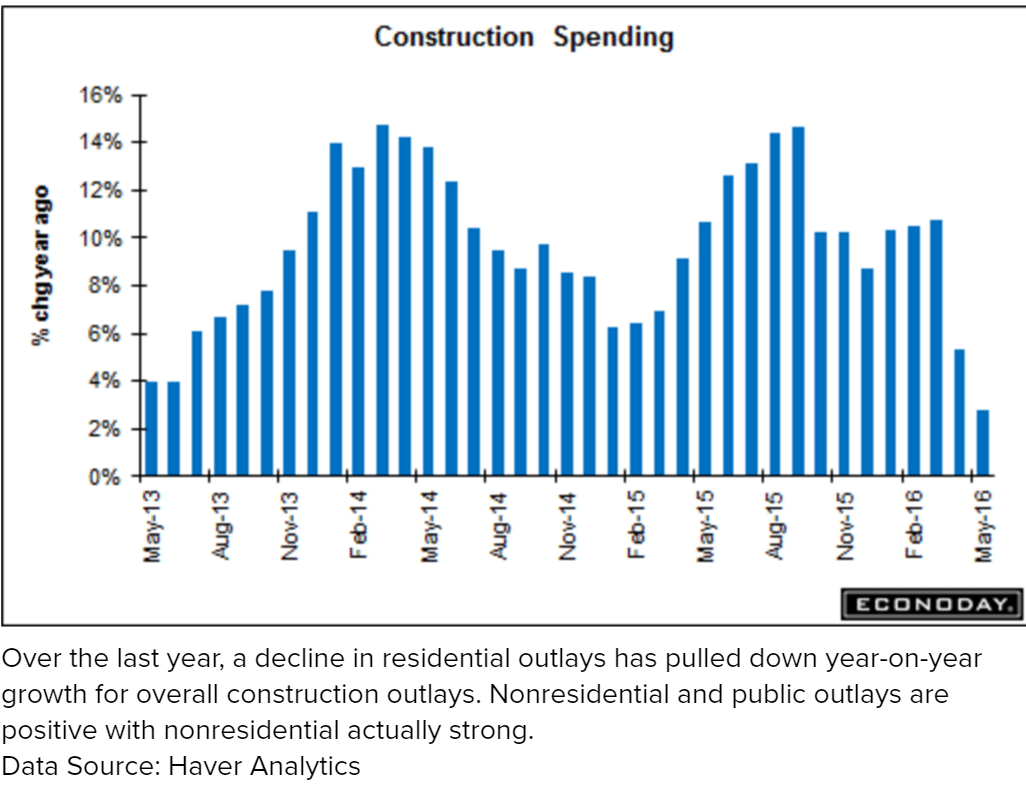
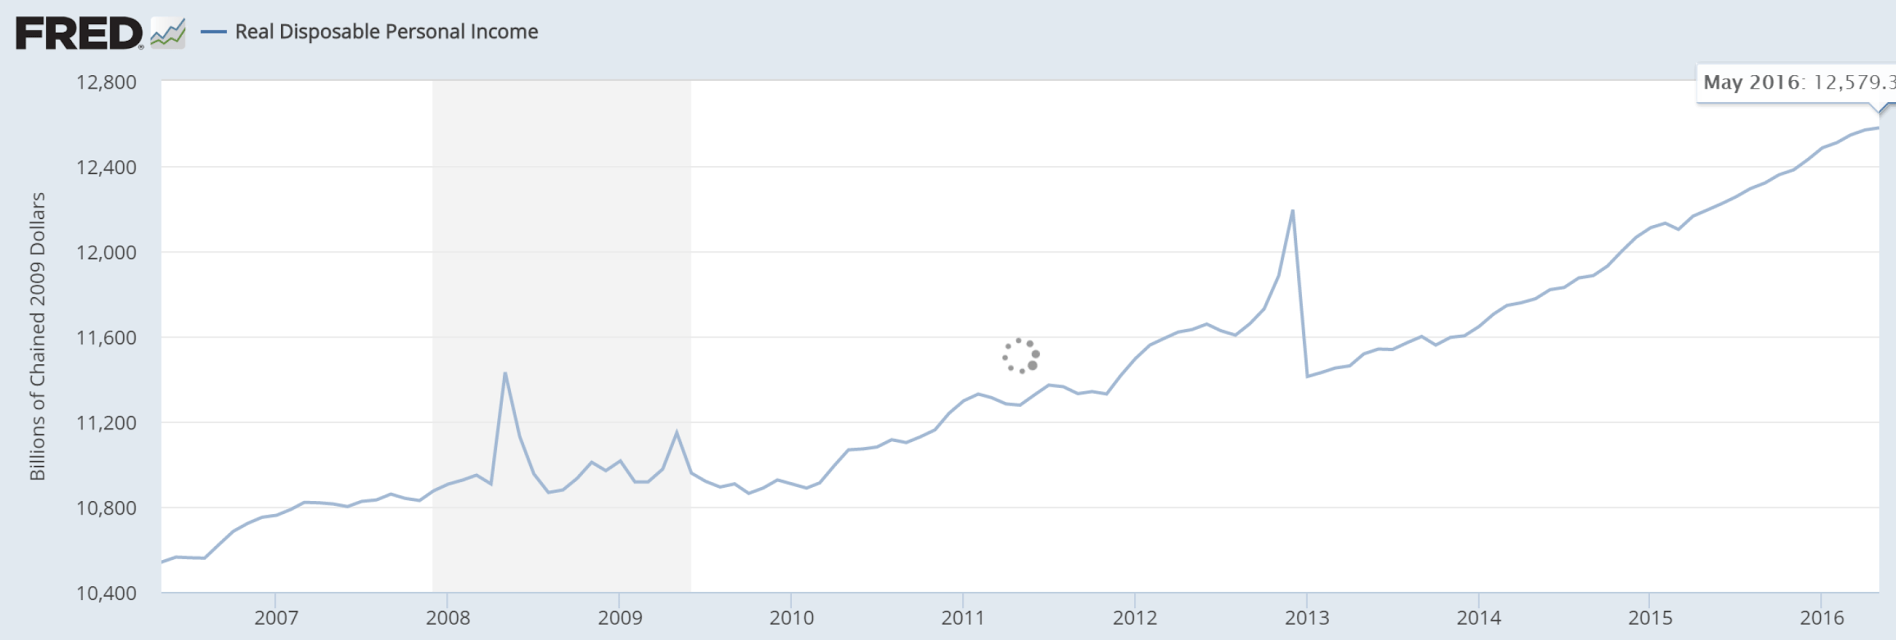
Note the damage done by the recession and then the tax hikes (Jan 2013):

6-29-4
Not good- another April uptick that reversed in May, and this time with April being revised down as well. Housing is looking less and less likely to be contributing to growth this year:
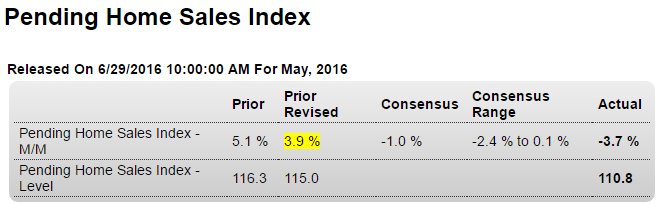
6-29-5

Highlights
Existing home sales have been trending higher but today’s pending home sales index, which tracks contract signings, may be pointing to slowing for the early part of the summer. The index fell a steep 3.7 percent in the May report to nearly reverse a downward revised 3.9 percent jump in April. Year-on-year, the pending sales index is down 0.2 percent which hints at moderation for the 4.5 percent rate of final sales. Details data show monthly declines across all four regions with year-on-year rates all flat near zero. Housing data have been up and down this year but behind the noise have been deceptively solid rates of growth, among the strongest rates of the nation’s slow-growth economy.

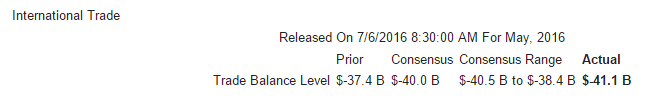
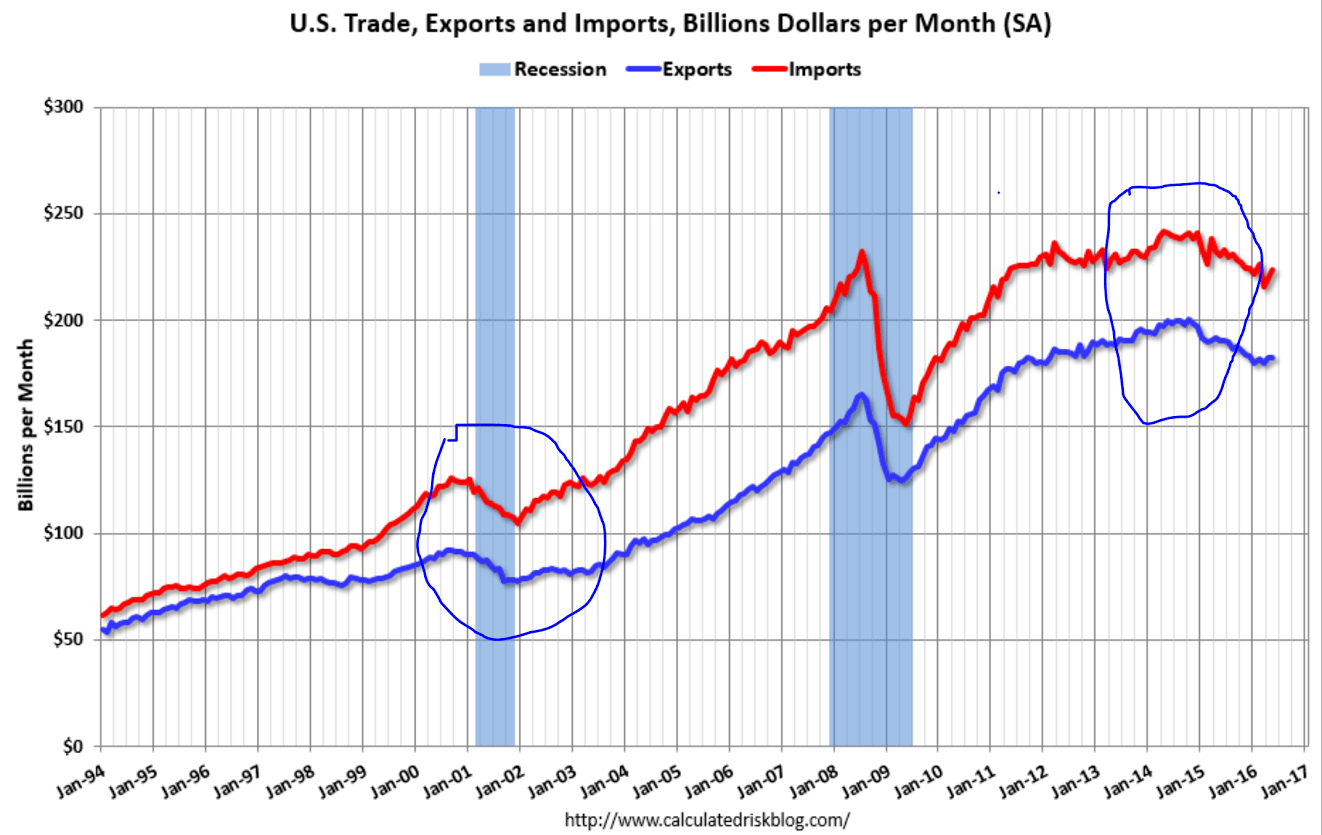
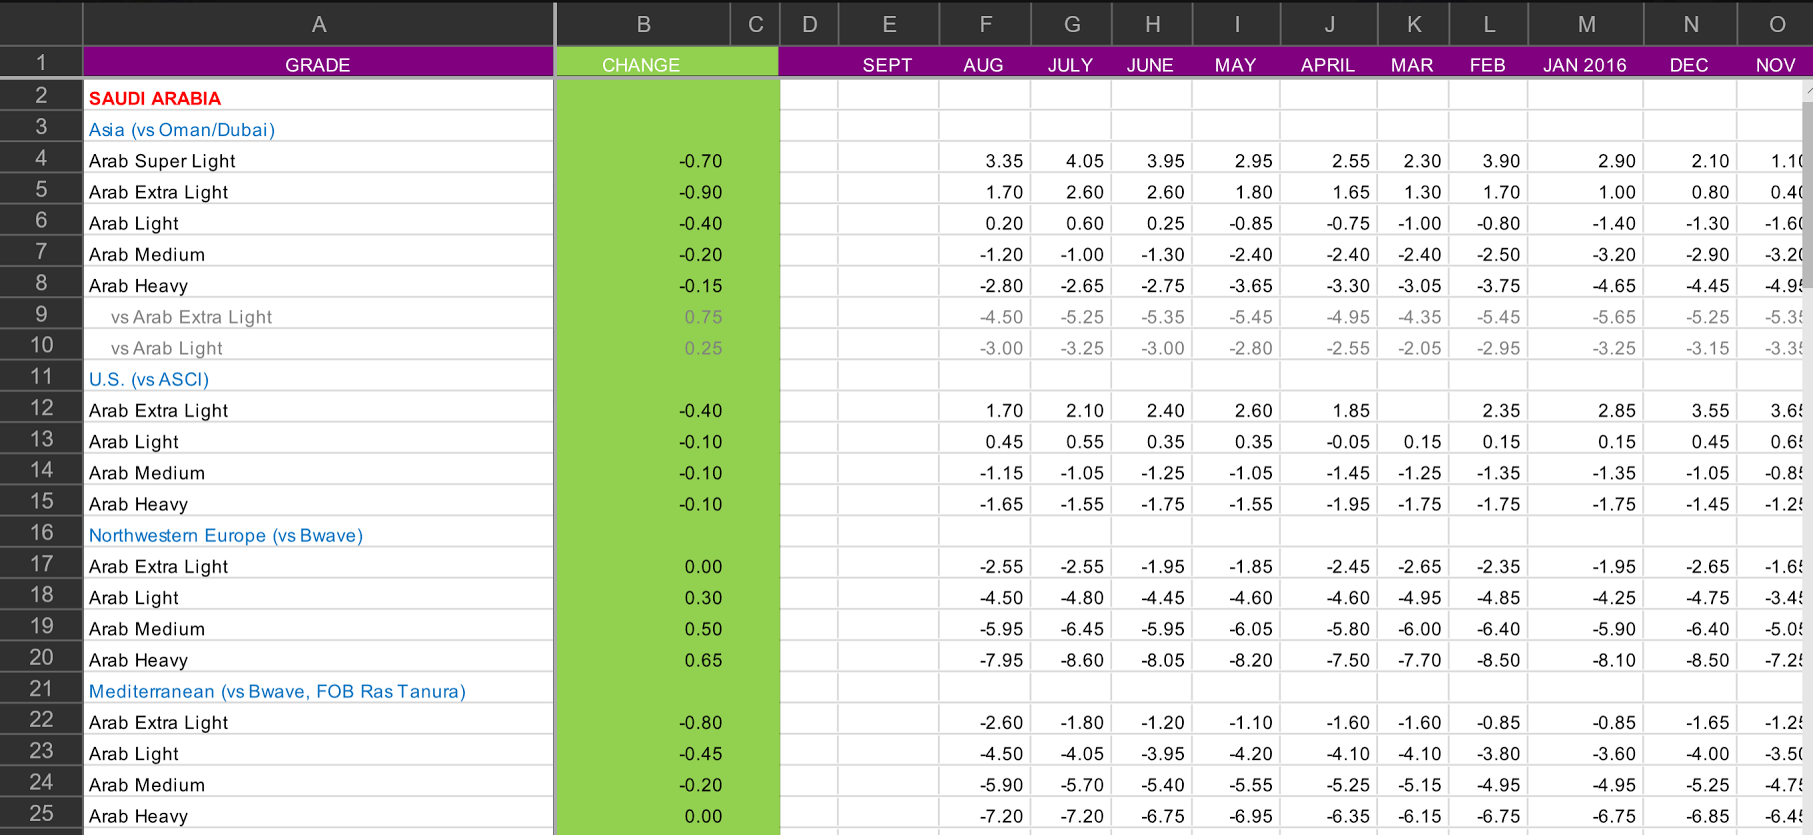
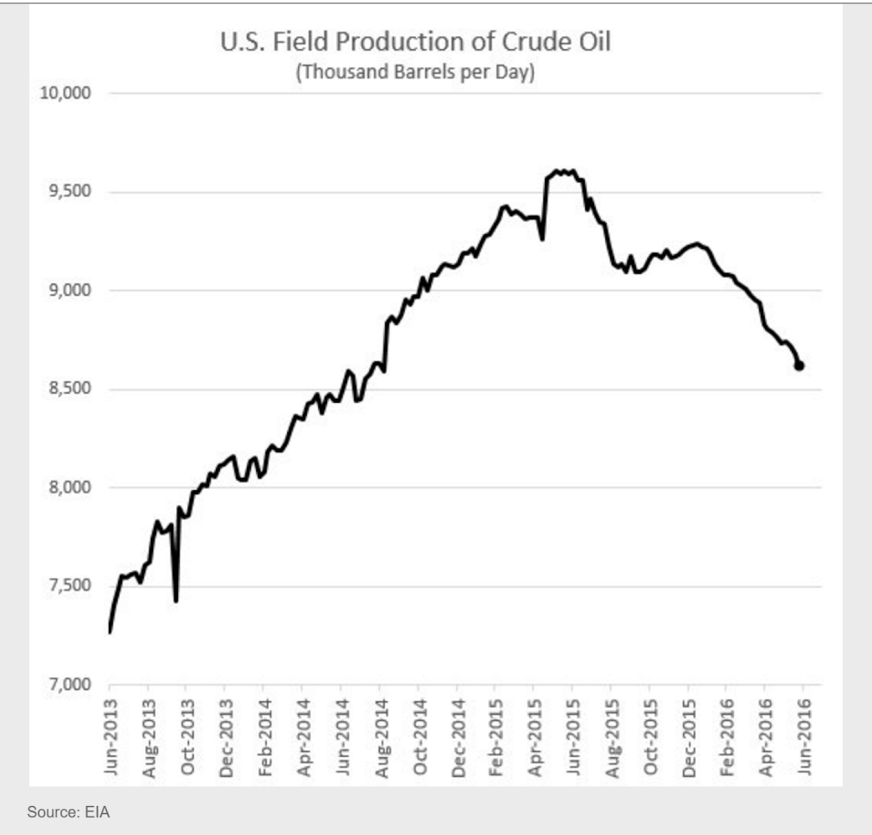
This is causing a rise in oil imports and is thereby dollar unfriendly:

6-29-6
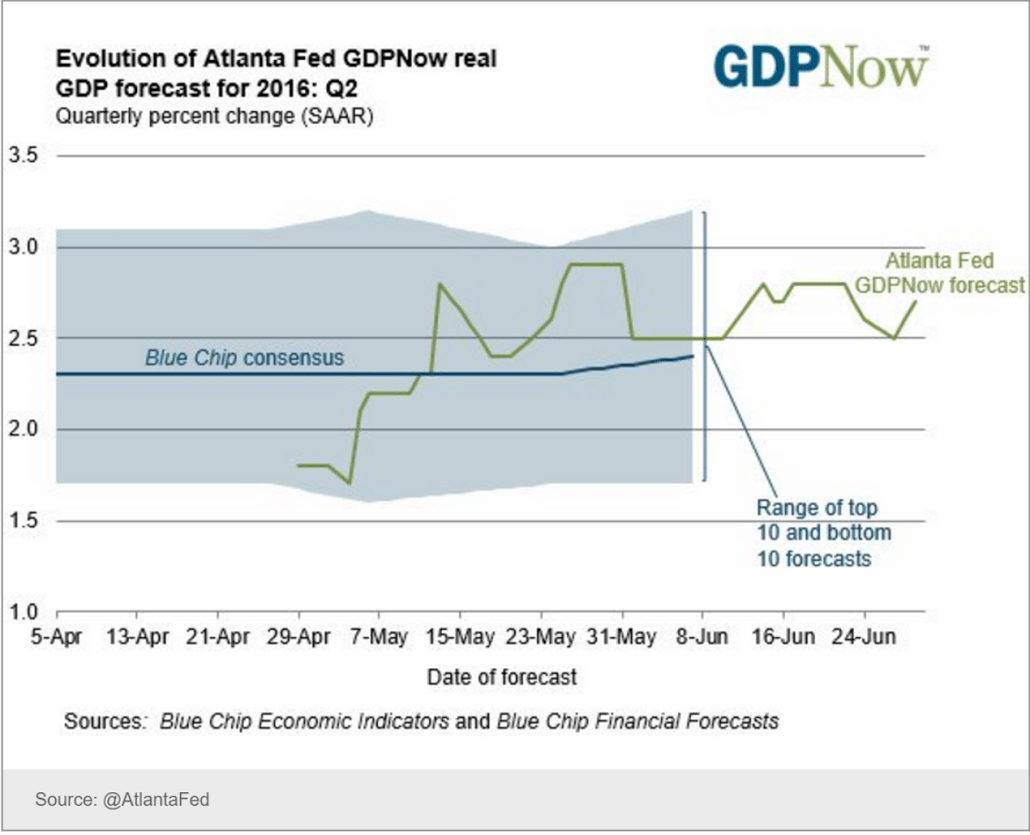
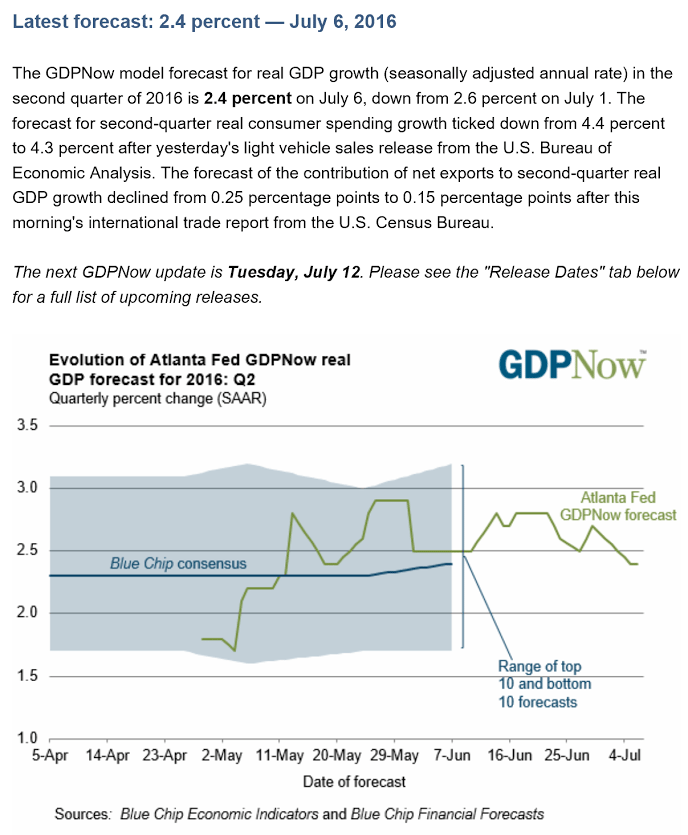
This is up based on the stronger April numbers that wouldn’t surprise me if they continue to reverse through June, which could dramatically lower this forecast:
6-29-7