ISM manufacturing index, PMI manufacturing, Construction spending

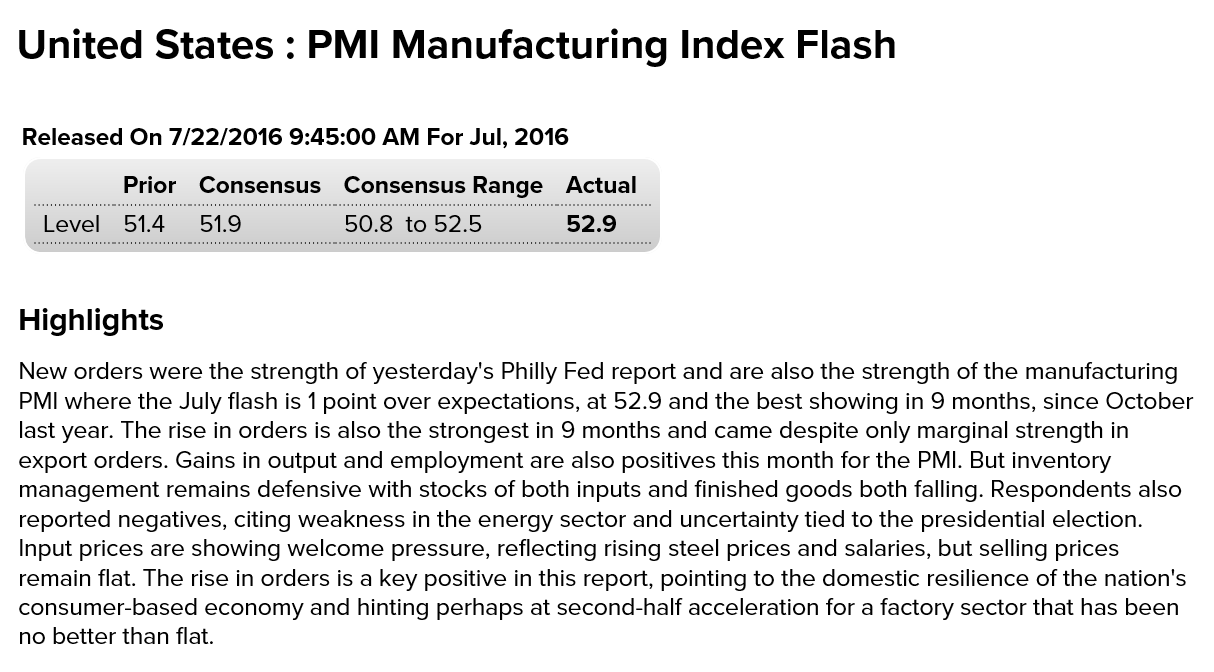
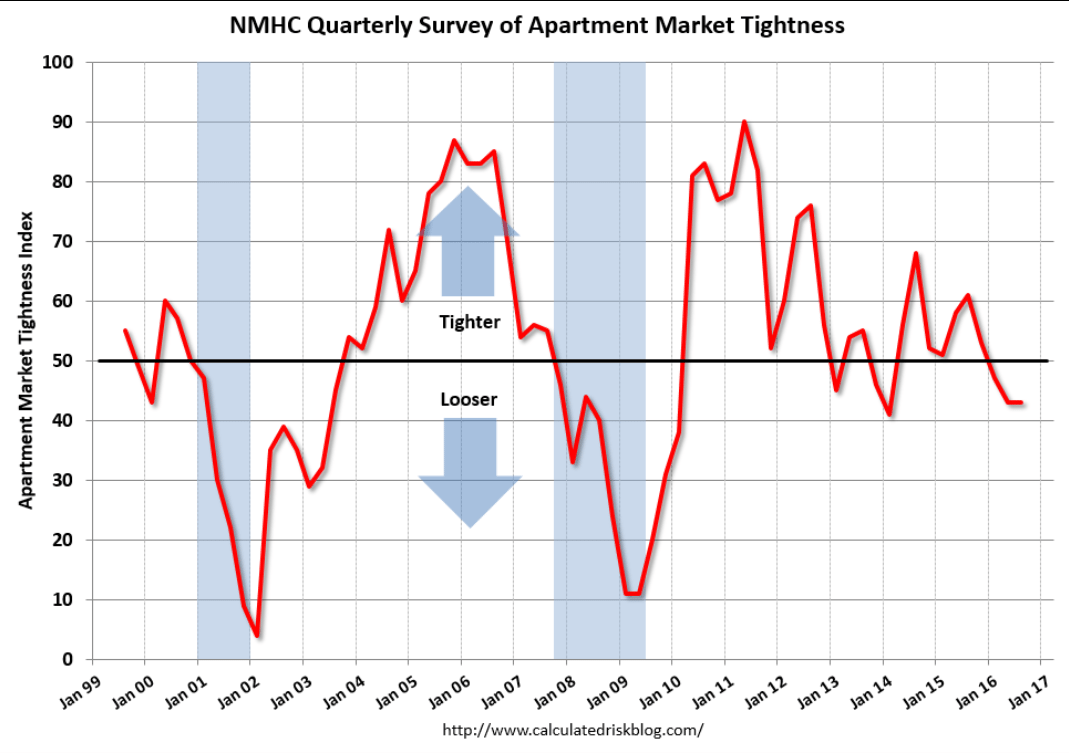
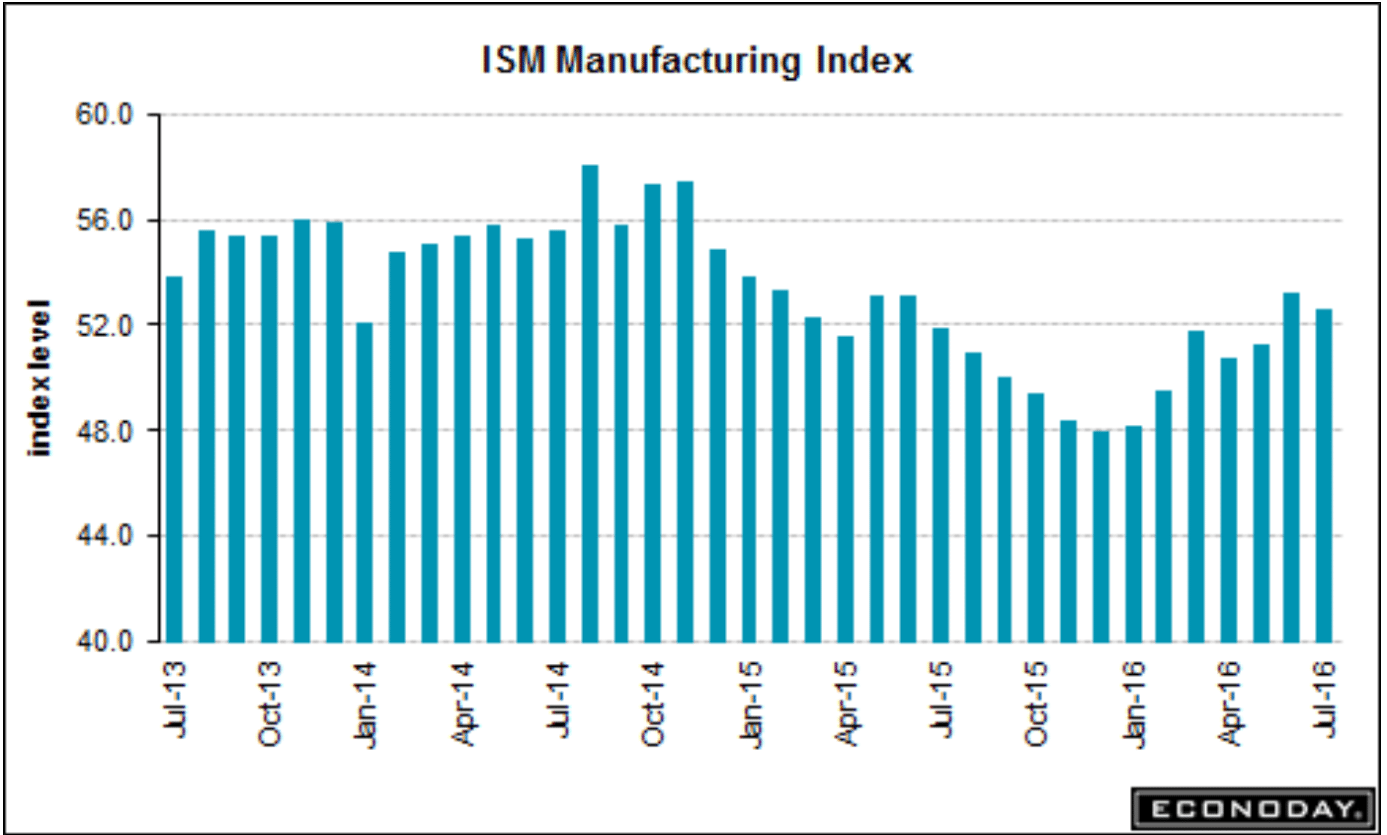
Manufacturing is showing signs of bottoming at the lower levels, as the lack of aggregate demand does it’s thing with the service sector:

8-1-1

Highlights
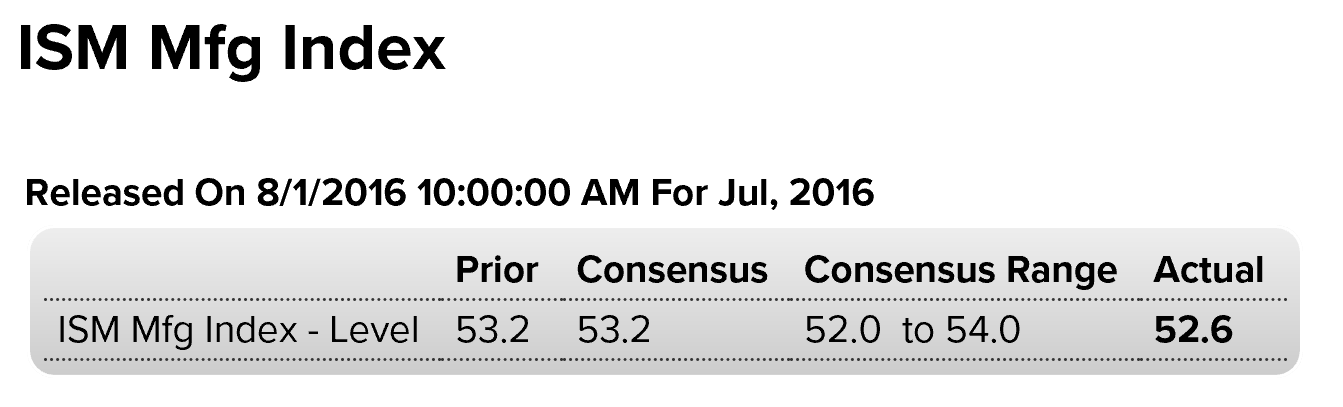
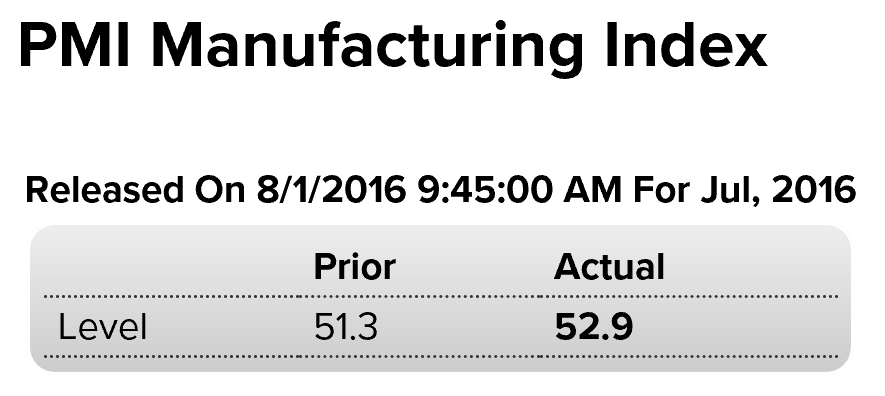
Employment fell slightly and delays in delivery times eased, two factors that held down the July ISM index to 52.6 vs June’s 53.2. But that’s not the important news. The important news is the new orders index which remains extremely solid, at 56.9 and pointing to future strength for employment as well perhaps as slowing for future deliveries (slowing in deliveries is an indication of strength in demand, of congestion in the supply chain).

Export orders are not as strong as domestic orders but they are respectable, at 52.5 which is safely above breakeven 50 to indicate monthly growth. The reading here echoes even stronger export results the manufacturing PMI which was released earlier this morning.

Production is solid in this report, at 55.4 for a 7 tenths gain in the month. Inventories are flat and prices for inputs are showing modest pressure.

But it’s the new orders index that is the standout in this report and which hints at badly needed improvement in government data where new orders have yet to show strength. If the ISM orders pan out, the economy looks to get a second-half lift from its lagging sector, the factory sector.

“The July PMI® registered 52.6 percent, a decrease of 0.6 percentage point from the June reading of 53.2 percent. The New Orders Index registered 56.9 percent, a decrease of 0.1 percentage point from the June reading of 57 percent. The Production Index registered 55.4 percent, 0.7 percentage point higher than the June reading of 54.7 percent. The Employment Index registered 49.4 percent, a decrease of 1 percentage point from the June reading of 50.4 percent. Inventories of raw materials registered 49.5 percent, an increase of 1 percentage point from the June reading of 48.5 percent.”

Read more at http://www.calculatedriskblog.com/#JQDxgoXe0yUEgICs.99

8-1-2
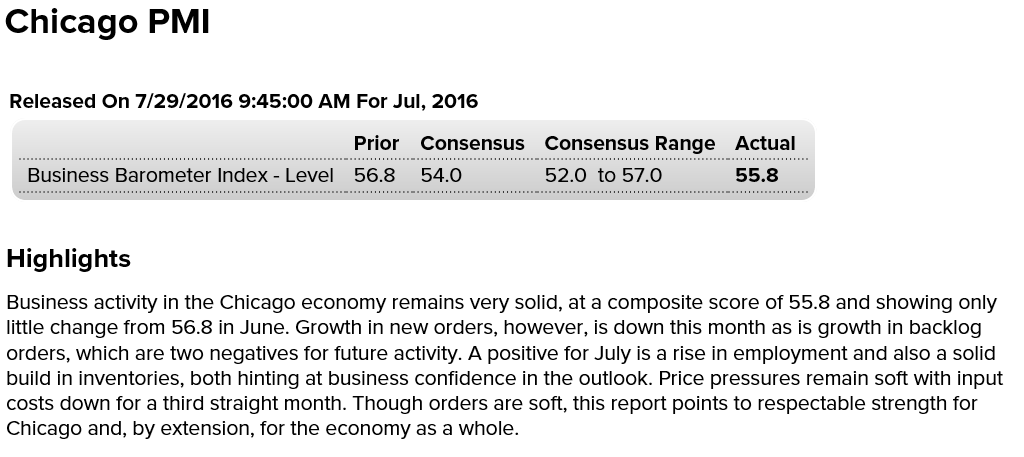
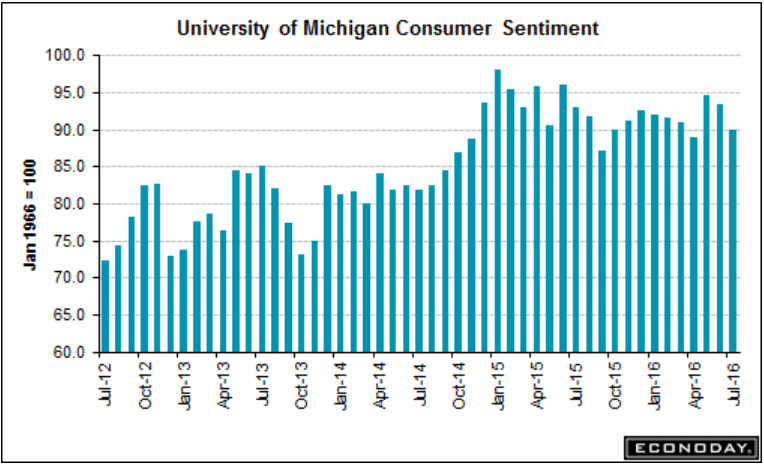
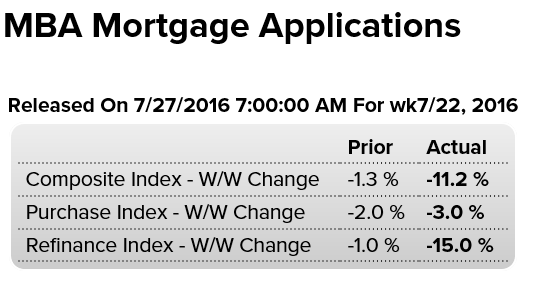
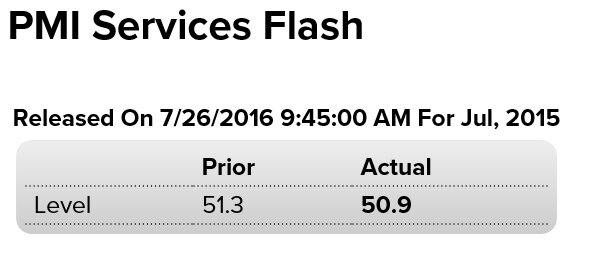
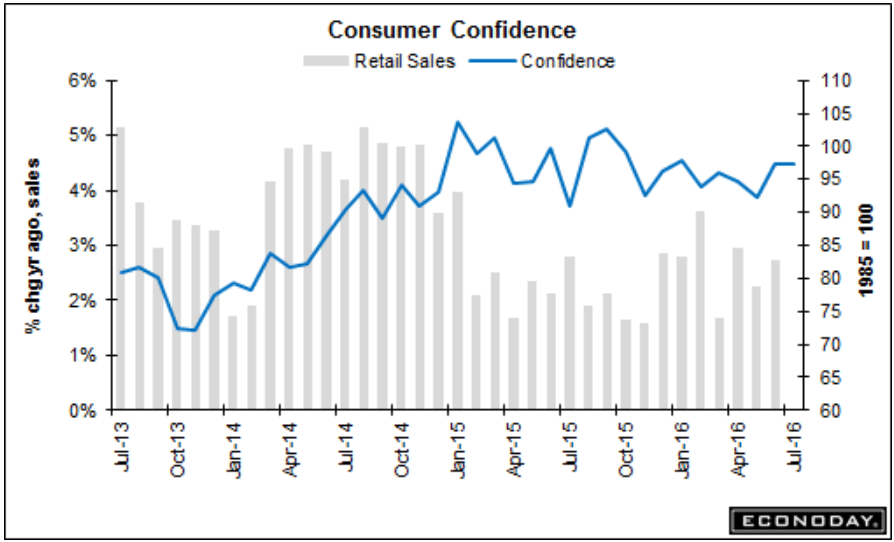
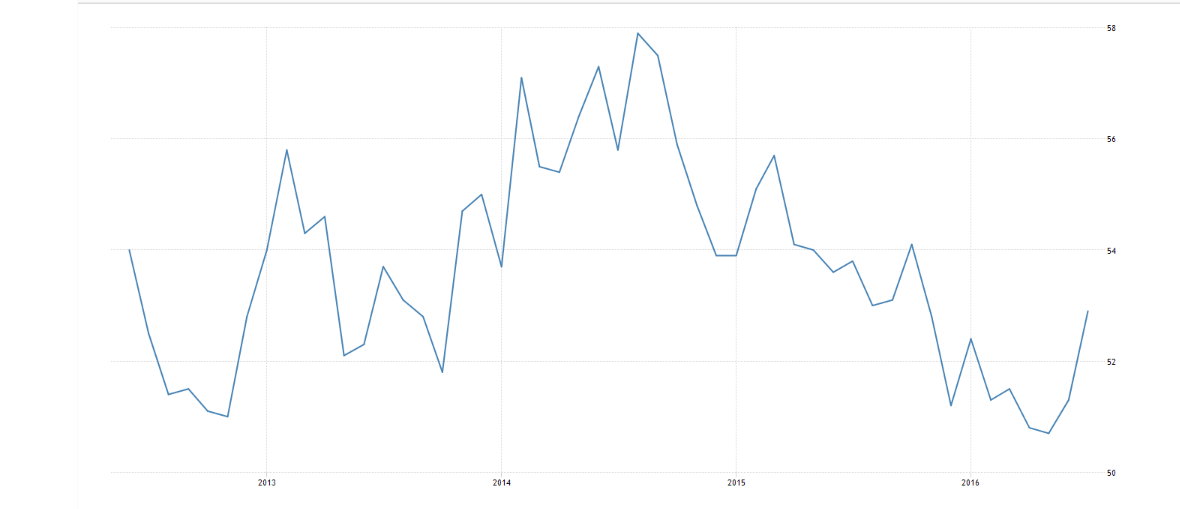
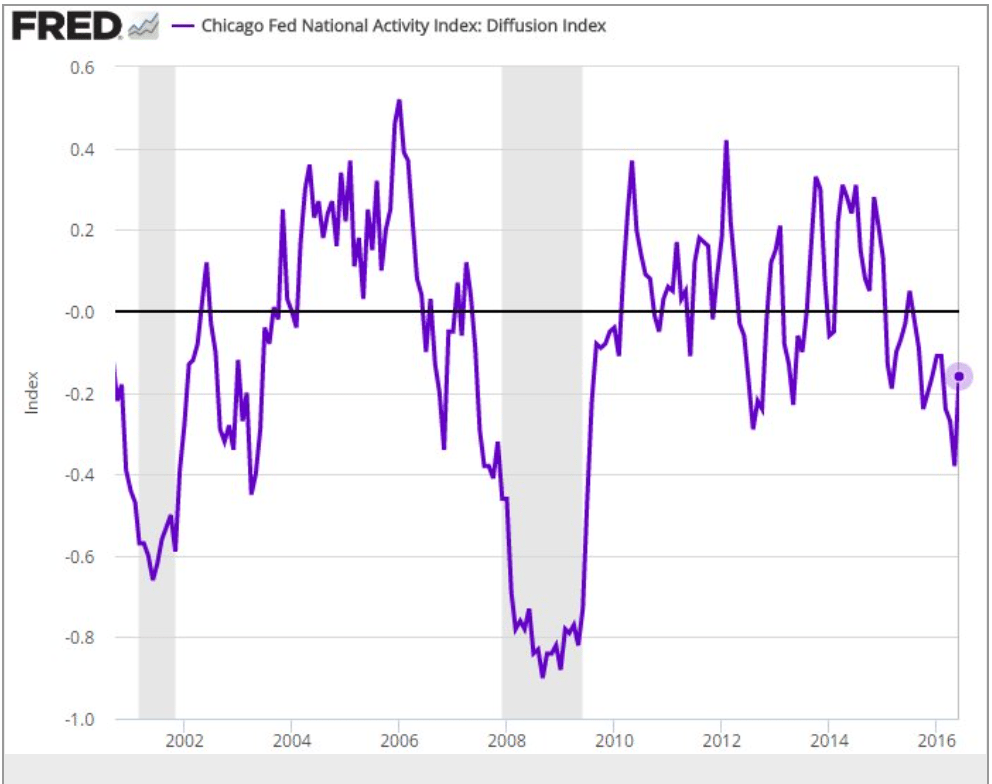
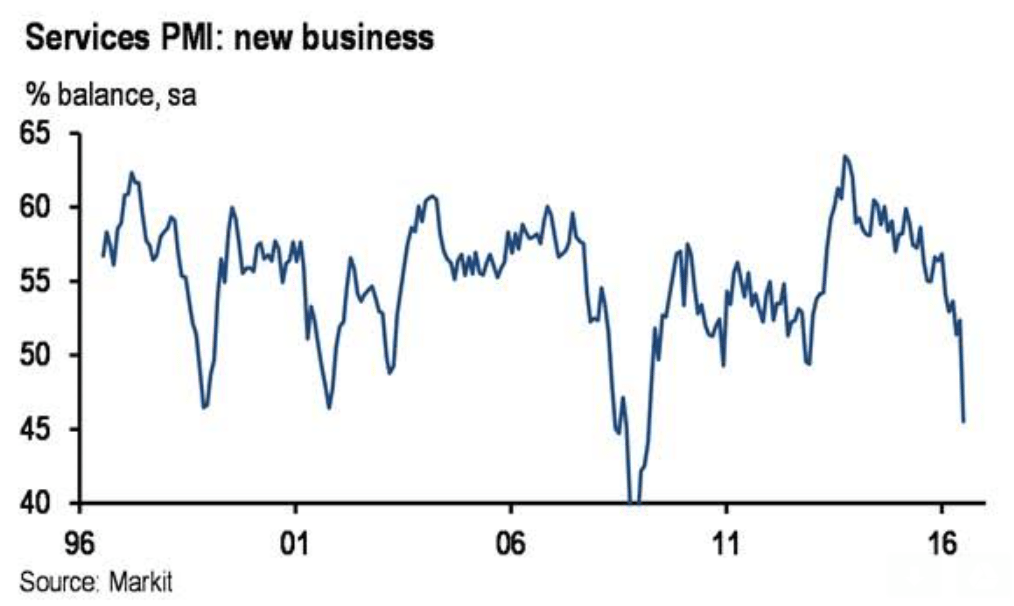
A bit at odds with the ISM, though still on the low side:

8-1-3
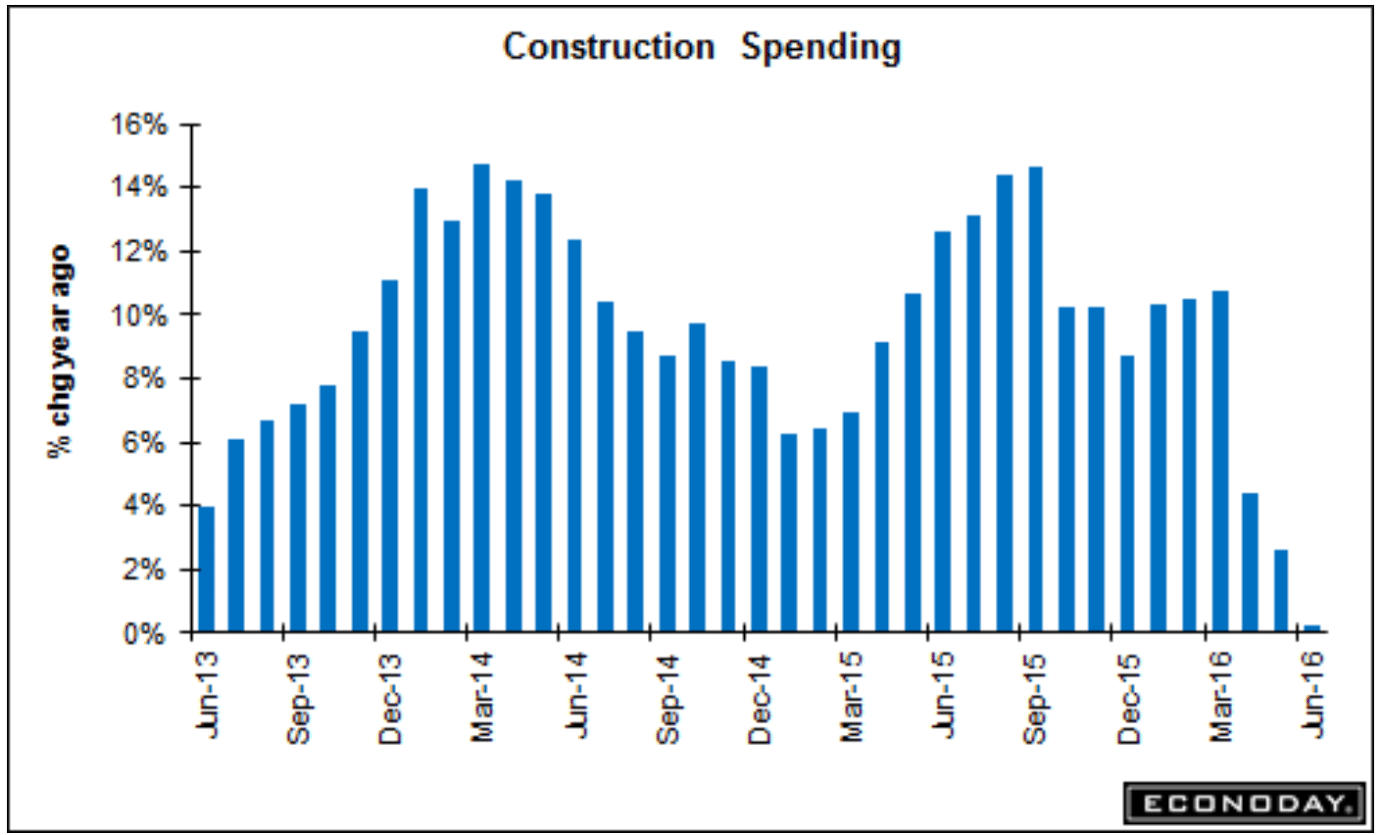
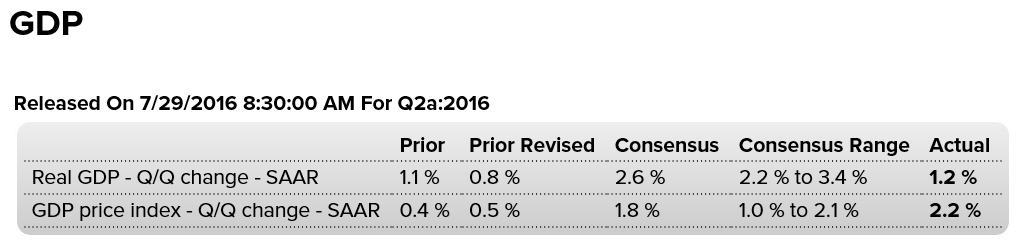
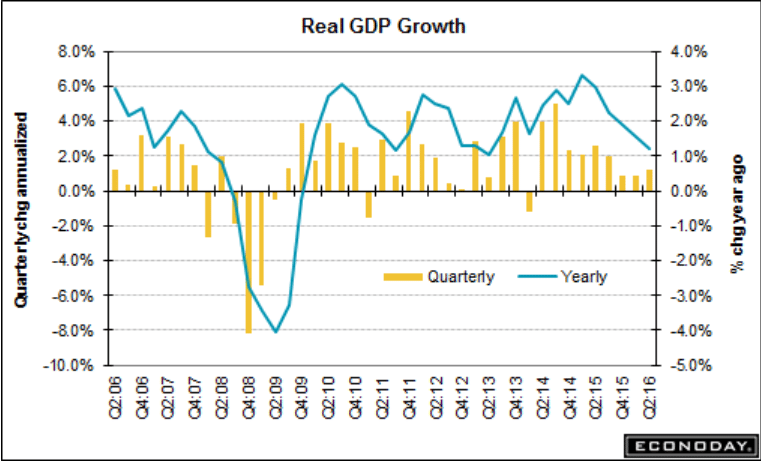
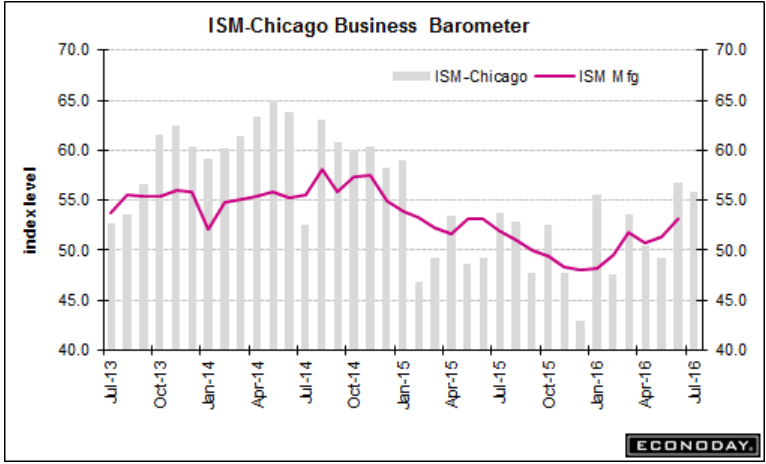
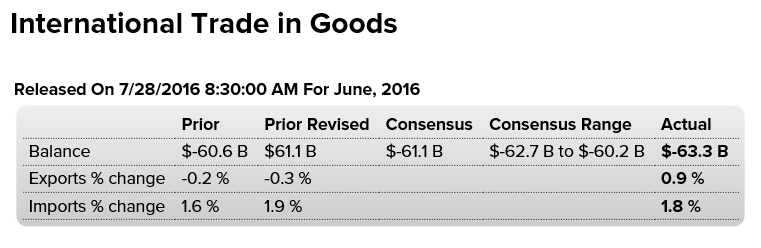
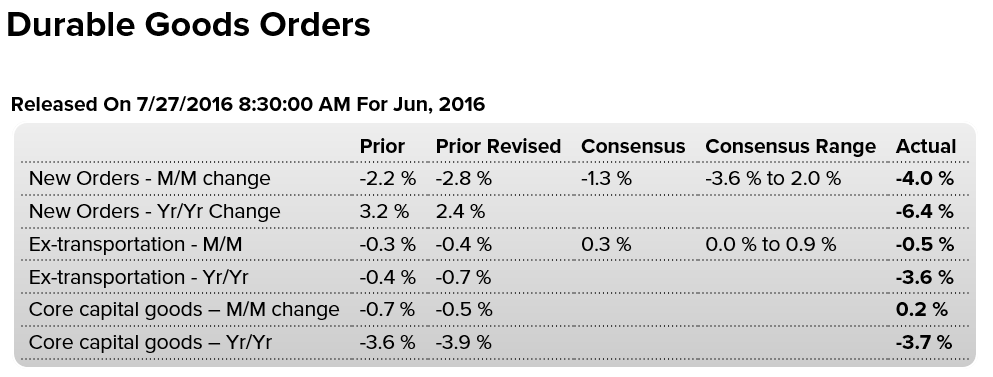
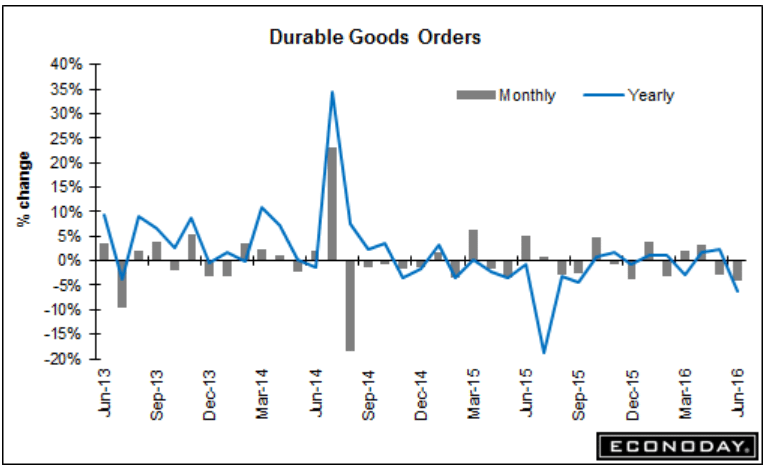
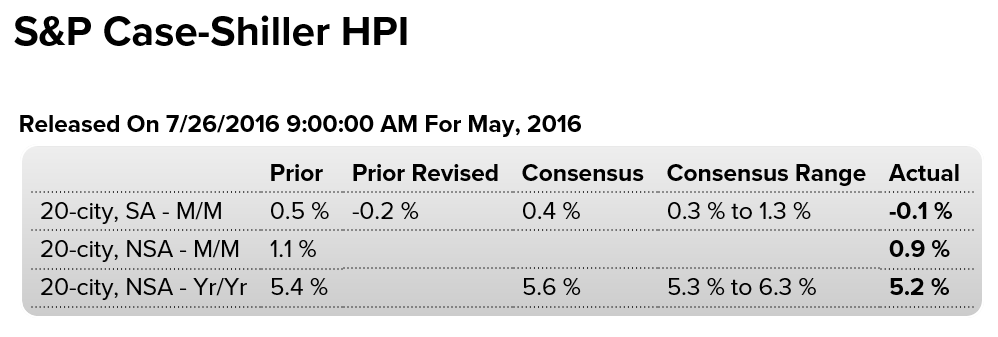
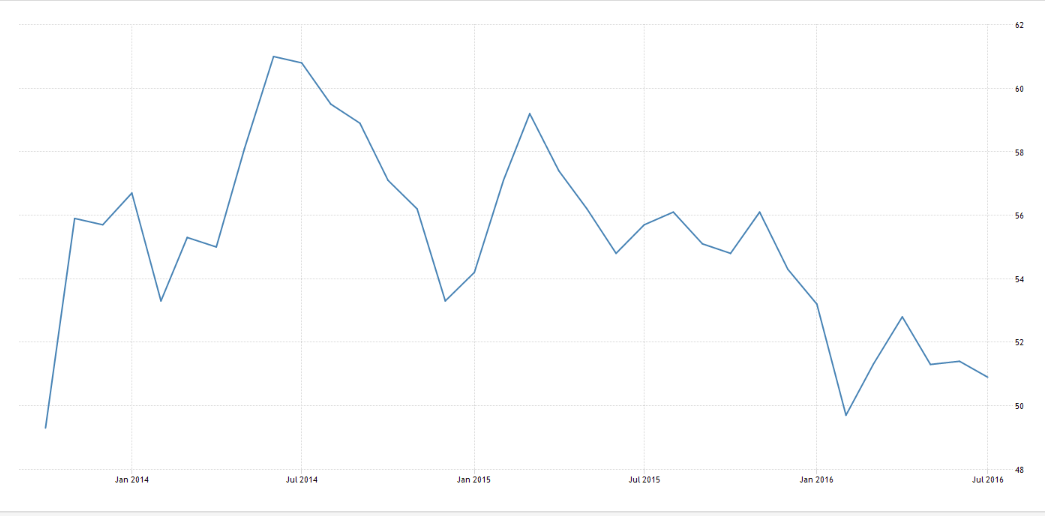
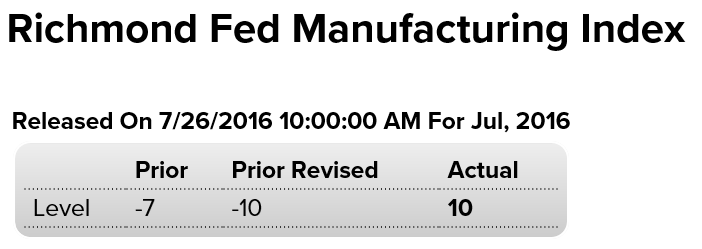
Worse than expected and the chart says it all:

8-1-4

Bank lending, Restaurant index, More on GDP

The deceleration that began with the peak in oil capex continues:

7-30-1
Trending lower ever since oil capex collapsed. But remember the hype for the one spike up it took early this year before reversing?

7-30-2

7-30-3
Wouldn’t surprise me if net trade, which worked in favor of Q2 GDP, reverses gets revised down for Q2 with the June data coming out on Tuesday, with growing oil imports, stronger non oil imports, and weaker exports as per the latest monthly data:

7-30-4

GDP, Chicago pmi, Consumer sentiment

Worse than expected, Q1 revised lower, and note the year over year deceleration in the chart. The inventory correction previously discussed looks to be well underway and has much further to go to bring inventories into balance with sales.

Problem is, sales growth is declining, and the downward spiral will continue until ‘borrowing to spend’ steps up to support the negative effects of what I call unspent income, aka savings desires. And the historical drivers of private sector deficit spending- housing, cars, and business investment- are all going the wrong way.

And note that the much touted increase in consumer spending was in energy purchases, as prices went up, which tends to reduce other consumer purchases over time:

7-29-1
Highlights

Second-quarter GDP looks very weak at only a plus 1.2 percent annualized rate, but the details are positive. The biggest positive is consumer spending where growth, showing strength across readings, came in at a stellar 4.2 percent rate, more than double the first-quarter’s 1.6 percent rate.

A plus for the economy but a big negative in this report is slowing inventory accumulation which pulled down GDP by 1.2 percentage points in the quarter. But lean inventories point ahead to new accumulation which is a plus for future production and employment.

Another negative in the report is a reversal in residential investment, which had been running in the double-digit zone but which fell at an annualized 6.1 percent to pull down GDP in the second quarter by 2 tenths. A central concern remains nonresidential fixed investment, falling at a 2.2 percent rate and pulling down GDP by 3 tenths in the quarter. Weakness here points to weakness in business confidence and trouble ahead for productivity growth.

Price data do show some pressure with the overall index, reflecting the oil rebound, at 2.2 percent year-on-year, up from a revised 0.5 percent in the first quarter, but the core rate showing a little less pressure at 2.0 percent for, however, a still sizable 5 tenths gain.

Another negative is a 3 tenths downward revision to first-quarter GDP, now at a very thin plus 0.8 percent. But today’s report isn’t as bad it looks underscored by final demand which came in 2.4 percent or double the first-quarter’s rate. Low inventories are a plus for the third quarter as is the momentum underway in the economy’s central strength, the consumer.

7-29-2
Even this ‘stellar’ part of the report is very low vs prior cycles and working its way lower on an annual basis, which tends to minimize any seasonal factors:

7-29-3
And energy prices were what made it go up instead of down:

7-29-4

7-29-5
Down from last month, but a bit better than expected. New orders and backlogs soft, and the inventory build is more likely a sign of soft sales. And as the chart shows, it softened after the drop in oil capex and has yet to recover:

7-29-6

7-29-7
More evidence of the softening consumer extending into Q3. as the spike up a couple of months ago is now pretty much reversed. And, as previously discussed, this survey is one man one vote,
not one $ one vote, so with the fall in gas prices it’s likely to be overstating confidence:

7-29-8

Trade, KC manufacturing index, Atlanta Fed, Ford

Higher than expected, and last month revised higher as well. And oil imports are increasing as output falls and consumption remains firm:

7-28-1
More bad news doesn’t stop the KC Fed from calling for a rate hike:

7-28-2

Highlights
The good news didn’t last long for the Kansas City manufacturing index which, after popping to plus 2 in June for the first positive score since January last year, is back in the negative column at minus 6 in July. New orders are at minus 5 with backlog orders at minus 3. Not surprisingly, employment is at minus 5 and isn’t like to move up until orders pick up. Production is at minus 15 and shipments are at minus 17. Price data show modest pressure for inputs but continued contraction for selling prices. Inventories are flat. This year’s snap back for oil, which is now fading somewhat, hasn’t yet made for much improvement for this or the Dallas Fed report. Despite bright spots in isolated readings, the manufacturing sector continues to hold down the nation’s economic growth.

7-28-3
Down to 1.8%. I’m still thinking lower due to larger inventory adjustments, though it may come with the later revisions:

7-28-4
So they are just now waking up to the fact that total vehicle sales have been dropping for the last year?

Lackluster U.S., China sales drag on Ford Motor profit; shares tumble

By Bernie Woodall

July 28 (Reuters) — Ford Motor reported weaker-than-expected profit in the second quarter, and said its full-year earnings forecast was at risk with U.S. auto sales expected to fall in the second half, sending shares tumbling in premarket trading. Auto sales in the United States and China were lower than anticipated in the quarter, and Ford reported its first quarterly loss in the Asia Pacific in three years.

7-28-5

Mtg apps, Durable goods orders, Pending home sales, Apple and Cat comments

7-27-1

Highlights
Purchase applications for home mortgages were down 3.0 percent in the July 22 week following the previous week’s 2.0 percent decline, while refinancing applications, which tend to be even more sensitive to interest rates, fell a sharp 15.0 percent. The decrease brought the Purchase Index down to the lowest level since February, and the year-on-year gain in purchase applications was pared down to 12 percent from the prior week’s 16 percent gain. Mortgage rates extended their rebound from three-year lows, with the average rate for 30-year fixed-rate mortgages on conforming loans ($417,000 or less) rising 4 basis points to 3.69 percent. The second weekly decline in purchase applications in tandem with increases in mortgage rates underscores the current dependency of the housing market on low-interest financing. Especially if rates have already bottomed, the Mortgage Bankers Association report indicates a slowdown in home sales growth, which had been robust in part thanks to extremely low and declining mortgage rates.

So Q2 ends with a very weak June report. Remember the somewhat upbeat April report that triggered talk of Fed hikes?

7-27-2

Highlights
Orders proved very weak for the factory sector for a second straight month in June, down 4.0 percent and outside Econoday’s low estimate. Core readings are also soft with ex-transportation also lower for a second month, down 0.5 percent, with core capital goods (nondefense ex-aircraft) higher but up by only 0.2 percent and following two straight prior declines of 0.5 and 0.9 percent.

Orders for civilian aircraft, which are always volatile month to month, fell nearly 60 percent in June, offsetting for the transportation group a solid 2.6 percent gain for vehicles. But vehicles are by far the best news in the report with nearly all other sectors posting declines and some sharp declines including computers, down 9.1 percent in the month, communications equipment at minus 2.3 percent, and primary metals down 1.3 percent.

Total unfilled orders are a very serious negative, down 0.9 percent following no change in May and suggesting that factories have been keeping production up by working off backlogs which is a negative for future employment. And factories did keep busy in the month as indicated by the previously released industrial production report and by a 0.4 percent gain for shipments in this report. A plus for employment is another draw in inventories, down 0.2 percent and taking the stock-to-sales ratio down to 1.64 from 1.65.

Year-on-year rates reinforce the sense of weakness. Total orders are down 6.4 percent which outside of an aircraft-distorted 19 percent decline in July last year is the weakest in 4 years. Ex-transportation orders are down a year-on-year 3.6 percent with core capital goods down 3.7 percent which, strikingly, is the 17th decline in 18 months — confirmation of weakness in both domestic and global business investment. Shipments of capital goods, which are inputs into the nonresidential fixed investment component of GDP, fell 0.4 percent in June which is a second straight decrease and will not be raising estimates for Friday’s second-quarter GDP report.

Anecdotal reports on the factory sector have been less negative than this report, which however is a definitive report. And the monthly headline decline in today’s report is the most severe since August 2014. The factory sector may not be coming be alive as hoped going into the second half of the year.

7-27-3
Also worse than expected:

7-27-4

Highlights
Pending sales of existing homes, which track contract signings, have been showing less strength this year than final sales, a factor that may limit disappointment over June’s thin 0.2 percent rise. Year-on-year, pending sales are up only 1.0 percent vs 3.0 percent for final sales. Regional data for pending sales, as they are in the existing home sales report, are unusually balanced, ranging from a year-on-year plus 1.8 percent for the South to minus 1.8 percent for the West. Housing data have been choppy but healthy, pushing to cycle highs during the spring selling season, though this report does hint perhaps at a possible flat patch for the summer.

Earnings way down, but marginally better than expected so rally time! (Apple sales are/were about 1% of GDP)

Apple Earnings Fall on iPhone Slump

By Daisuke Wakabayashi

July 26 (WSJ) — Apple Inc. said its quarterly profit fell 27%. Revenue fell for a second straight quarter. Apple said net income was $7.8 billion in the fiscal third quarter that ended June 25, down from $10.68 billion in the year-ago period. Earnings per share fell to $1.42 from $1.85. Revenue declined 14.6% to $42.36 billion from $49.6 billion a year earlier. Apple said it sold 40.4 million iPhones during the three-month period, compared with sales of 47.5 million units a year earlier. While iPad revenue increased 7% because of its pricier iPad Pro, unit sales fell for a 10th-straight quarter, down 9% to 9.95 million.

Caterpillar Cuts Guidance, Announces More Job Cuts

By Bob Tita

July 26 (WSJ) — Second-quarter sales of machinery and engines dropped 17% from a year ago to $9.65 billion. Operating profit from machinery and engines plunged 44% to $678 million. Caterpillar trimmed its full-year profit outlook to about $2.75 a share, or $3.55, without restricting costs. The company had previously forecast $3 a share, or $3.70 without restructuring. Over all for the quarter, the company reported a profit of $550 million, or 93 cents a share, down from $802 million, or $1.31 a share, a year earlier. Excluding restructuring costs, earnings per share were $1.09. Revenue slid 16% to $10.34 billion.

PMC, Oil prices

PMC ride August 5th and 6th coming up fast!

First, thanks to all of you who’ve donated this year!

For the rest, hoping you’ll dig deep and donate this year, which also means you stay on my otherwise free email list! ;)

100% of donations got to cancer research at Dana Farber- all overhead is sponsored. The 2 day ride raised $45 million last year, $500 million since inception!

For me this is a ‘must give’, and just saying I personally donate a whole lot more than shows on my donation page.

So just click here now thanks:
http://www2.pmc.org/profile/WM0015

Been riding 3-4 hours a day getting in shape:

7-26-12
And not a mention of the last round of Saudi price cuts that obviously caused the recent price declines:

7-26-13

Redbook retail sales, Home price index, PMI services, New home sales, Consumer confidence, Richmond manufacturing index

Still down and out:
7-26-1

7-26-2

NYC condo price index:

7-26-3

7-26-4

7-26-5
Good report here for June, and may revised higher as well. However, no home is built without a permit, so new home sales end up at the same place as permits, and total permits aren’t looking so good. And note the level is still well below all prior cycles, and the charts are not population adjusted:

7-26-6

7-26-7
Total permits- single and multi family:

7-26-8
Single family permits doing a bit better than multi family:

7-26-9
Better than expected but still drifting lower:

7-26-10
And note this comment:

Buying plans for autos are soft, down nearly 2 percentage points to 10.8 percent in a reading that will bring down estimates for July vehicle sales. Buying plans for homes and appliances are steady.

Better than expected. However manufacturing remains depressed, and the lack of spending is spreading to other sectors:

7-26-11

PMI, Commercial and Industrial loan growth, Japan trade

A bit better than expected, and the narrative sounds hopeful, but the chart still looking like there’s a long way to go to get back to where we were before the collapse of oil capex. And no sign of emergence of deficit spending- private or public- to drive top line growth:

7-25-1

7-25-3
Looks to me like this measure of bank loan growth has been going downhill ever since the collapse in oil capex:

7-25-4
Japan is rebuilding it’s trade surplus that made the yen the strongest currency in the world and consequently their selling of yen to keep the yen appreciation in check to sustain ‘competitiveness’ allowed them to build their hoard of $ reserves. It was the shutting down of their nuclear power generation after the earthquake that resulted in the increased energy imports which turned trade to deficit. Lower energy prices and a weaker yen have contributed to the reversal. At some point I expect circumstances to pressure the Ministry of Finance to resume yen sales to support their exporters.

Note too that both imports and exports have been declining, evidencing the general weakness in global demand:

Japan Balance of Trade 1963-2016

Japan recorded a 692.84 JPY billion surplus in June of 2016, compared to a 60.90 JPY billion surplus a year earlier and beating market consensus of a 494.8 JPY billion surplus, as exports fell less than imports. Year-on-year, sales dropped by 7.4 percent to 6,025.46, JPY billion in June, following a 11.3 percent fall in May, while markets expected a 11.6 percent decline. Imports decreased by 18.8 percent from a year earlier to 5,332.63 JPY billion, compared to a 13.8 percent decrease in a month earlier and above market estimates of a 19.7 percent drop. In May 2016, the country posted a 40.72 JPY billion trade deficit, the first gap since January. From January to June 2016, Japan posted a 1,810 JPY billion trade surplus, the first surplus since the second half-year of 2010.

7-25-5

Apartment market tightness, Chicago diffusion index, Equity flows, UK PMI and public sector deficit, Union Pacific

Looks like a bit of oversupply from new construction, and it didn’t take much of that, either, as construction has been well below prior cycles:

“Apartment markets remain strong, but the surge of new apartment construction is starting to shift the supply-demand balance, particularly in the market for upscale apartments,” said Mark Obrinsky, NMHC’s Senior Vice President of Research and Chief Economist. “Given that most new supply is class A, we’re not seeing the same shift in class B and C apartments. In addition, some weakness in the Market Tightness Index may be just seasonality.”

Read more at http://www.calculatedriskblog.com/#LSMKAUerapUOBGK4.99

7-22-1

7-22-2
May be an indication of investors being ‘underweight’ euro:

7-22-3
And foreigners going ‘overweight’ dollars:

7-22-4
Seems the UK deficit has gotten too small to support the credit structure, particularly in the context of Brexit uncertainty:

7-22-5

7-22-6

Union Pacific Profit Falls 19% as Demand Remains Under Pressure

By Imani Moise and Tess Stynes

July 21 (WSJ) — For the three months ended June 30, Union Pacific’s total freight volume fell 11% as a 2% increase in shipments of agricultural products was offset by declines in volume for other commodities. Coal volume slumped 21% and industrial products volume dropped 11%. Volume in its intermodal business, which moves freight using a combination of trains and trucks, fell 14%. Union Pacific reported an overall profit of $979 million, or $1.17 a share, down from $1.2 billion, or $1.38 a share, a year earlier. Revenue decreased 12% to $4.77 billion.

Architecture Billings Index, Teen employment

Going nowhere:

Key June ABI highlights:

  • Regional averages: South (55.5), West (54.1), Northeast (51.8), Midwest (48.2)
  • Sector index breakdown: multi-family residential (57.9), institutional (52.7), mixed practice (51.0), commercial / industrial (50.3)
  • Project inquiries index: 58.6
  • Design contracts index: 49.7
  • From the AIA: Architecture Billings Index remains on solid footing

    Buoyed by increasing levels of demand across all project types, the Architecture Billings Index (ABI) was positive in June for the fifth consecutive month. As a leading economic indicator of construction activity, the ABI reflects the approximate nine to twelve month lead time between architecture billings and construction spending. The American Institute of Architects (AIA) reported the June ABI score was 52.6, down from the mark of 53.1 in the previous month. This score still reflects an increase in design services (any score above 50 indicates an increase in billings). The new projects inquiry index was 58.6, down from a reading of 60.1 the previous month.

    “Demand for residential projects has surged this year, greatly exceeding the pace set in 2015. This suggests strong future growth for housing in the coming year,” said AIA Chief Economist, Kermit Baker, Hon. AIA, PhD. “While we expect to see momentum continue for the overall design and construction industry in the months ahead, the fact that the value of design contracts dipped into negative territory in June for the first time in more than two years is something of a concern.”

    7-21-8
    Read more at http://www.calculatedriskblog.com/#jQIsto1d5SHQiCkA.99

    Explains some of the recent volatility in employment numbers?

    7-21-9