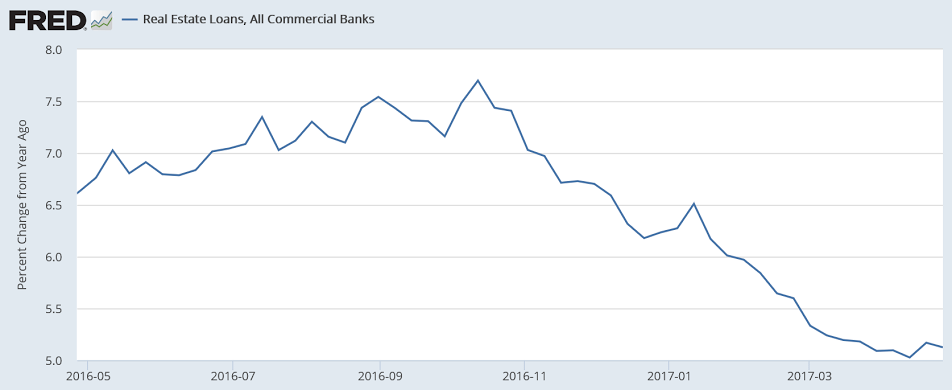
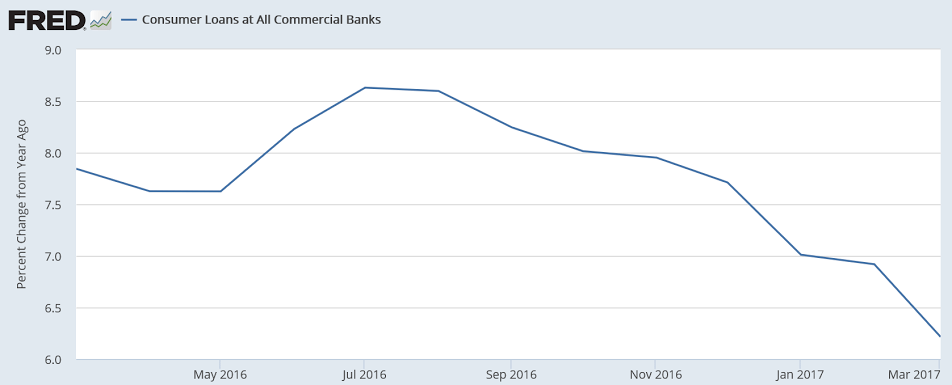
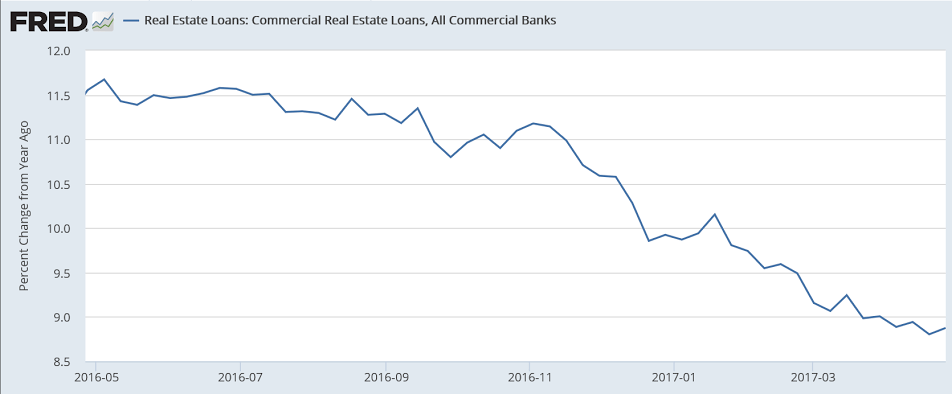
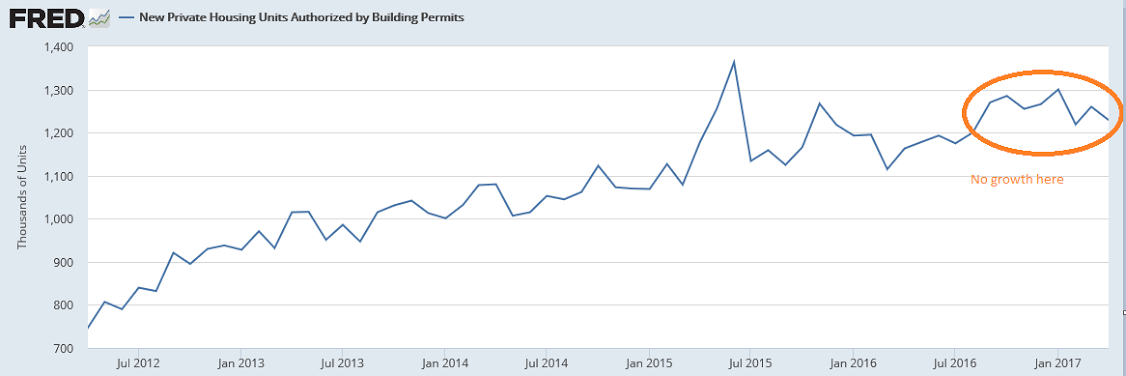
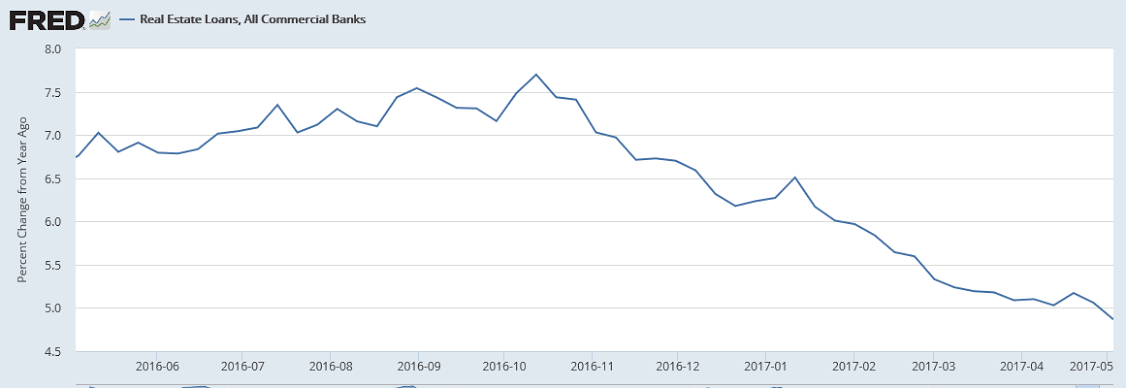
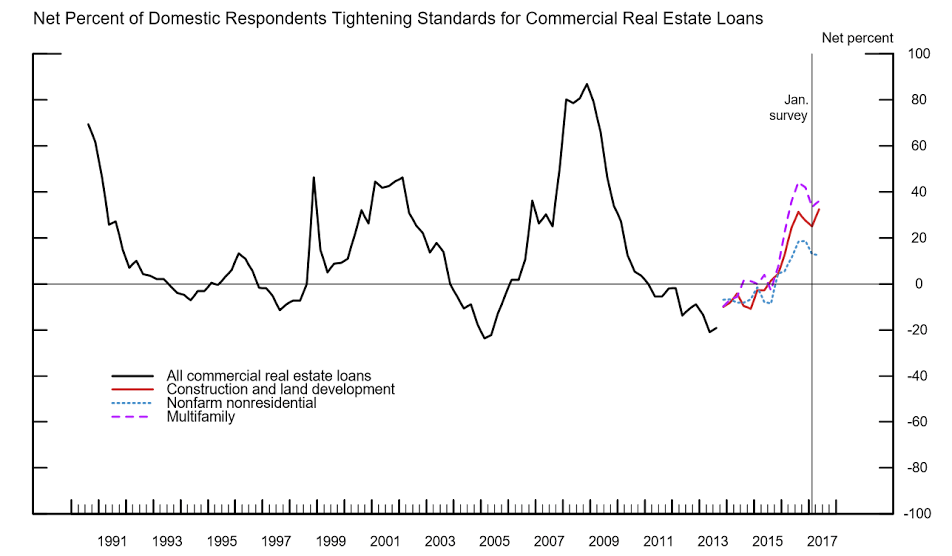
New applications seem to be modestly increasing even as bank lending for real estate has been flat and decelerating:

Hard to say which is worse for markets- if Trump remains as President or if he is removed:


New applications seem to be modestly increasing even as bank lending for real estate has been flat and decelerating:
Hard to say which is worse for markets- if Trump remains as President or if he is removed:
No surprise here, after seeing what mortgage lending has been doing:

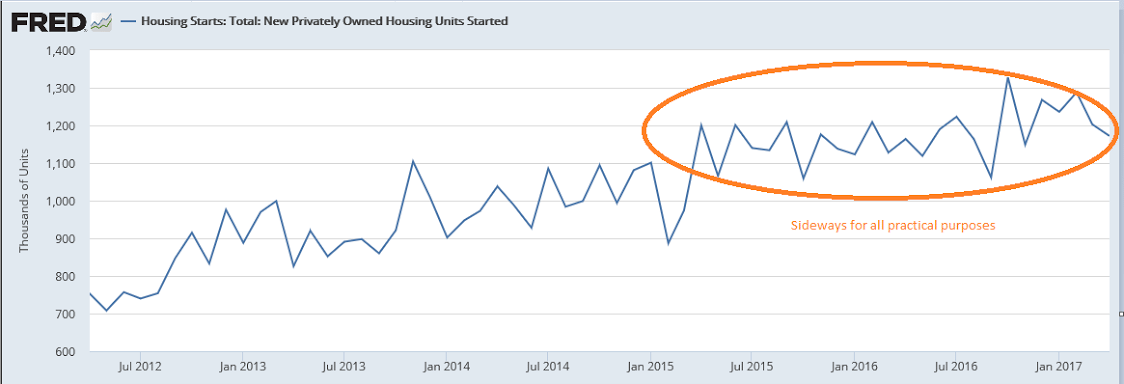
Highlights
A topping out from lower-than-indicated expansion highs is the news from the April housing starts report where levels, though still healthy, are disappointing. Starts fell 2.6 percent to a 1.172 million annualized rate that is well below Econoday’s low estimate for 1.215 million. Downward revisions are a factor in the report, totaling 27,000 in the prior two months.
The strength in the report is in the key single-family component with starts up 0.4 percent to a rate of 835,000. Otherwise, however, the report is filled with minus signs. Permits for single-family homes fell 4.5 percent to a 789,000 rate with completions also down 4.5 percent, to 784,000.
The sharpest weakness comes from multi-family homes where starts fell 9.2 percent to a 337,000 rate. Permits did rise 1.4 percent to 440,000 but completions dropped 17.2 percent to a 322,000 rate.
April was supposed to be a rebound month for the economy. It was for the jobs report but bounces in last week’s retail sales and consumer price reports were minimal with today’s report an outright negative for the second quarter. Still most housing data, especially sales, have been showing significant strength going into the spring sales season.
As previously discussed, industrial production is muddling through at modest levels with weakness spreading to the service sector. These numbers are not inflation adjusted, which means industrial production hasn’t even gotten back to the highs of the prior cycle:
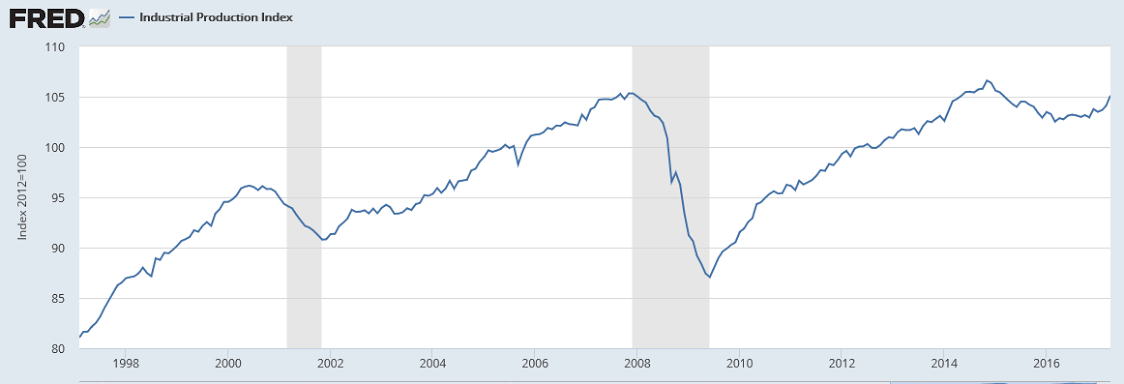
Stalled at lows of prior cycle:
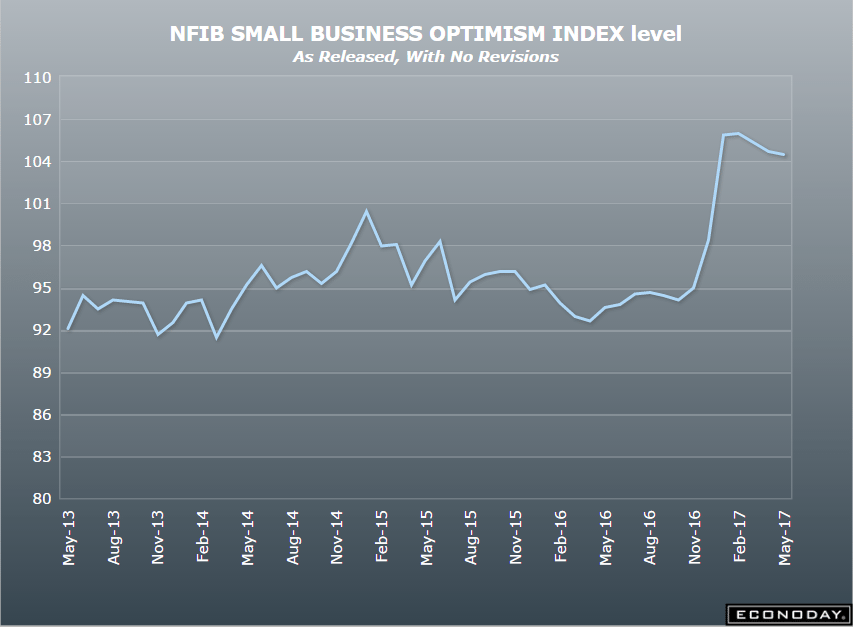
Trumped up expectations reversing?
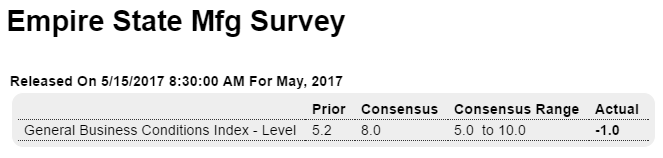
Highlights
Activity in the New York manufacturing region is flattening out this month following a run of unusually strong growth. May’s Empire State index came in at a lower-than-expected minus 1.0 with new orders also moving into the negative column to minus 4.4. Unfilled orders, which were very strong in April and March, also moved below zero to minus 3.7.
But the strength in prior orders is keeping production up, at a very solid plus 10.6 this month, and is also keeping hiring up, at 11.9 and only 2 points slower than April’s 2-year high. Delivery times continue to slow though to much a lesser degree than prior months which points to easing congestion in the supply chain. Inventories are flat and price pressures still increasing though, once again, less than before.
The slowing in this report is actually welcome news, giving time for supply constraints to ease and reducing risks of over heating. This report points to easing for Thursday’s Philly Fed where another month of enormous strength is currently the expectation. Yet despite the strength of anecdotal reports like Empire State and Philly, definitive factory data out of Washington have yet to show outsized acceleration. Watch for the manufacturing component of tomorrow’s industrial production, definitive data where only a moderate rise is expected.
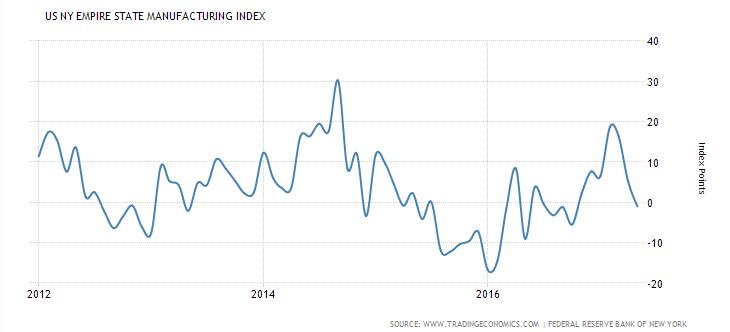
To me buyer traffic is most relevant:
The NAHB Housing Market Index in the United States rose to 70 in May of 2017 from 68 in April, beating market expectations of 68. The index is 1 point shy of 71 reached in March, which was the strongest reading since June 2005. The index of current single-family home sales went up 2 points to 76; sales expectations over the next six months increased 4 points to 79 while buyer traffic edged down 1 point to 51.
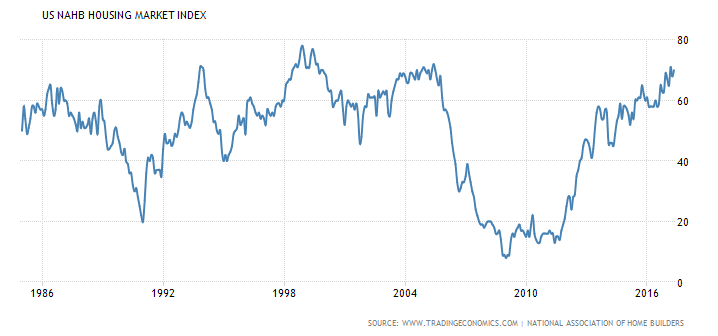
Not good:
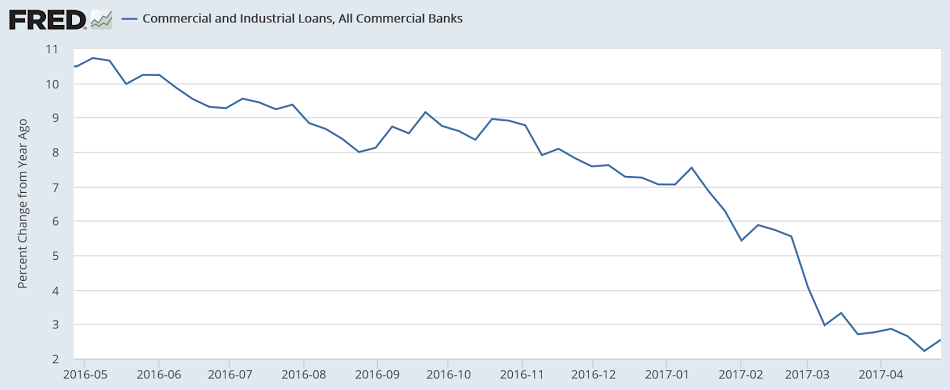
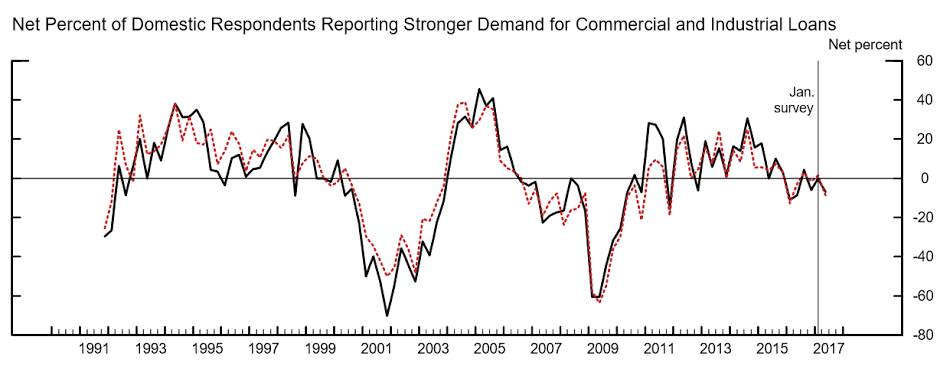
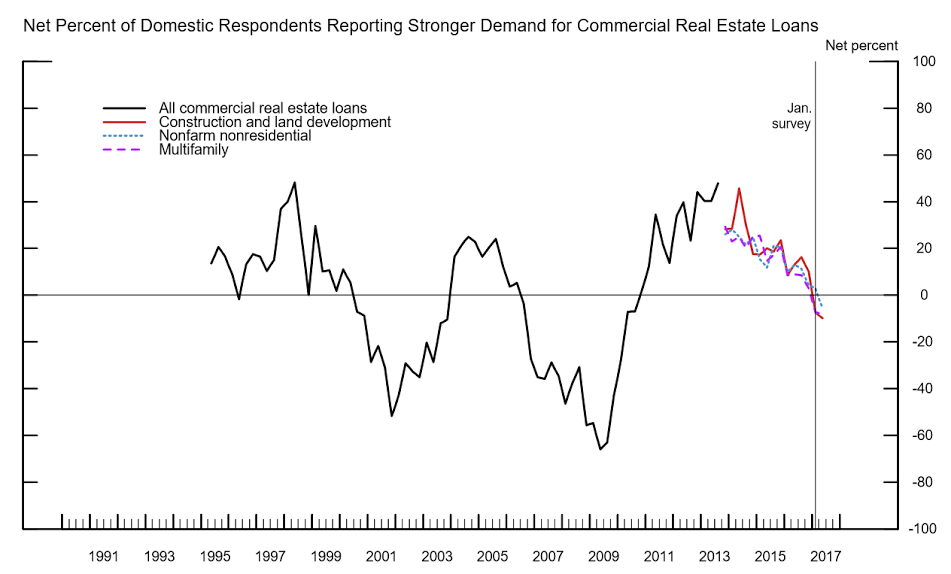
The worst news for the economy might be coming from banks, not retail
Loan issuance declined in the first quarter from the previous three-month period, the first time that has happened in four years, according to a SNL Financial. Commercial and industrial lending, which usually pops this time of year, posted just a small increase. The business climate, at least measured by the willingness to take on debt, remains cautious.
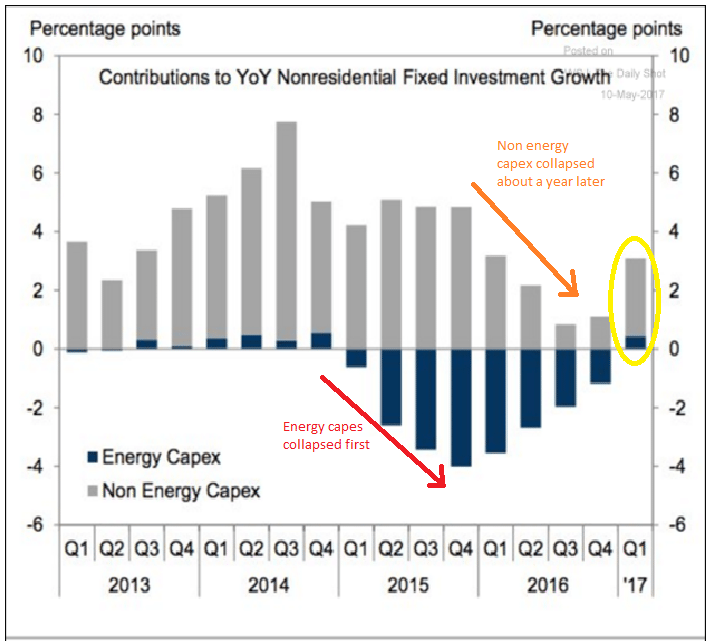
Energy capex collapsed first, followed by non energy capex about a year later. Question now is whether the Q1 non energy capex recovery continues into Q2. I suspect not. In any case the contribution to growth from energy capex is no longer negative but not all that much as a % of GDP:
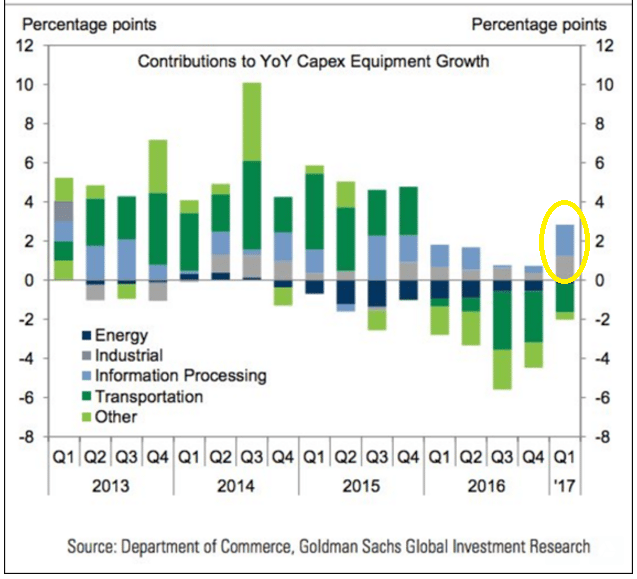
Tells me we still are experience an obvious lack of aggregate demand. We haven’t even gotten back prior highs and growth of these components has slowed dramatically from where it was before the crisis:
In case you thought any of these people had a clue. It’s all just more of the blind leading the blind:
Federal Reserve warned over maintaining big balance sheet
The Federal Reserve risks political interference and losing its independence if it
maintains a large balance sheet in the longer term, former Fed officials have claimed, as
debate (https://www.ft.com/content/99734cd6-2cf1-11e7-9555-23ef563ecf9a )
intensifies over the central bank’s strategy for unwinding its interventions in financial
markets.Kevin Warsh, a visiting fellow at the Hoover Institution at Stanford University and
former Fed governor, said that permanently holding vast quantities of assets like
treasuries was “fiscal policy in disguise” and risked turning the central bank into a
general purpose agency of the government“A large balance sheet is a dangerous temptation for the rest of the political class,” he
said in an interview at a conference at Stanford on Friday.Charles Plosser, former president of the Philadelphia Fed, said that politicians might, as
an example, push the Fed to purchase infrastructure bonds to help fund public works
and argue they were not interfering with monetary policy. “They will see that balance
sheet as a great opportunity to fund their spending without raising taxes,” Mr Plosser
said.
You can see how central bank reserve shifting worked to lower the euro vs the dollar.

Yes, we need a larger deficit, both short and long term, given current institutional structure that gives powerful incentives to not spend income. Not that the current proposals to do that are my first choice as to specific taxes to cut and expenditures to increase. Nor would I call it pump priming, but instead I’d call it removing fiscal restrictions:
Trump: Debt and deficits will rise, but it’s all in the name of growth
The president and his interviewer engaged in an exchange over the term “prime the pump.” It’s a commonly used phrase in economic circles and refers to spending, usually at the public level, to get the economy moving again. In addition to the tax cuts, Trump has advocated what could be $1 trillion in spending on infrastructure projects.
The term also is used to describe the classic Keynesian approach, something more closely associated with liberal Democratic philosophy than the conservative Republican train of thought that Trump professes to follow.
Interestingly, Trump said he was unfamiliar with “prime the pump” in economic terms.
“Have you heard that expression used before? Because I haven’t heard it,” he said. “I mean, I just … I came up with it a couple of days ago and I thought it was good. It’s what you have to do.”
Seems q2 GDP forecasts all coming down:
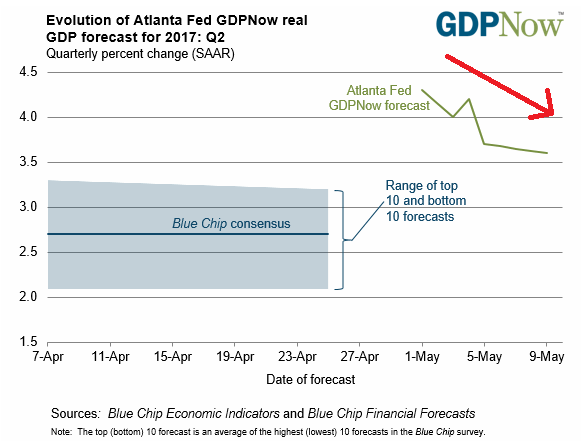
Trumped up expectations fading only slowly, as confirmed by stocks, etc:
A glimmer of hope seems to have faded:
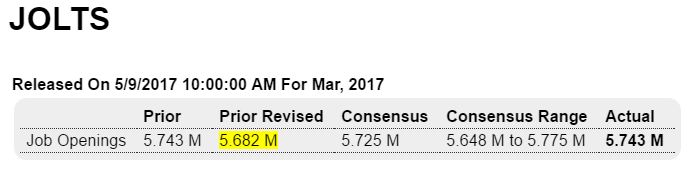
Highlights
There’s plenty of help-wanted signs but still too few qualified applicants. Job openings in March totaled 5.743 million, up from a revised 5.682 million in February and well ahead of hirings which totaled 5.260 million.Professional & business services, where employers often turn to first when they can’t fill staff themselves, shows a strong rise in openings, to 1.1 million for a 26,000 gain. But hirings for this component are down, 55,000 lower to 989,000 and pointing perhaps to hiring delays but also to lack of strong candidates. Manufacturing shows a 30,000 monthly rise to 394,000 openings with hirings up 26,000 to 322,000. Government also shows a strong gain for openings, up 33,000 to 537,000 and led by state & local education.
This report is consistent with tight conditions in the labor market and hints at the risk, at least for skilled workers, of wage inflation ahead.
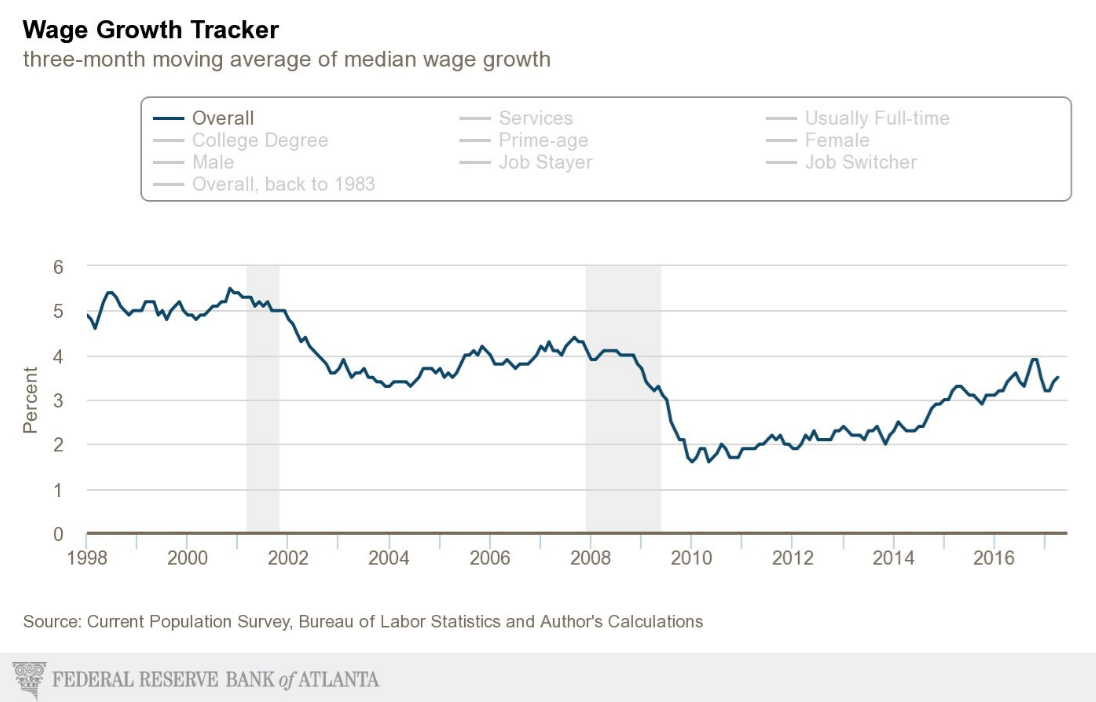
This chart still looks to me like it’s rolling over:

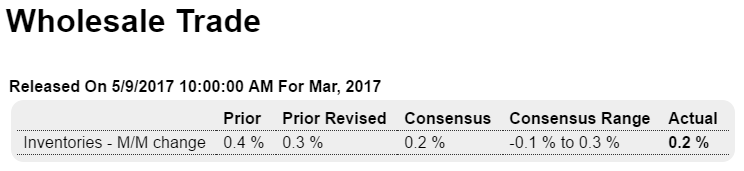
Highlights
Wholesale inventories came in at a consensus 0.2 percent increase led by a sharp build in autos, excluding which March inventories were unchanged. Sales in the wholesale sector were unchanged in the month though the mismatch with the inventory build does not lift the stock-to-sales ratio which holds at a healthy 1.28. These results will not upset expectations for an incremental 0.1 percent rise in Friday’s business inventories report. Inventories have been moving higher gradually, largely in line with underlying demand.
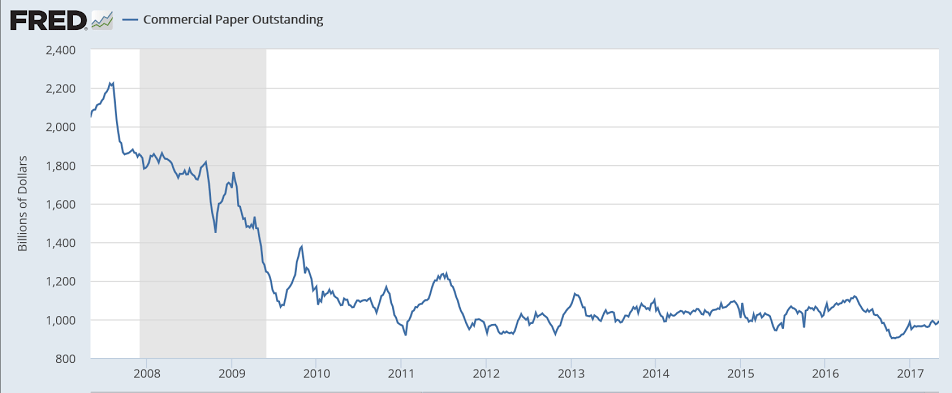
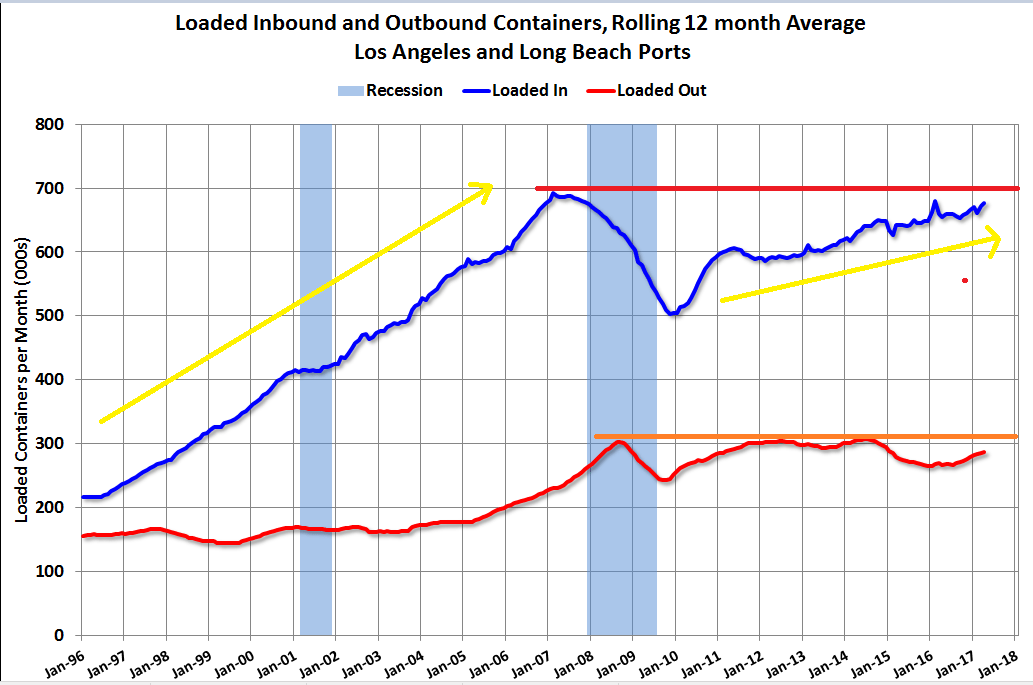
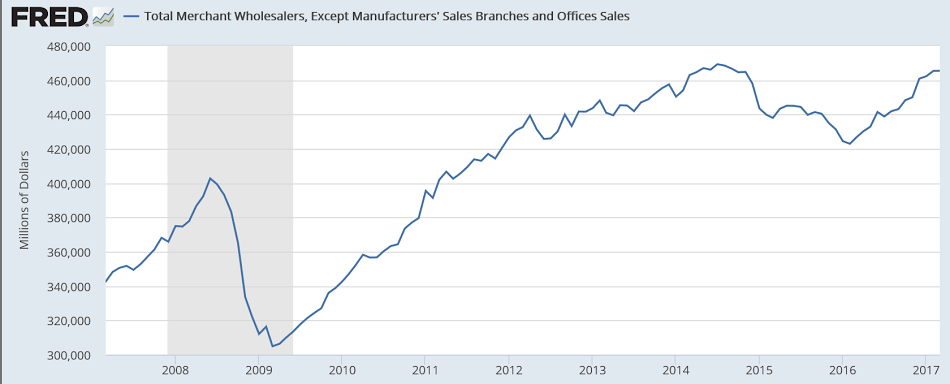
Looks like there’s already been a recession, and not coming back, but note that it’s also looking like it may have rolled over before reaching the prior highs, and this is not adjusted for inflation:
MMT going mainstream?
The Rock-Star Appeal of Modern Monetary Theory

Highlights
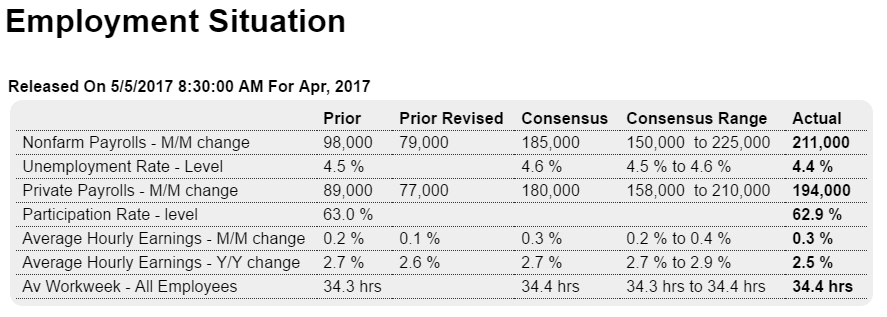
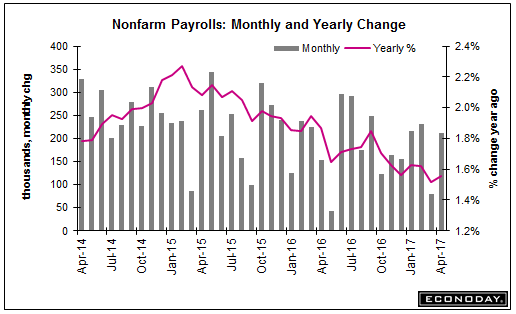
The labor train is back on the tracks as nonfarm payrolls reversed the prior month’s weakness and came in on the high side of expectations, up 211,000 in April vs a revised 79,000 in March for the third 200,000 plus reading so far this year. Payroll gains are centered in business services, in what points to capacity constraints among employers, and also government which added 17,000 to April’s total.
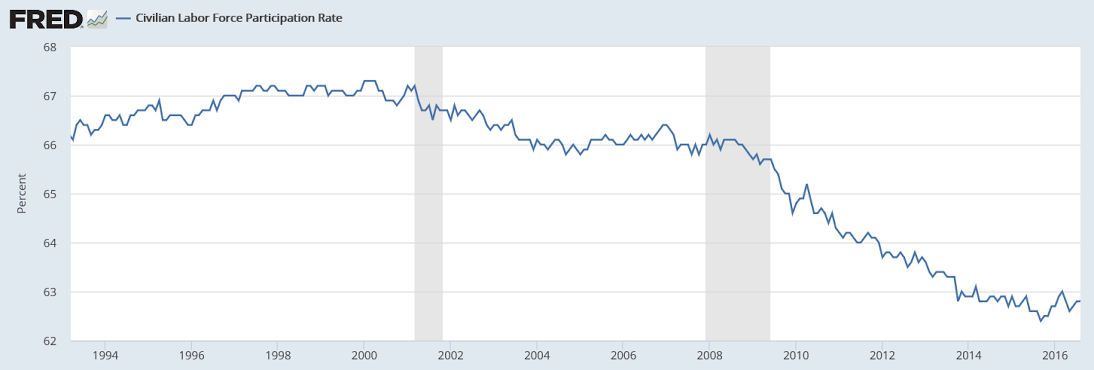
Strength in the labor market continues to pull down the unemployment rate which fell 1 tenth to 4.4 percent for the lowest reading since May 2001. This rate is derived from a separate set of data where the number for unemployed fell by 146,000. There were very few new entrants into the labor market during the month, squeezing what are already tight conditions and pulling down the pool of available workers to 12.8 million from 13.0 million. And the labor participation rate, despite gains in employment, is down 1 tenth to 62.9 percent.
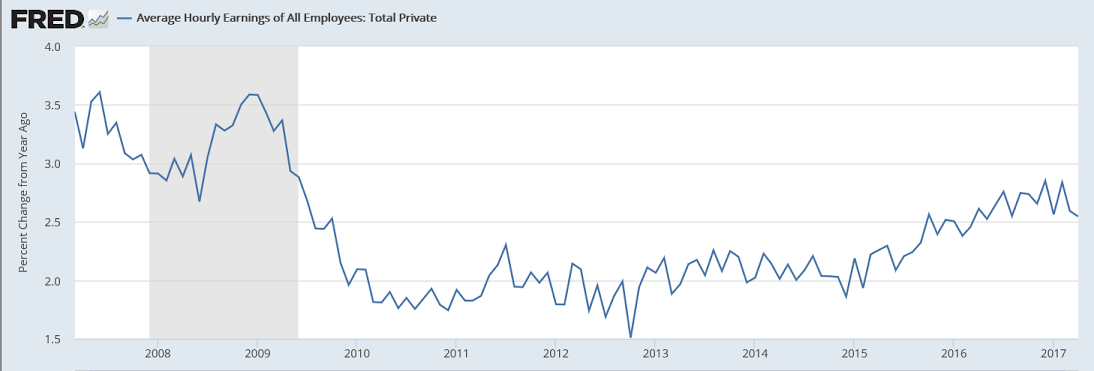
Tight conditions haven’t yet sparked much pressure in average hourly earnings which did rise a respectable 0.3 percent in the month though the year-on-year rate fell 1 tenth to a very soft 2.5 percent. How long wages can stay quiet given the lack of available labor is an open question.
The first quarter was unusually weak for the economy and today’s report marks an important start for what will hopefully be a much stronger second quarter. But very sizable payroll growth in January and February (at 216,000 and 232,000) failed to give any lift to the consumer who, when it came to spending, retrenched in the first quarter. Still, this report is an unquestionable plus that suggests prior weakness may very well have been, as the FOMC argued in Wednesday’s statement, no more than “transitory”.
There has been a continuous deceleration since late 2014 when oil capex collapsed, and they take that last zig up from last month’s report, which could well be revised lower as was last month’s report, and proclaim things are moving back up!
No sign of ‘tightness in the labor markets’ here:
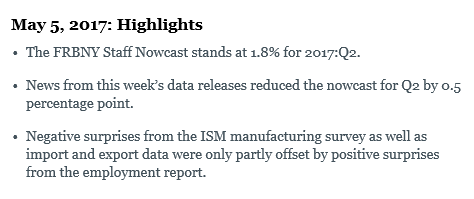
May 5, 2017: Highlights
The FRBNY Staff Nowcast stands at 1.8% for 2017:Q2. News from this week’s data releases reduced the nowcast for Q2 by 0.5 percentage point. Negative surprises from the ISM manufacturing survey as well as import and export data were only partly offset by positive surprises from the employment report.
No burst of activity here:


Highlights
Factory orders, like much of the economy, fizzled in March, up only 0.2 percent and skewed higher for a third month in a row by aircraft. The split between the report’s two main components shows a 0.5 percent dip for nondurable goods — the new data in today’s report where weakness is tied to petroleum and coal — and a 0.9 percent rise for durable orders which is 2 tenths higher than last week’s advance report for this component.
The gain for durables looks impressive but when excluding transportation equipment (which is where aircraft is tracked) orders fell 0.3 percent. But core capital goods orders are a plus in the report, rising 0.5 percent (nondefense ex-aircraft) though the gain follows marginal increases of 0.1 and 0.2 percent in the prior two months.
Unfilled factory orders, which had been in long contraction, are a clear plus, up 0.3 percent following February’s 0.1 percent gain for the best back-to-back showing in 2-1/2 years. A negative however is a 0.1 percent decline in total shipments that came despite a constructive 0.5 percent rise in shipments of core capital goods. Inventories were unchanged in the month though the dip in shipments drove the inventory-to-shipments ratio 1 tenth higher to a less lean 1.32.
Aircraft had a weak year last year and have been making up lost ground so far this year. But how long Boeing can give total orders a lift is uncertain, and the performance of the wider factory sector, despite sky high strength in many anecdotal reports, has been no better than mixed.
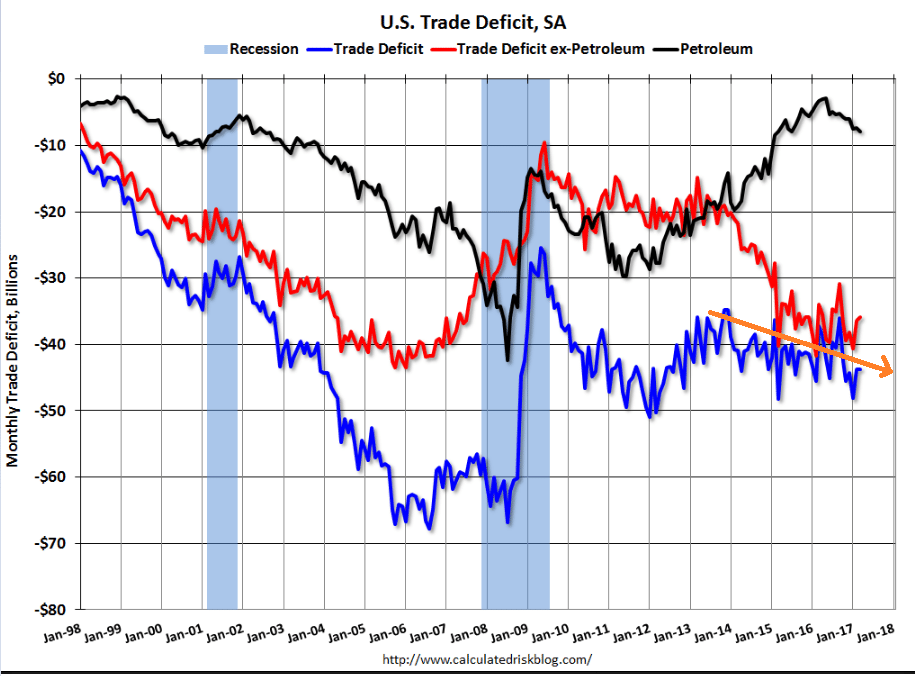
Both imports and exports down which isn’t a good sign for GDP, as the trade deficit seems to be slowly working its way higher. Also, there was more evidence that the reported positive spike in nonresidential investment for Q1 is suspect:

Highlights
A decline in imports held down March’s international trade gap to $43.7 billion which is moderately under Econoday’s consensus for $44.5 billion. But the breakdown doesn’t point to cross-border strength as exports fell 0.9 percent to $191.0 billion in the month against a 0.7 percent decline for imports at $234.7 billion.
The petroleum gap widened sharply in the month to a nearly 2-year high of $7.9 billion and reflects higher prices for imports and a decline in exports. Exports showing the most weakness are industrial supplies, autos, and consumer goods. Foods rose slightly in March as did the key category of capital goods which otherwise has been flat.
On the import side most components are lower especially capital goods in what, along with capital goods shipments and nonresidential construction spending, is another contrast with the first-quarter GDP surge in nonresidential investment. Contrasting with the weakness in imports is a rise in imports of autos, up a sharp $1.2 billion in the month to $30.3 billion.
Country data are in line with trend: the nation’s trade gap with China totaled $24.6 billion in the month followed by the EU at $11.2 billion with Japan at $7.2 billion and Mexico at $7.0 billion. Canada is next at a distant gap of $1.4 billion.
Breaking down the data between goods and services shows a small widening in the goods deficit to $65.5 billion offset in part by a modest looking but still constructive $0.4 billion dollar rise in the surplus on services. The overall decline in exports and imports is a concern, but today’s report has several positives, not only the surplus on services but also the rise in capital goods exports. Today’s report should give a modest and badly needed lift to revision estimates for first-quarter GDP.

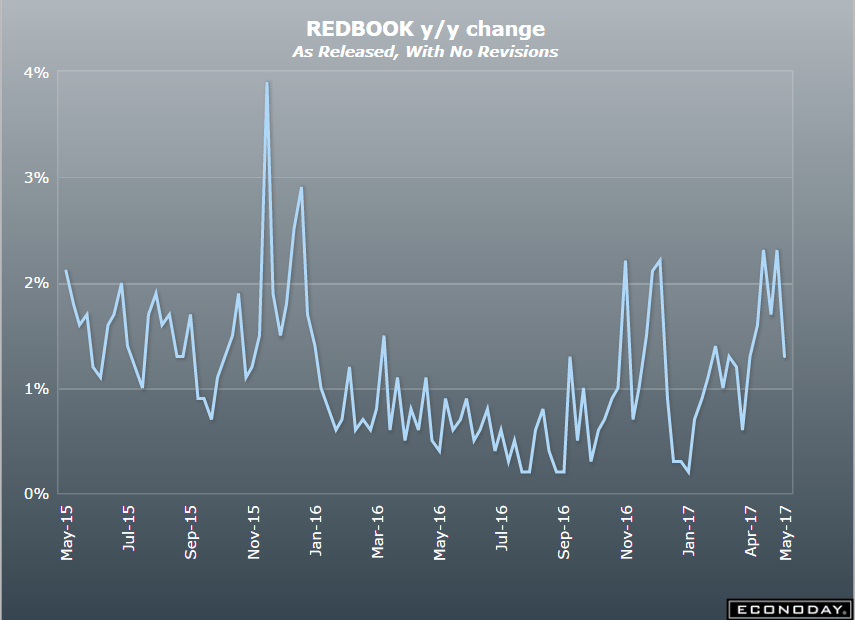
Highlights
Chain stores are reporting mostly stronger rates of year-on-year sales growth for April, a month however that got a big boost from this year’s Easter shift out of March. Sales reports from chains are in year-on-year terms only and are not adjusted for calendar effects such as the shift in Easter which is a major holiday for the retail sector. The best way to look at chain-store sales during Easter shifts is to take both March and April together and with this comparison, stores are mostly downbeat. Weakness in consumer spending has been the dominant feature so far of the 2017 economy.
U.S. small business borrowing stalls in March
By Ann Saphir
May 1 (Reuters) — Borrowing by small U.S. firms stalled in March, as business owners remained cautious about investing amid policy uncertainty, data released on Monday showed.
The Thomson Reuters/PayNet Small Business Lending Index for March registered 134, down 1 percent from last March. The index was up 4 percent from February, which had four fewer working days.

Doesn’t seem to scale very well…
;)
Tesla said net loss attributable to common shareholders widened to $330.3 million in the first quarter ended March 31, from $282.3 million a year earlier. On a per-share basis, net loss narrowed to $2.04 per share from $2.13 per share.
Excluding items, the company lost $1.33 per share. Analysts on average had expected a loss of 81 cents per share, according to Thomson Reuters I/B/E/S.
Revenue more than doubled to $2.70 billion from $1.15 billion, and edged past analysts’ average expectation of $2.62 billion.