Motor vehicle sales, Holiday spending

Also decelerating in line with deceleration of bank auto lending. One by one the data releases seem to be confirming the last 6 month’s rapid deceleration of bank lending:

Highlights

The consumer remains disengaged based on vehicle sales where weakness extended into June, at a 16.5 million annualized rate vs what were modest expectations for 16.6 million and against 16.7 million in May. North American-made sales edged up to 13.1 million from 13.0 million though the gain is due more to rounding than improvement, at 13.05 vs 13.03 million out to two decimals. These results do not point to strength for what has been a very weak autos component of the retail sales report.

Good news here! ;)
Happy 4th!

WASHINGTON – Americans are expected to spend $7.1 billion on food for cookouts and picnics as they celebrate the Fourth of July this year, up from $6.8 billion in 2016, according to the annual survey released today by the National Retail Federation and conducted by Prosper Insight & Analytics.

According to the survey, 219 million Americans plan to celebrate the holiday, or 88 percent of those surveyed. A total of 162 million — 66 percent of those surveyed — plan to take part in a cookout or picnic, spending an average $73.42 per person, up from last year’s $71.34. The numbers cover only food items, not other holiday-related spending.

Construction spending, Manufacturing

As per the chart, decelerating in line with the deceleration in real estate related bank lending:

Highlights

Spring 2017 was not the greatest for the nation’s housing sector where data have been mixed at best. Permits have been down and spending data are flat to down with construction spending unchanged in May which hits the very lowest estimate in Econoday’s consensus range.

And the weakness is in residential spending, down 0.6 percent overall and including declines for single-family homes, residential improvements, and especially in May for multi-family units.

Private nonresidential spending fell 0.7 percent, with declines in transportation, manufacturing, and commercial. An offset is public nonresidential, up sharply after 2 prior months of declines with the gain centered in education, up 5.1 percent, as roads fell 0.9 percent for a second straight dip.

Public spending in May aside, the slowing in construction spending is not a positive signal for the housing sector nor for second-quarter GDP. The housing sector moved higher at the beginning of the year but has stumbled since.

Manufacturing surveys showing modest growth, as previously discussed:

If this report tracked better with government data, expectations would be building for a second-half surge in the factory sector. But this report like other private data, with the notable exclusion of the PMI manufacturing report the latest edition of which was released earlier this morning, have been pointing to unusually strong levels of activity all year long, acceleration that has yet to appear in actual data from the government.

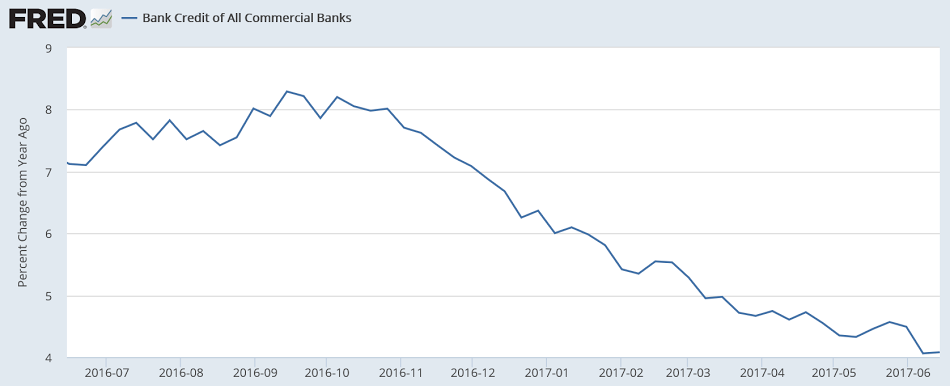
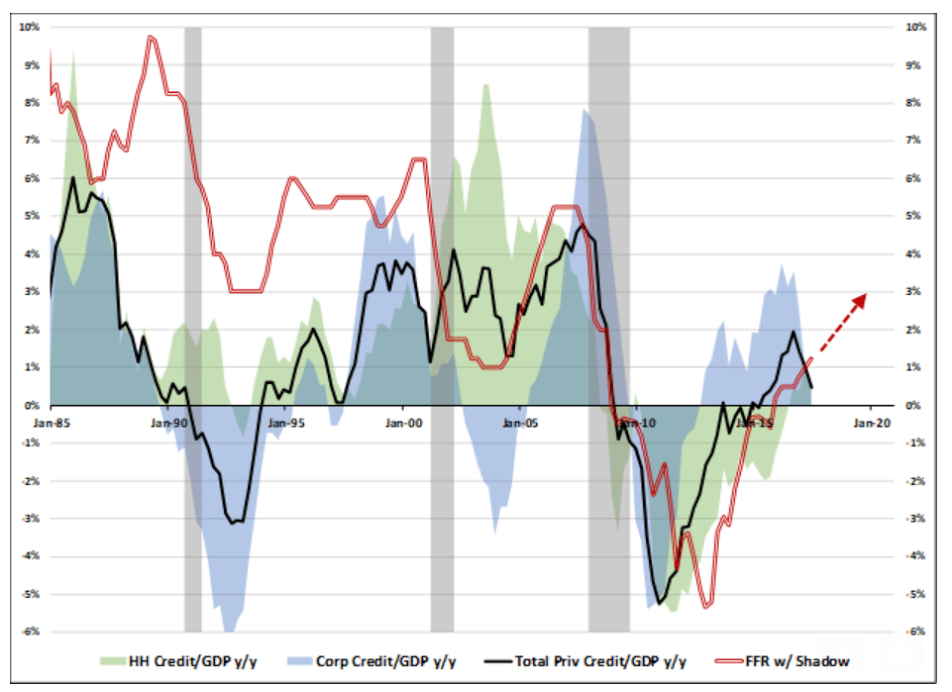
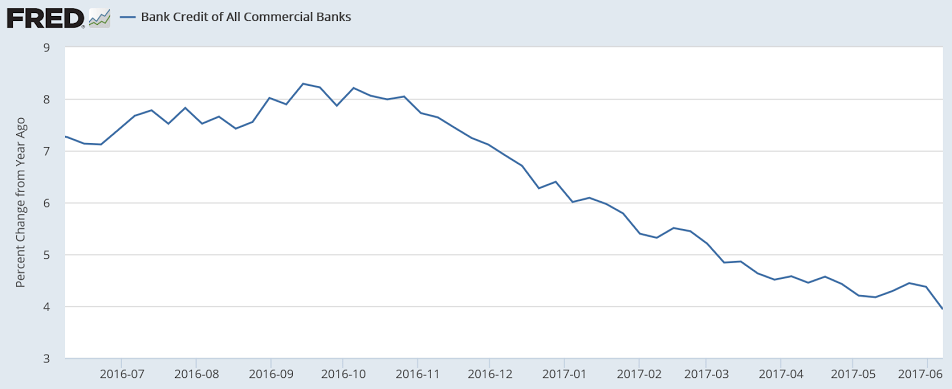
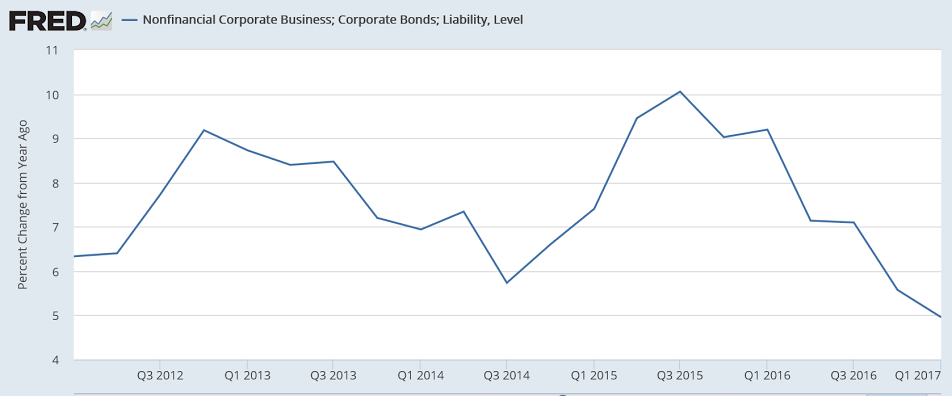
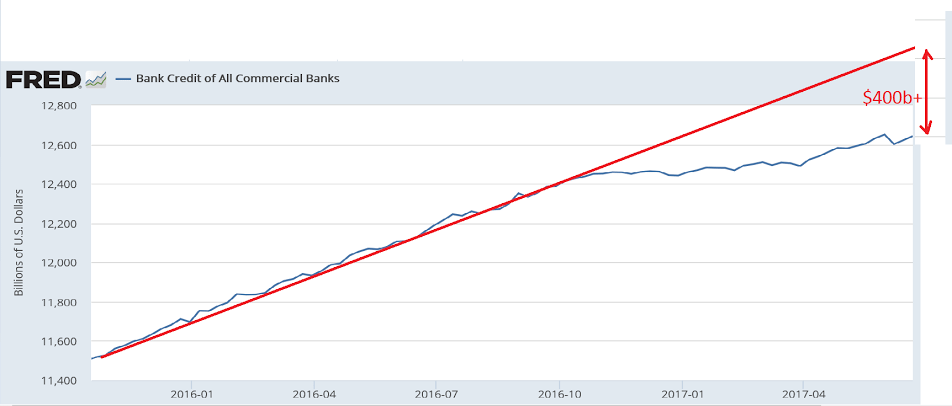
First, let’s look at total bank credit. On this chart you can see that the cumulative growth of bank credit is more than $400 billion less than it would have been if it hadn’t slowed down.

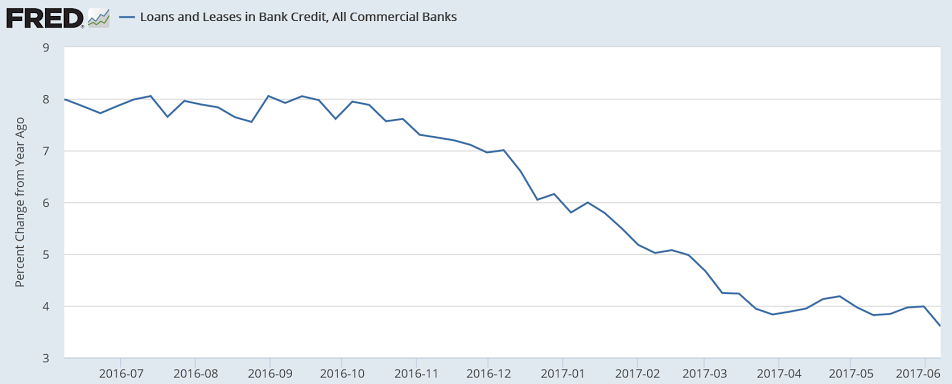
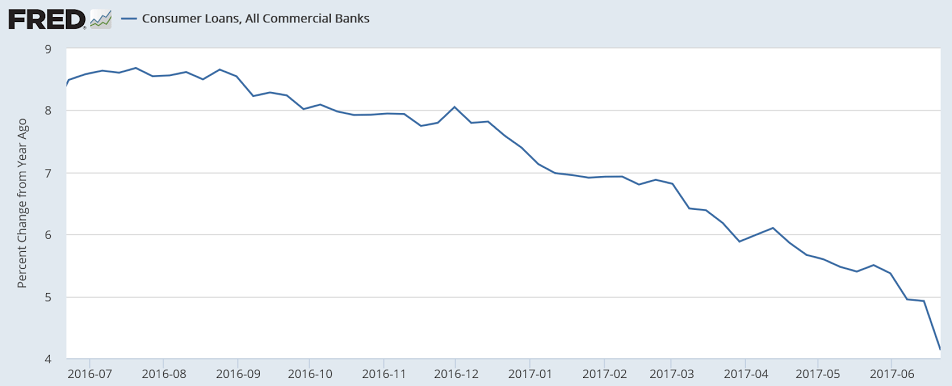
That is, last year’s economy was supported by that much more growth of bank credit than this year’s economy as the annual rate of growth has slowed from over 8% to about 4%:


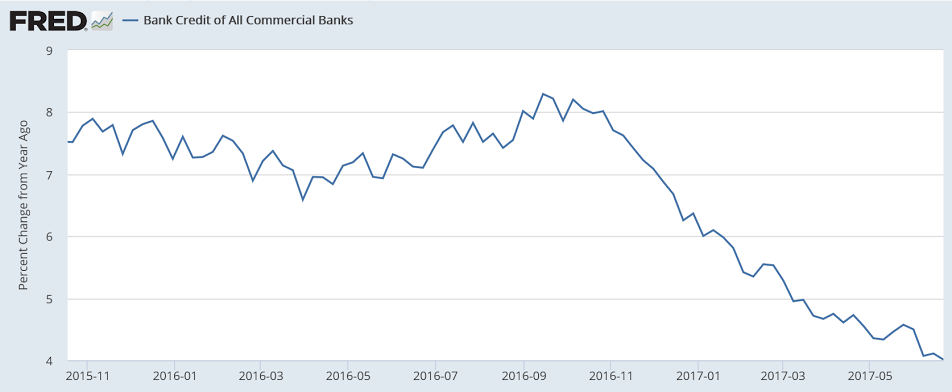
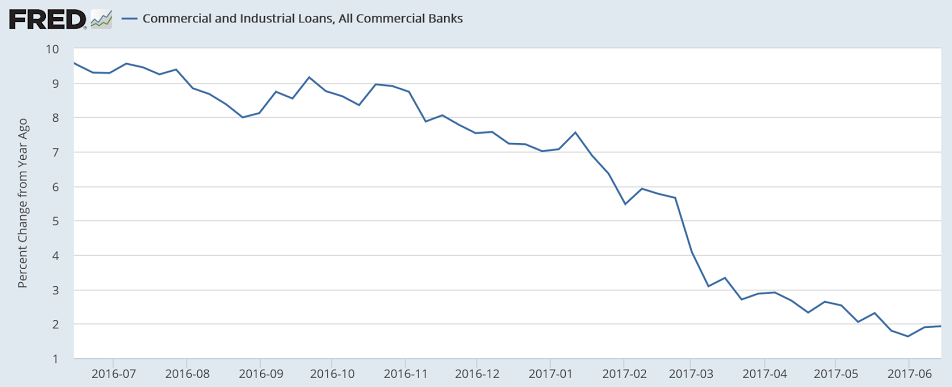
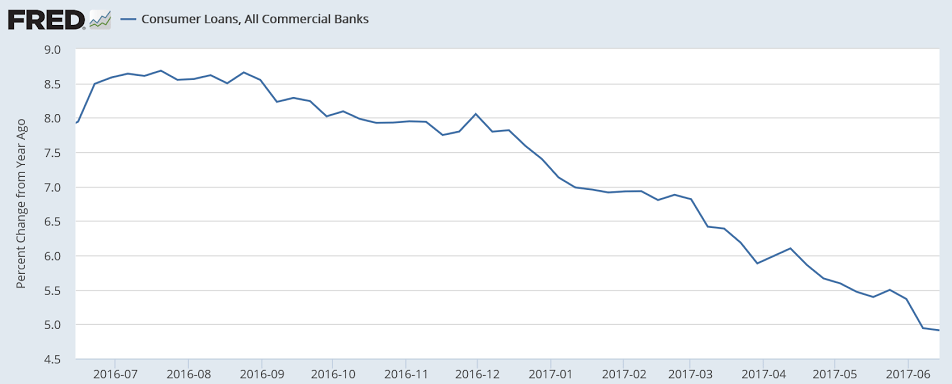
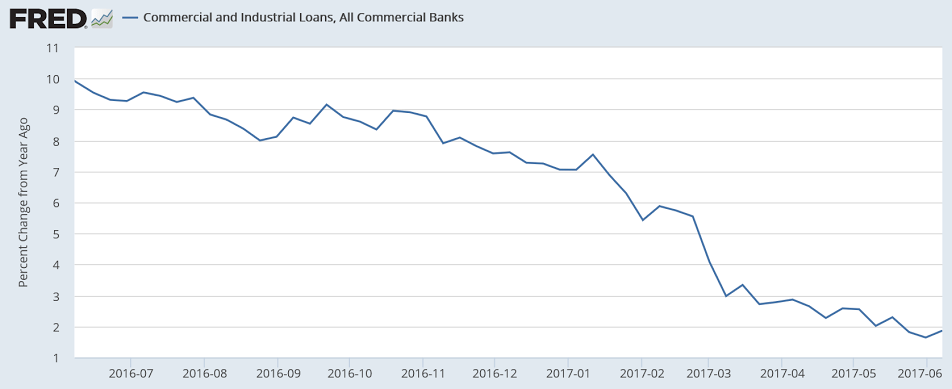
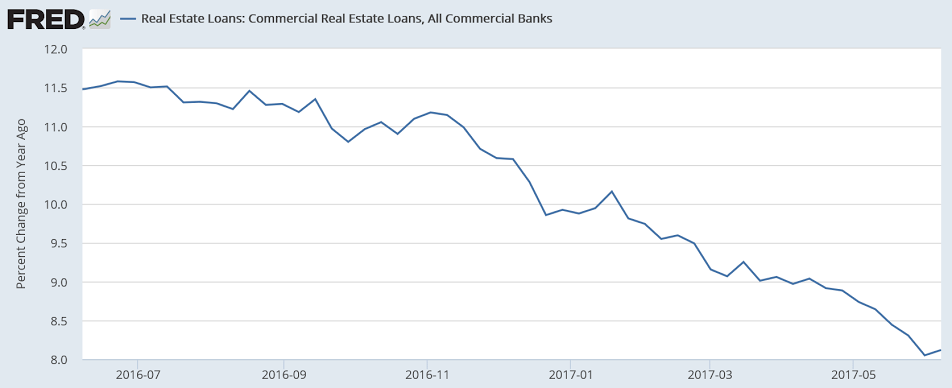
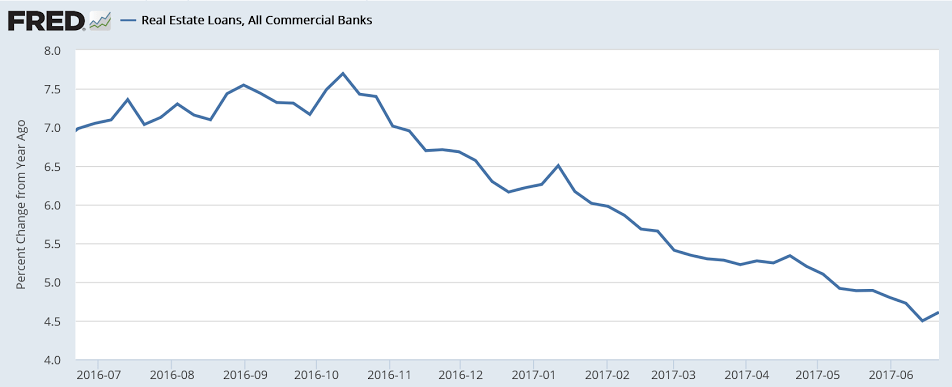
We’ve most recently had a few weeks of increase. A hopeful sign but the annual growth rate is still way down from last year:


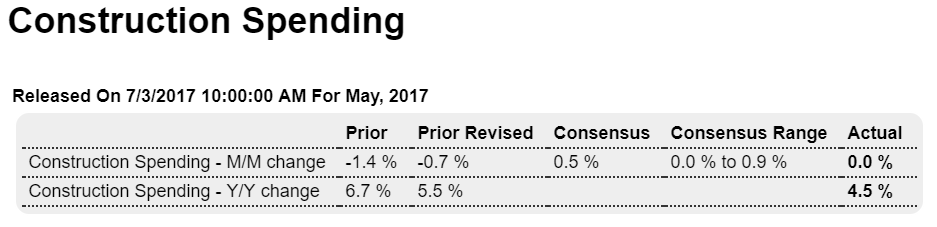
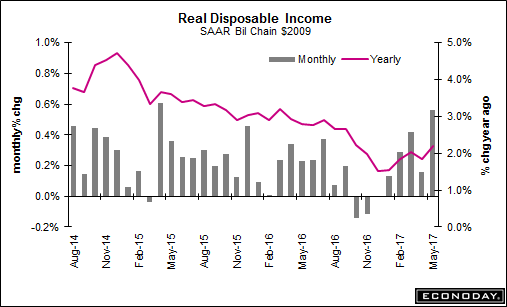
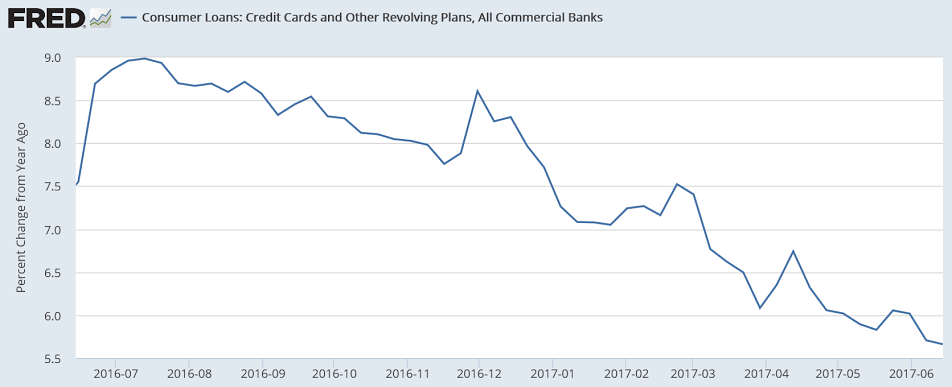
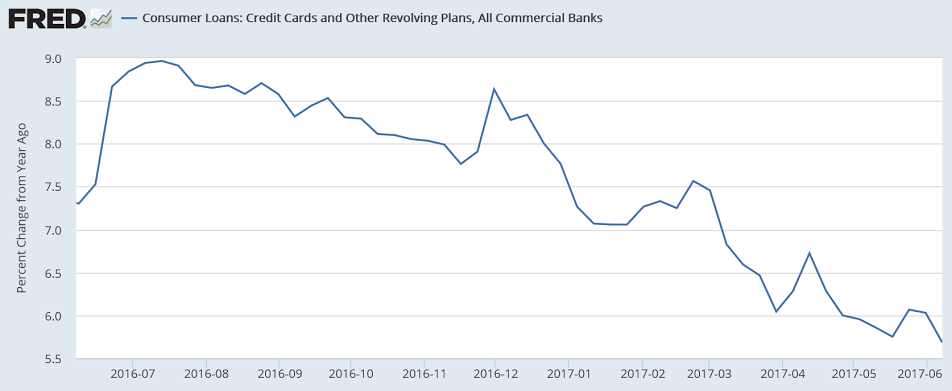
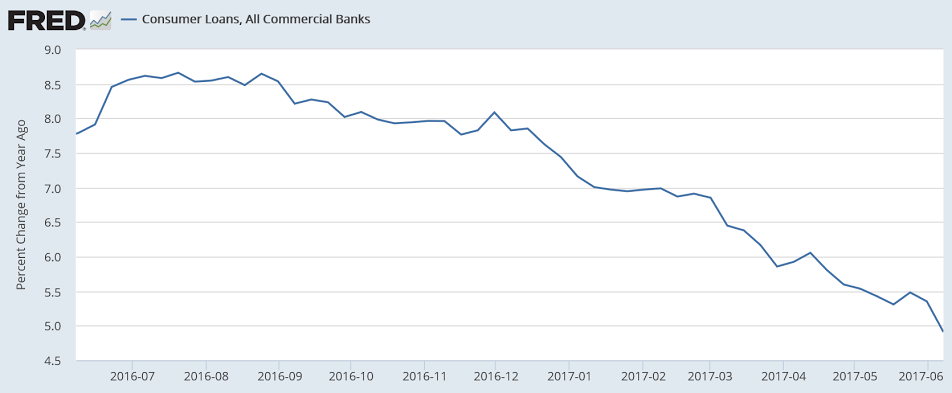
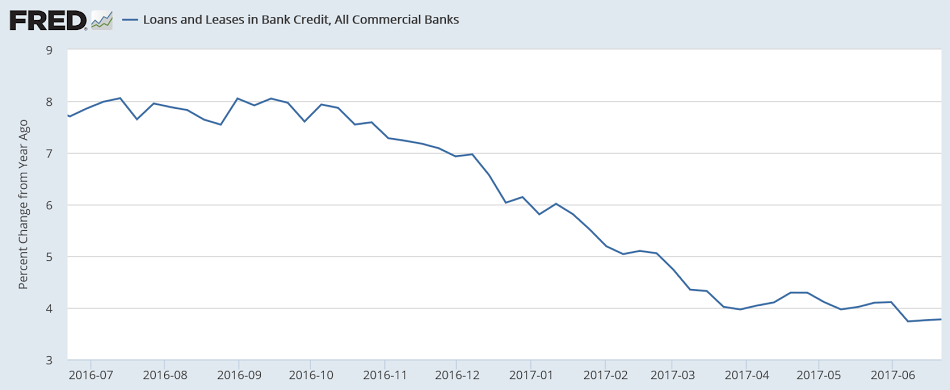
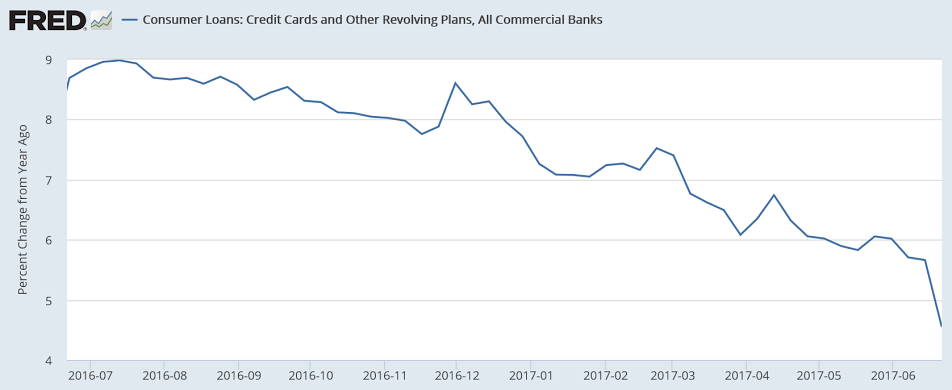
In line with the recent drop in consumer spending:


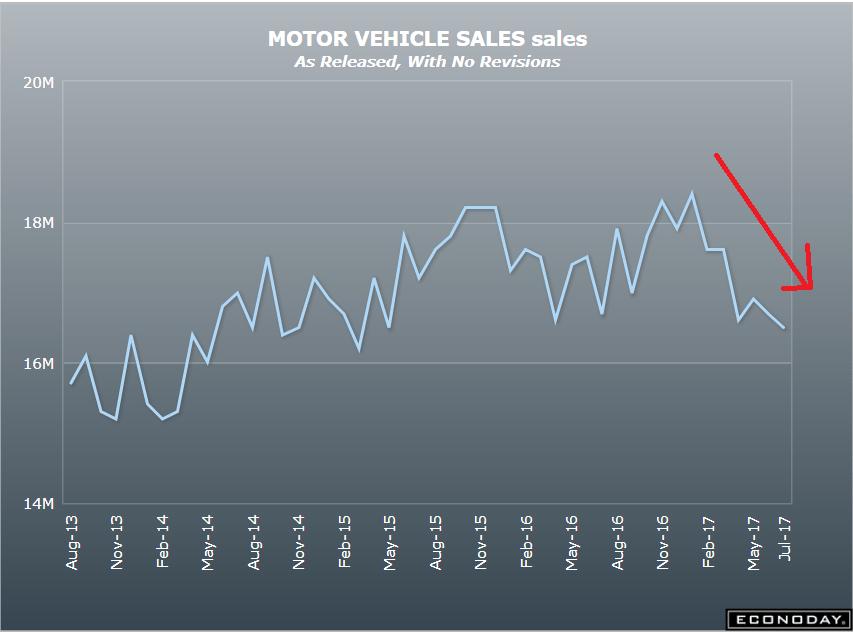
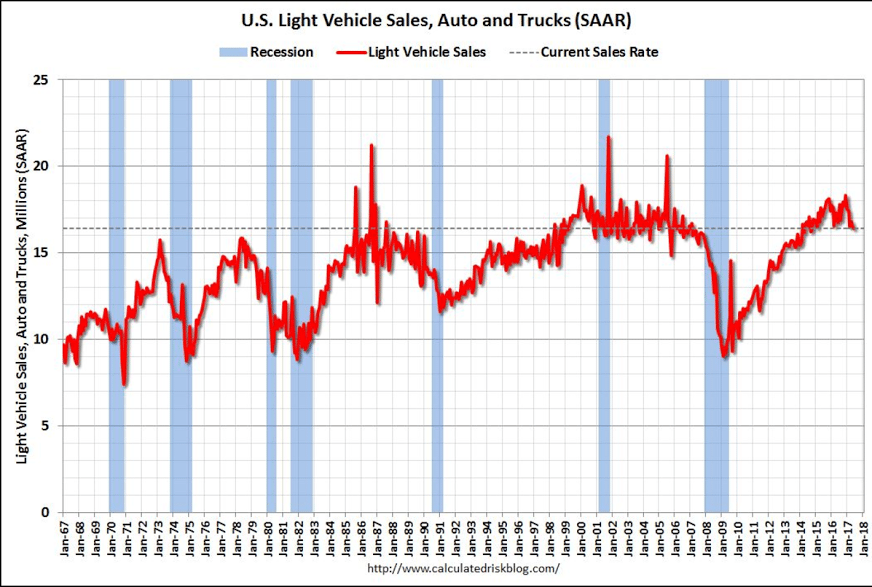
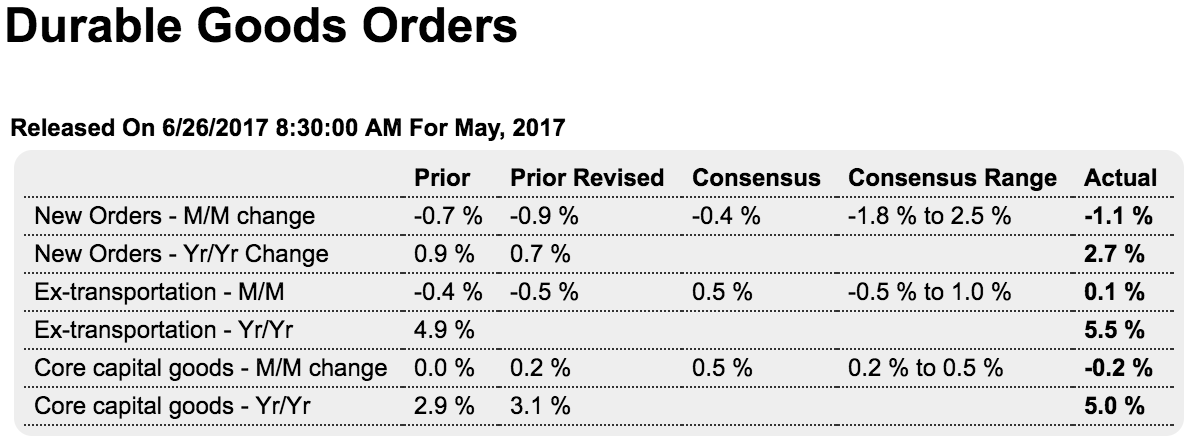
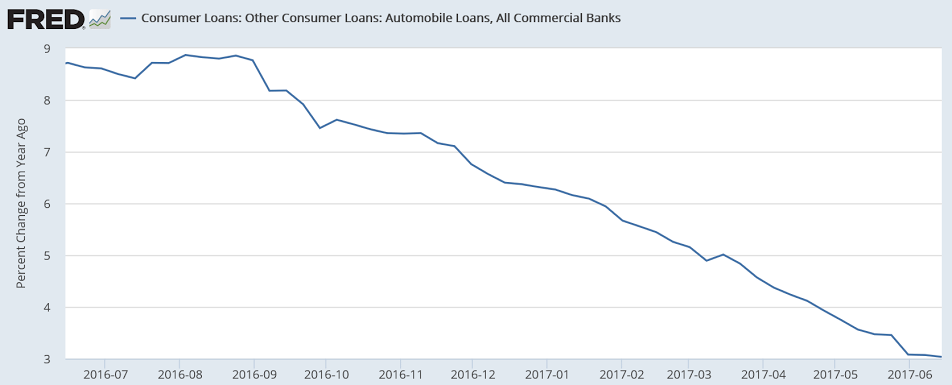
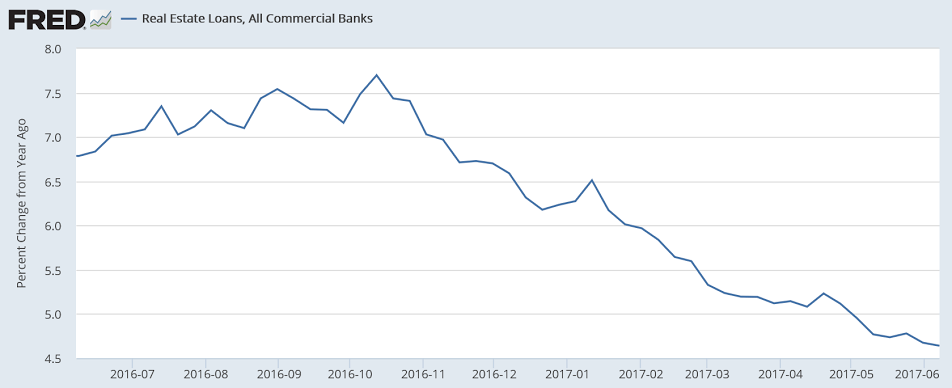
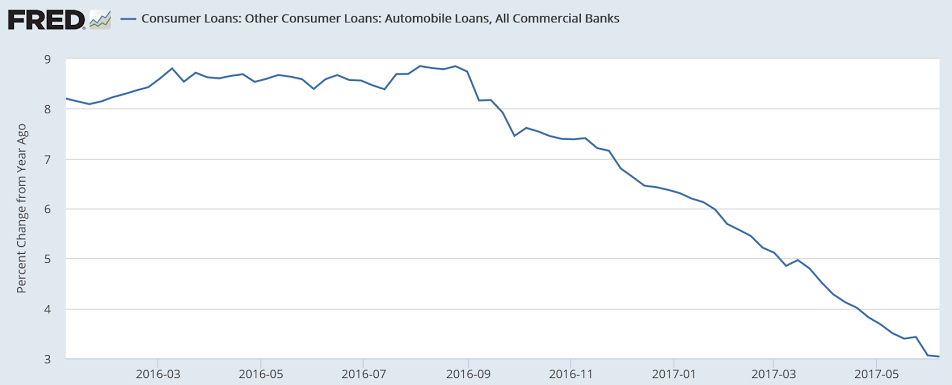
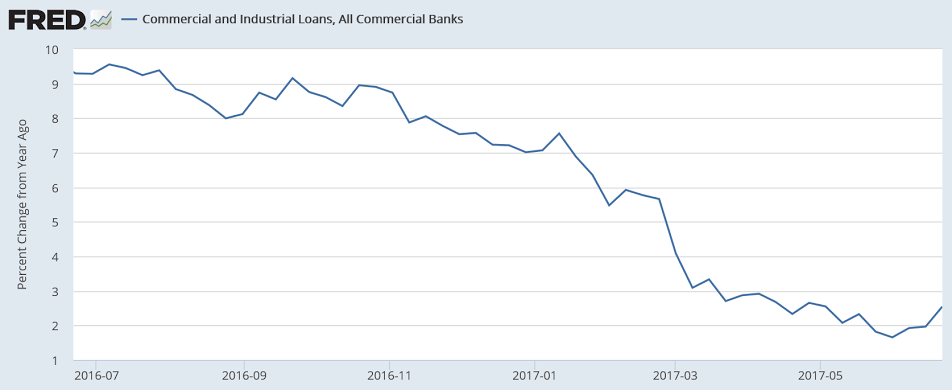
In line with the drop in new automobile sales:

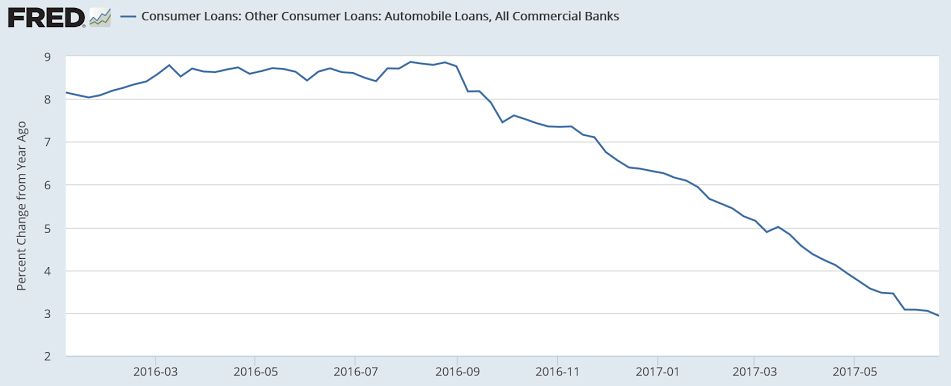
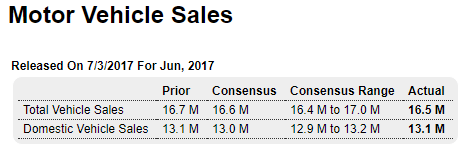
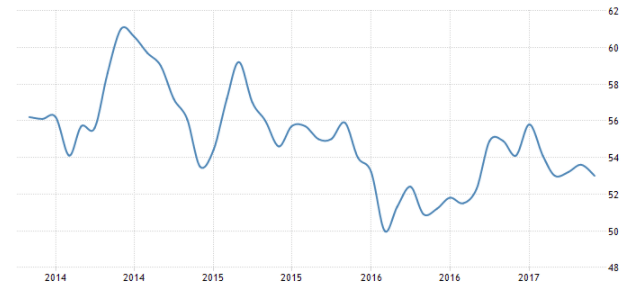
Vehicle Sales Forecast: “Sixth Consecutive Decline in June”

The automakers will report June vehicle sales on Monday, July 3rd.

From Reuters: U.S. auto sales seen down 2 percent in June: JD Power and LMC

The seasonally adjusted annualized rate for the month will be 16.5 million vehicles, down nearly 2 percent from 16.8 million units in the same month in 2016.

On q1 GDP revisions:

Healthcare is Boosting GDP Growth

Summary and Commentary

This revision boosts the headline growth about a quarter percent to +1.42% — better but still tepid. The notable takeaways from this report are:
The largest upward revision was in consumer spending for healthcare and insurance.
The growth rate for consumer spending on goods remains anemic.
The inventory contraction worsened, possibly in anticipation of softer future consumer spending.
Foreign trade remained a bright spot and is not a drag on the headline number.
The US consumer may be spending more, but that increased spending is not on discretionary “life-style” goods.

And as per usual, the Fed is once again projecting a return to “normalcy” in the form of 3% growth in future quarters — with consumer spending leading the way. But if this past quarter’s pattern persists those consumers may continue to face a toxic mix of stagnant disposable income, rising insurance costs and shrinking savings — not exactly a formula for happy campers.

Slowing revenues indicates economic weakness:

CBO Update to the Budget and Economic Outlook: 2017 to 2027

“The deficit estimated for 2017 is $693 billion, $134 billion more than CBO projected in January. Surprisingly weak tax collections since then have led the agency to lower its projection of revenues by $89 billion. At the same time, CBO raised its estimate of outlays by $45 billion, mainly because agencies have increased the estimated subsidy costs of past loans and loan guarantees, particularly for education and housing.”

“One reason for the sharp rise in the deficit in 2017 is the slow growth in revenue collections through May and the slow growth expected for the rest of the year: Revenues in 2017 are projected to rise only by about 1 percent as a result. That modest rate is below CBO’s estimate of growth in the economy, and thus revenues are expected to fall relative to GDP, from 17.8 percent in fiscal year 2016 to 17.3 percent this year”

‘It has to be something, but it could be infinity’: Trump ponders space in strange ceremony

“This is going to launch a whole new chapter for our great country,” Trump said near the end of his speech.

Then he sat down at a table and opened the executive order.

“I know what this is,” he said. “Space!”

Beside him, Aldrin chimed in with a quote from the astronaut character Buzz Lightyear from the movie “Toy Story.”

“Infinity and beyond!” Aldrin said.

Everyone laughed.

Then Trump added some lines of his own.

“This is infinity here,” he said. “It could be infinity. We don’t really don’t know. But it could be. It has to be something — but it could be infinity, right?”

Trump then signed the order and revived the National Space Council, leaving his final words on the subject a mystery.

ECB research report, Personal income and outlays, Chicago pmi, Consumer sentiment

Looks to me like this opens the door to fiscal relaxation!!!

“In an economy with its own fiat currency, the monetary authority and the fiscal authority can ensure that public debt denominated in the national fiat currency is non-defaultable, i.e. maturing government bonds are convertible into currency at par. With this arrangement in place, fiscal policy can focus on business cycle stabilisation when monetary policy hits the lower bound constraint. However, the fiscal authorities of the euro area countries have given up the ability to issue non-defaultable debt. As a consequence, effective macroeconomic stabilisation has been difficult to achieve. Coordinating the fiscal policy of the individual countries around a common euro area, non-defaultable debt instrument would improve business cycle outcomes. Corsetti et al. (2016) describe this proposal in greater detail and discuss possible challenges, including the risk of a restructuring of national public debt”.

Source: https://www.ecb.europa.eu/pub/economic-research/resbull/2017/html/ecb.rb170629.en.html

Income a bit better than expected but last month revised down, and the composition of income was not promising. Spending was down as expected, in line with decelerating growth of consumer credit, and price level indicators were very soft as well:

Highlights

May was not a strong month for the consumer. Income did rise 0.4 percent but it wasn’t because of wages & salaries which could manage only a 0.1 percent gain. It was personal income transfers and proprietor income that gave a boost to income which the consumer, however, moved into savings, which rose 4 tenths to a 5.5 percent rate, and not spending which could do no better than expectations, at a 0.1 percent increase.

Spending was weakest in nondurable goods, down 0.5 percent in the month but, in an important note, reflected low energy prices not low demand. But spending on durables was also negative, down 0.3 percent. The positive is a moderate 0.3 percent gain for the biggest category and that’s services.

Price data are very soft, up only 0.1 percent for the core rate (less food & energy) for a year-on-year rate of only 1.4 percent, down 1 tenth in the month. This is the third decline in a row for the yearly rate and the weakest showing in a year-and-a-half. The overall PCE fell 0.1 percent with this year-on-year rate also at 1.4 percent for a 3 tenths decline.

The second leg of the second quarter did not turn out well for the consumer nor for GDP. But the weakness in price data is a more strategic concern for monetary policy makers who may be removing stimulus into inflationary headwinds.

Still on the downtrend line from when oil capex collapsed:


Better than expected survey:

Also a bit better than expected, though expectations continue to revert:

Highlights

The consumer sentiment index regained some momentum in the second half of the month, rising to a final 95.1 that implies a 95.7 or so reading for the second half of June based on the mid-month flash of 94.5. Yet even so, June shows tangibly less strength than the 97.1 in May.

Durable goods orders, Chicago Fed, Dallas Fed, commercial real estate

Worse than expected and prior month revised lower, but otherwise muddling through at modest rates of annual growth:

Highlights

Aircraft had been the strength but is now the weakness for durable goods which, pulled down by a second straight downswing for commercial aircraft, fell 1.1 percent in May. When excluding transportation, a reading that excludes aircraft, orders actually rose, but not very much at only 0.1 percent which falls 4 tenths shy of Econoday’s consensus. An unquestionable negative in the report is an unexpected 0.2 percent decline for core capital goods orders (nondefense excluding aircraft).

Orders for commercial aircraft fell a rounded 12 percent for a second straight month with orders for defense aircraft, which are always volatile, also hurting May, down 31 percent. Shipments of core capital goods, like orders for this category, are another weakness in the report, down 0.2 percent and when combined with April’s tiny 0.1 percent gain, don’t point to any punch at all for business investment in second-quarter GDP.

But there are positives in the report including a solid 0.6 percent jump in machinery orders, a category that helped limit the monthly dip in capital goods. Vehicles are also a positive with a strong 1.2 percent gain that follows a 0.5 percent rise in the prior month. Shipments of vehicles are on a similar climb.

Other readings include a 0.8 percent gain in total shipments that follows, however, two prior declines and an unwanted 0.2 percent decline in total unfilled orders which is once again back in the contraction column. Inventories rose 0.2 percent which is about in line with the rate of general activity.

This report isn’t all bad but the capital goods readings are a tangible disappointment for the second-quarter outlook, pointing to lack of confidence in business prospects. The data contrast sharply with the ongoing strength in regional surveys. But in actual government data, the factory sector isn’t having a breakout year as some had hoped.

Also worse than expected:

Highlights

A decline in manufacturing production and weakness in employment combined to pull down the national activity index to minus 0.26 in May from a revised plus 0.57 in April. The production component fell to minus 0.16 from April’s 0.53 reflecting May’s 0.4 percent decline in manufacturing production. The employment component fell to minus 0.02 from 0.12 on a sharp drop in civilian employment in the household sample of the employment report and a modest slowing in payroll growth. The consumer & housing component is also a negative, at minus 0.09 from minus 0.07 and once again the result of weakness in housing permits. This report underscores how soft May really was for a second-quarter that looks increasingly at risk.

Also down a bit:

Highlights

In an understandable slowing from unusual acceleration, the Dallas Fed’s general activity index slipped to 15.0 in June vs 17.2 in May. New orders have slowed to 9.6 from May’s 18.1 with unfilled orders moving to 1.3 from 8.1. The report underscores production as an important reading and here the story is the same, slowing to 12.3 from 23.3 in May.

Price data are steady with inputs continuing to show pressure, at 15.6, but selling prices lagging significantly, at 3.6. Employment data show continued pressure for wages & benefits, at 21.1 vs 24.3, with hiring positive at a 1.3 point gain to 9.6.

Though the general activity index is at its lowest level since November last year, cooling in this report is welcome given the unsustainable rates of growth in prior months. But with the price of oil on a severe downswing right now and testing the $40 area, future acceleration for this report may be limited.

PMI’s, New Home Sales, State Coincident Index, Corporate Profits

Trumped up expectations continue to revert:

Highlights

The economy is solid, at least the service sector, but on the whole is losing momentum, based on Markit’s flash data for June. The composite PMI slowed to 53.0 vs Econoday’s consensus for 53.8 with services also at 53.0 and manufacturing at 52.1, both short of expectations.

Services offer the best news with new orders and employment solid and optimism on the outlook particularly positive. In a special sign of strength, service companies in the sample are reporting the best gains in selling prices so far this year.

Manufacturing, however, moved to its slowest rate since September last year with both new orders and output down, offsetting gains in hiring and also inventories. Input costs slowed with selling prices here still weak.

The service strength in this report keeps it from being downbeat, though the weakness in manufacturing, which has been struggling this quarter, is not welcome.

Composite of manufacturing and services:

A bit better than expected, but no homes are built without permits, and permits are down.

Also, as per the charts, which are not population adjusted, sales have flattened recently and remain historically depressed:

Existing home sales, oil, credit

Going nowhere, and with mortgage lending decelerating not much hope this will add to growth vs last year:

Highlights

Housing has been sliding which adds importance to May’s very solid 1.1 percent rebound in existing home sales to a higher-than-expected 5.620 million annualized rate. Today’s report is mostly solid throughout and includes gains for single-family homes, up 1.0 percent to a 4.980 million rate, and also condos, up 1.6 percent to a 640,000 rate.

The sales gains did not come at the expense of price concessions as the median price rose 3.2 percent to $252,800. Year-on-year, the median is up 5.8 percent and shows seller strength relative to a 2.7 percent gain for on-year sales.

Another positive is supply which, aided by strength in prices, is moving into the market, to 1.960 million vs 1.920 million in April and 1.800 million in March. Relative to sales, supply is at 4.2 months vs 4.1 and 3.8 in the prior two months.

The South is the leading and by far the largest region for sales, up 2.2 percent on the month for a 4.5 percent on-year gain to a 2.340 million rate. The West is next, up a monthly 3.4 percent to 1.220 million and a 3.4 percent gain from last year. The Northeast, which had been lagging, is showing life, up 6.8 percent on the month with the year-on-year rate up 2.6 percent at 780,000. Sales in the Midwest are May’s only negative, down 5.9 percent and down 0.8 percent on the year at 1.280 million.

The housing sector opened the year strongly but mostly fizzled during the Spring selling season. Yet this report limits that weakness and should confirm expectations for a bounce back in Friday’s new home sales report. Watch next week for pending home sales which will offer an advance indication on existing home sales in June.

This is not population adjusted. Sales remain seriously depressed:

Saudi output holding steady at reasonable levels. The set price and let quantity adjust:

Seems they’ve been reducing discounts more than increasing them lately?

Word getting around about the lending slowdown as per this chart I recently saw:

Credit check

More problematic by the week. Note the absolute level of c and I loans has been flat to negative since October:


Annual rate of growth remains sub 2%:


This is consistent with the weakening housing releases:


This is consistent with weakening consumer spending:


This is consistent with weakening vehicle sales:


Corporate bonds are not picking up the slack- quite the opposite:

Housing starts, consumer sentiment, credit growth article

Down and prior month revised down and permits way down as well. All in line with the previously discussed deceleration in bank real estate lending that began just after the elections in November:

Highlights

The bad economic news keeps building, this time in the housing sector. Housing starts fell an unexpected 5.5 percent in May to a far lower-than-expected annualized rate of 1.092 million with permits likewise very weak, down 4.9 percent to a 1.168 million rate.

All components show declines with single-family starts down 3.9 percent to a 794,000 rate and permits down 1.9 percent to 779,000. Multi-family starts fell 9.7 percent to 298,000 with permits down 10.4 percent to 389,000. Total completions did rise 5.6 percent to a 1.164 million rate, which adds supply to a thin market, but homes under construction slipped 0.7 percent to 1.067 million.

Adding to the bad news are downward revisions to starts including April which is now at 1.156 vs an initial 1.172 million. Looking at the quarter-to-quarter comparison, starts have averaged 1.124 million so far in the second quarter, down a very sizable 9.2 percent from 1.238 million in the second quarter. Permits, at an average of 1.198 million, are down 4.9 percent.

Residential investment looks to be yet another negative for second-quarter GDP.

Trumped up expectations continue to unwind:

Highlights

In the least optimistic reading since the November election, the preliminary June consumer sentiment index fell to a much lower-than-expected 94.5. This compares with 97.1 for May and 97.7 for preliminary May.

Both components are down with expectations at 84.7 for a 3 point decline from May which points to less confidence in the jobs outlook. The current conditions index is at 109.6 for a 2.1 point decline which is a negative indication for consumer spending in June.

The report notes that this month’s decline reflects easing confidence among both Republicans and Democrats. Inflation expectations are mixed with the 1-year outlook unchanged at 2.6 percent but with the 5-year up 2 tenths and also at 2.6 percent.

Life in the Slow Lane: U.S. Bank Lending Falls Behind a Laggard

By Mike Bird

June 15 (WSJ) — After six years of meager growth, eurozone bank lending to nonfinancial corporations increased by an annual 2.4% in May, its fastest pace since mid-2009. The deceleration in U.S. commercial and industrial loan growth has been steep. Annual growth has fallen from over 10% a year ago to just 2% in June, according to the latest figures published by the Federal Reserve. Europe’s has accelerated from 1.8% in the same period. The last time corporate credit growth was faster in the eurozone than the U.S. was in early 2011, when the full debilitating effect of the sovereign-debt crisis was yet to feed through to local data.