China’s domestic demand firming?


[Skip to the end]

As I’ve said for a very long time, the last thing we need is a billion new consumers in the world competing for resources.

But by failing to unilaterally sustain domestic demand at a time when the rest of the world wants to export to us, we are causing exactly that to happen.

It’s still not too late as China remains leveraged to exports, but that will change if that channel remains closed.

China Manufacturing Index Rises on Stimulus Spending

by Li Yanping and Nipa Piboontanasawat

Mar 4 (Bloomberg) — A Chinese manufacturing index climbed for a third month, adding to evidence that a 4 trillion yuan ($585 billion) stimulus package is pushing the world’s third-biggest economy closer to a recovery.

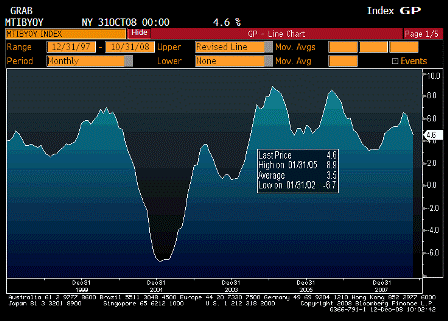
The Purchasing Manager’s Index rose to a seasonally adjusted 49 in February from 45.3 in January, the China Federation of Logistics and Purchasing said today in an e-mailed statement. A reading below 50 indicates a contraction.

Stocks rose after output and new orders expanded for the first time in five months. Chinese Premier Wen Jiabao may announce extra measures to reverse the nation’s economic slide at the annual meeting of the National People’s Congress starting in Beijing tomorrow.

“There are more noticeable signs that China’s economy is bottoming out,” said Zhang Liqun, an economist at the State Council Development and Research Center.

The Shanghai Composite Index rose 2.4 percent as of 10:47 a.m. local time.

While manufacturing contracted for a fifth straight month as the worst financial crisis since the Great Depression cut exports, the PMI is up from a record low of 38.8 in November.

Surging loans, growth in retail sales in January, and an increase in electricity output and consumption from the middle of last month are signs that government measures have shown “preliminary results,” according to Premier Wen.

Recovery ‘Very Likely’

A recovery in the first half is “very likely,” central bank Vice Governor Su Ning said yesterday.

Industrial-output growth in January and February may be higher than in November and December, Zhang forecast. Still, he cautioned that “seasonal factors” may have boosted the output and new-order indexes, which could fall again.

“The government’s stimulus investment has finally started to take effect,” said Xing Ziqiang, an economist at China International Capital Corp. in Beijing. “However, a recovery may be short-lived as export demand may get worse in the second half and the outlook for consumption is uncertain.”

The manufacturing index likely got a boost from factories resuming production after a Chinese Lunar New Year holiday in January, Xing said.

The output index jumped to 51.2 from 45.5 in January and the new-order index climbed to 50.4 from 45.

Export Orders

A measure of export orders rose to 43.4 from 33.7. The employment index rose to 46.1 from 43, the first increase in six months.

The premier may unveil a record 950 billion yuan budget deficit for this year to cover government spending on the economy and welfare, according to the China Business Journal and Wen Wei Po newspapers.

The slowdown has triggered speculation that the government will increase the stimulus package announced in November. An unidentified planning-agency official said today that more will be spent, Reuters reported.

Officials have indicated 8-10 trillion yuan of “government-sponsored investment” is possible, Stephen Green, Shanghai-based head of China research at Standard Chartered Bank Plc said yesterday.

A separate purchasing managers’ index, released on March 2 by CLSA Asia-Pacific Markets, showed manufacturing contracted for a seventh month in February.

“Manufacturing activities may only start to recover from March after more projects break ground in spring,” said Sun Mingchun, an economist at Nomura Holdings Ltd. in Hong Kong. “Economic growth may start to pick up from the second quarter onwards.”

Steel Glut

A glut of steel at ports in China, the world’s biggest maker of the alloy, shows mills were too quick to boost output on expectations the stimulus package unveiled in November would spur demand, according to Bank of Nova Scotia.

Steel stockpiles at Shanghai’s main port have jumped 44 percent this year to 2.1 million metric tons on Feb. 27, the highest since Bloomberg began compiling the data in June 2006.

While China’s economy is the only one of the world’s five biggest still expanding, the pace has slowed for six straight quarters. Growth in the three months through December was 6.8 percent from a year earlier, the smallest gain in seven years. That compares with a 13 percent expansion for all of 2007.

Tongling Nonferrous Metals Group Co., China’s second- biggest copper smelter by output, said Feb. 27 that profit tumbled last year after prices slumped in the fourth quarter.

Lenovo Group Ltd., the world’s fourth-biggest personal- computer maker, said Feb. 25 that it will cut 450 jobs in China to reduce costs after demand fell in the U.S. and China.

20 Million Jobs

China’s government said last month that 20 million migrant workers had lost their jobs because of the slowdown.

Jia Qinglin, a member of the Communist Party’s Politburo, urged a “vigorous employment policy” in his speech yesterday at the opening meeting of the Chinese People’s Political Consultative Conference.

“China will pick up in the second half of this year as the stimulus package” begins working, Vivek Tulpule, the chief economist at London-based Rio Tinto Group, said yesterday in Canberra, Australia. Rio is the world’s third-biggest mining company.


[top]

Re: February Economic Summary in Graphs


[Skip to the end]

(email exchange)

Excellent summary of current conditions, thanks!

And gasoline consumption and inventories up year over year with a massive general output gap- so much for the presumed ‘demand destruction?’

q1 looking down 10%- and that’s with the government sector flat or maybe up some, so the rest is down that much more.

q3 forecasts now flat to up some as the fiscal adjustments unfold, including the ‘automatic stabilizers’ of falling revenues and rising transfer payments.

% gains from these levels will be dramatic without making all that much of dent in reducing the output gap.

Unless of course the mainstream reduces the output gap by declaring the natural rate of unemployment has gone up.

Like they always have in the past.

It’s all a staggering loss of real output and a larger loss in quality of life, with Congress fully responsible.

The current fiscal adjustment could have come right after it all went bad in July.

Clearly the 170 billion package last year ‘worked’ as q2 came in at over 2% real growth.

All they needed to do was do it each quarter.

That would have added up to about $700 billion per year and would probably have sustained at least modest levels of output and employment.

>   
>   On Sat, Feb 28, 2009 at 7:41 PM, Russell wrote:
>   

February Economic Summary in Graphs

Feb 28 (Calculated Risk) — Here is a collection of 20 real estate and economic graphs from February …


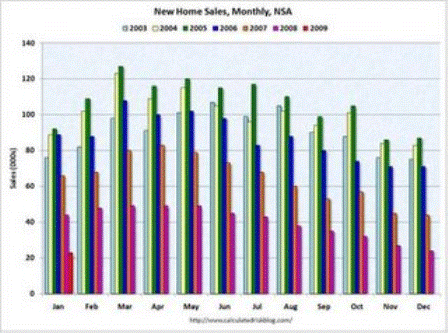
The first graph shows monthly new home sales (NSA – Not Seasonally Adjusted).

Note the Red column for January 2009. This is the lowest sales for January since the Census Bureau started tracking sales in 1963. (NSA, 23 thousand new homes were sold in January 2009).

From: Record Low New Home Sales in January


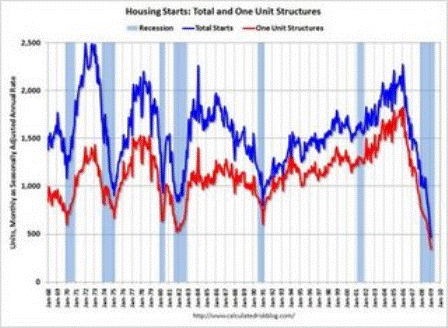
Total housing starts were at 464 thousand (SAAR) in January, by far the lowest level since the Census Bureau began tracking housing starts in 1959.

Single-family starts were at 347 thousand in January; also the lowest level ever recorded (since 1959).

From: Housing Starts at Another Record Low


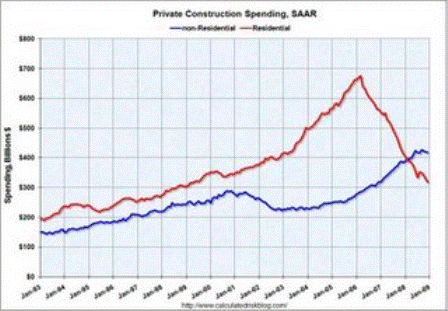
This graph shows private residential and nonresidential construction spending since 1993.

Residential construction spending is still declining, and now nonresidential spending has peaked and will probably decline sharply over the next 18 months.

From: Construction Spending: Private Nonresidential has Peaked


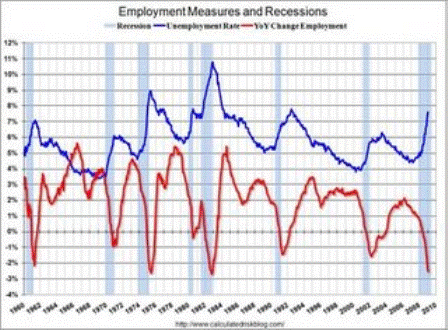
This graph shows the unemployment rate and the year over year change in employment vs. recessions.

Nonfarm payrolls decreased by 598,00 in January, and the annual revision reduced employment by another 311,000 in 2008. The economy has lost almost 2.5 million jobs over the last 5 months!

The unemployment rate rose to 7.6 percent; the highest level since June 1992.

Year over year employment is now strongly negative (there were 3.5 million fewer Americans employed in Jan 2008 than in Jan 2007).

From: January Employment Report: 598,000 Jobs Lost, Unemployment Rate 7.6%


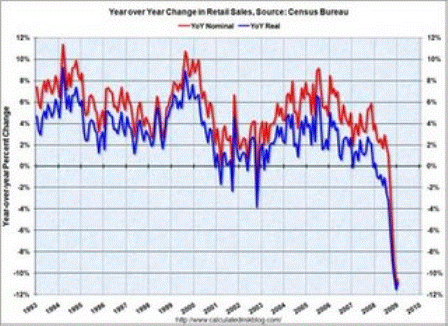
This graph shows the year-over-year change in nominal and real retail sales since 1993.

Although the Census Bureau reported that nominal retail sales decreased 10.6% year-over-year (retail and food services decreased 9.7%), real retail sales declined by 10.9% (on a YoY basis). The YoY change decreased slightly from last month.

From: Retail Sales Increase Slightly in January


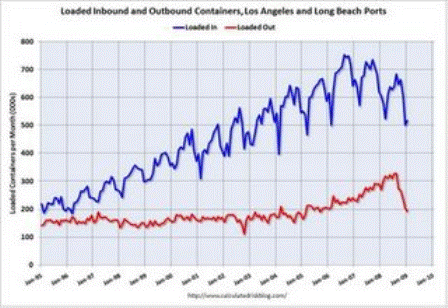
This graph shows the combined loaded inbound and outbound traffic at the ports of Long Beach and Los Angeles in TEUs (TEUs: 20-foot equivalent units or 20-foot-long cargo container).

Inbound traffic was 14% below last January. This slowdown in imports (inbound traffic to the U.S.) is hitting Asian countries hard. There was a slight increase from December to January, but that appears to be mostly seasonal (the data is NSA).

For the LA area ports, outbound traffic continued to decline in January, and was 28% below the level of January 2008. Export traffic is now at about the same level as in 2005.

From: LA Area Ports: Exports Decline in January


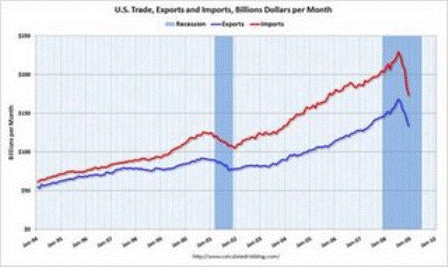
The first graph shows the monthly U.S. exports and imports in dollars through December 2008. The recent rapid decline in foreign trade continued in December. Note that a large portion of the decline in imports is related to the fall in oil prices – but not all.

From: U.S. Trade: Exports and Imports Decline Sharply


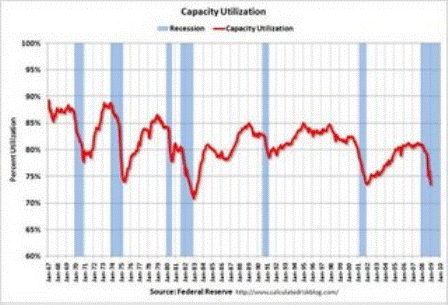
The Federal Reserve reported that industrial production fell 1.8 percent in January, and output in January was 10.0% below January 2008. The capacity utilization rate for total industry fell to 72.0%, the lowest level since 1983.

The significant decline in capacity utilization suggests less investment in non-residential structures for some time.

From: Capacity Utilization and Industrial Production Cliff Diving


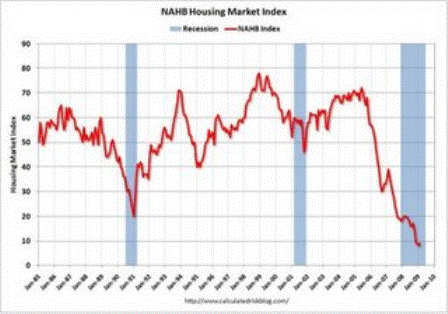
This graph shows the builder confidence index from the National Association of Home Builders (NAHB).

The housing market index (HMI) increased slightly to 9 in February from the record low of 8 set in January.

From: NAHB Housing Market Index Near Record Low


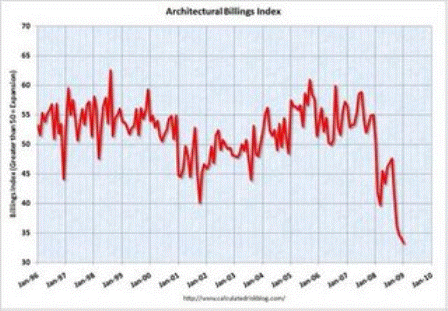
The American Institute of Architects (AIA) reported the January ABI rating was 33.3, down from the 34.1 mark in December (any score above 50 indicates an increase in billings).

From: Architecture Billings Index Hits Another Record Low


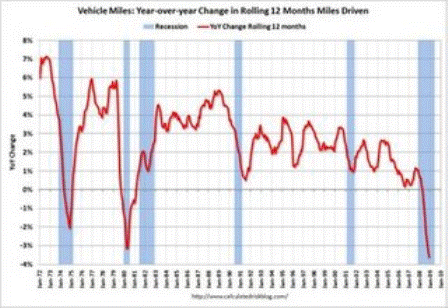
This graph shows the annual change in the rolling 12 month average of U.S. vehicles miles driven. Note: the rolling 12 month average is used to remove noise and seasonality.

By this measure, vehicle miles driven are off 3.6% Year-over-year (YoY); the decline in miles driven is worse than during the early ’70s and 1979-1980 oil crisis. As the DOT noted, miles driven in December 2008 were 1.6% less than December 2007, so the YoY change in the rolling average may start to increase.

From: U.S. Vehicle Miles Driven Off 3.6% in 2008


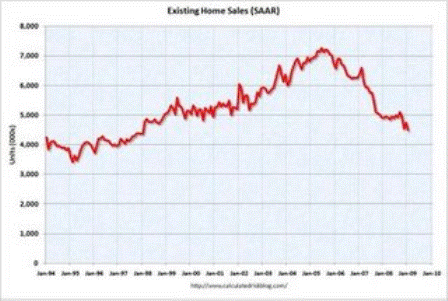
This graph shows existing home sales, on a Seasonally Adjusted Annual Rate (SAAR) basis since 1993.

Sales in January 2009 (4.49 million SAAR) were 5.4% lower than last month, and were 8.6% lower than January 2008 (4.91 million SAAR).

From: More on Existing Home Sales (and Graphs)


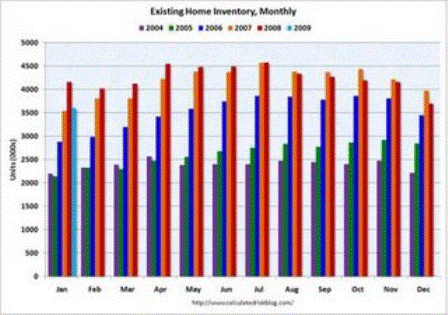
This graph shows inventory by month starting in 2004. Inventory levels were flat for years (during the bubble), but started increasing at the end of 2005.

Inventory levels increased sharply in 2006 and 2007, but have been close to 2007 levels for most of 2008. In fact inventory for the last five months was below the levels of last year. This might indicate that inventory levels are close to the peak for this cycle.

From: More on Existing Home Sales (and Graphs)


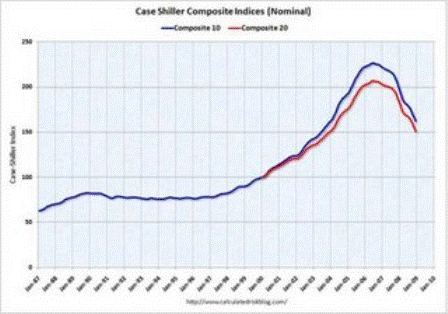
This graph shows the nominal Composite 10 and Composite 20 indices (the Composite 20 was started in January 2000).

The Composite 10 index is off 28.3% from the peak.

The Composite 20 index is off 27.0% from the peak.

From: Case-Shiller: House Prices Decline Sharply in December


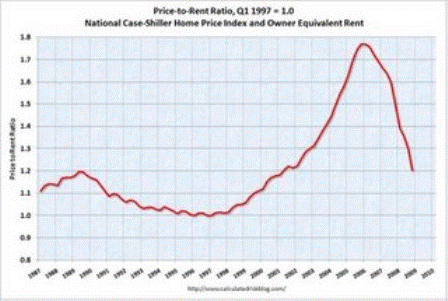
This graph shows the price to rent ratio (Q1 1997 = 1.0) for the Case-Shiller national Home Price Index. For rents, the national Owners’ Equivalent Rent from the BLS is used.

Looking at the price-to-rent ratio based on the Case-Shiller index, the adjustment in the price-to-rent ratio is probably 75% to 85% complete as of Q4 2008 on a national basis. This ratio will probably continue to decline.

However it now appears rents are falling too (although this is not showing up in the OER measure yet) and this will impact the price-to-rent ratio.

From: House Prices: Real Prices, Price-to-Rent, and Price-to-Income


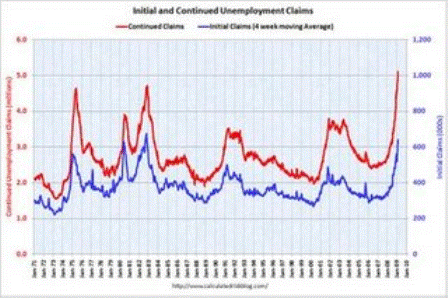
This graph shows weekly claims and continued claims since 1971.

The four week moving average is at 639,000 the highest since 1982.

Continued claims are now at 5.11 million – another new record (not adjusted for population) – above the previous all time peak of 4.71 million in 1982.

From: Weekly Claims: Continued Claims Over 5 Million


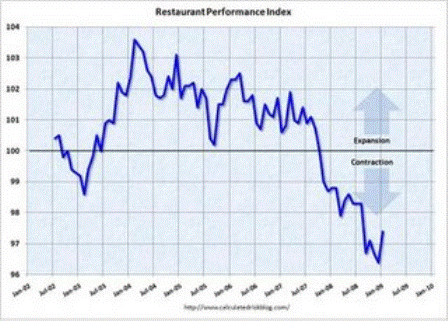
“The Association’s Restaurant Performance Index (RPI) – a monthly composite index that tracks the health of and outlook for the U.S. restaurant industry – stood at 97.4 in January, up 1.0 percent from December’s record low level of 96.4.”

From: Restaurant Performance Index Rebounds Slightly


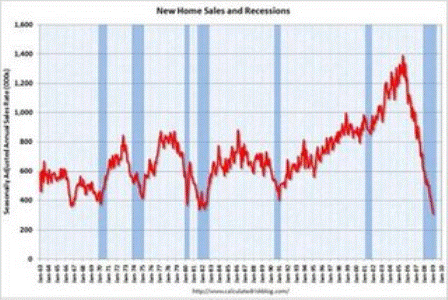
This graph shows New Home Sales vs. recessions for the last 45 years. New Home sales have fallen off a cliff.

From: Record Low New Home Sales in January


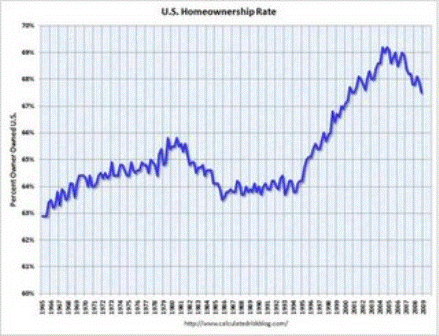
The homeownership rate decreased slightly to 67.5% and is now back to the levels of late 2000.

Note: graph starts at 60% to better show the change.

From: Q4: Homeownership Rate Declines to 2000 Level


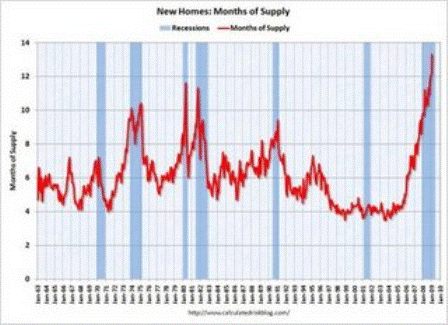
The months of supply is at an all time record 13.3 months in January.

From: Record Low New Home Sales in January


[top]

Deficit myths are the problem


[Skip to the end]

Yes, that’s the problem, output and employment can be restored relatively quickly with the right fiscal adjustment, but deficit myths are in the way.

A full payroll tax holiday and $300 billion to the states on a per capita basis with no strings attached would very quickly restore demand, including retail sales and home sales, which would be quickly followed by continuing employment and output gains.

No Ordinary Recession

by Axel Leijonhufvud

Feb 13 (Voxeu) — “Fiscal stimulus will not have much effect as long as the financial system is deleveraging. Even if that problem were to be more or less solved, the government deficit would have to offset both the decline in industry investment and the rise in household saving – a gap that is rising as the recession deepens. Here, too, the public is sceptical and prone to conclude that a program that only slows or stops the decline but fails to “jump start” the economy must have been a waste of tax payers’ money. The most effective composition of such a program is also a problem.”


[top]

2009-02-12 USER


[Skip to the end]


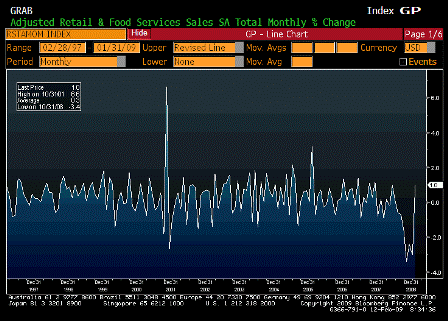
Advance Retail Sales MoM (Jan)

Survey -0.8%
Actual 1.0%
Prior -2.7%
Revised -3.0%

 
Karim writes:

  • Retail sales rise 1% in January for first rise in 7mths.
  • December revised to down 3% from down 2.7%.
  • 3mth annualized rate of change improves from -25.5% to -24.3%.

[top][end]

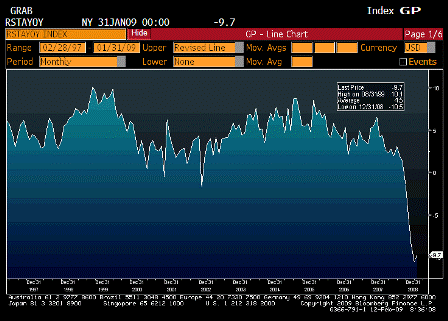
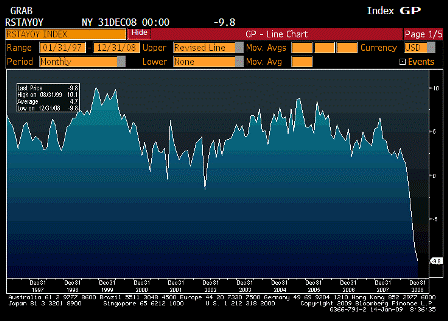
Advance Retail Sales YoY (Jan)

Survey n/a
Actual -9.7%
Prior -10.5%
Revised n/a

[top][end]

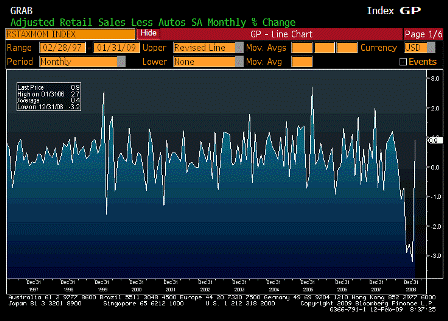
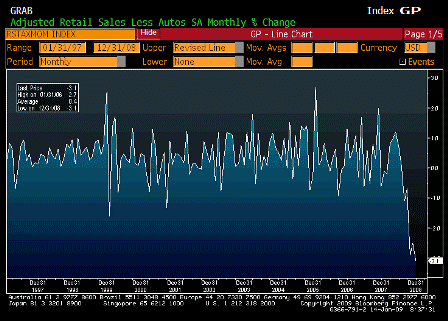
Retail Sales Less Autos MoM (Jan)

Survey -0.4%
Actual 0.9%
Prior -3.1%
Revised -3.2%

[top][end]

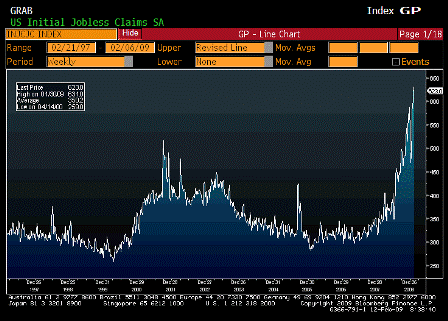
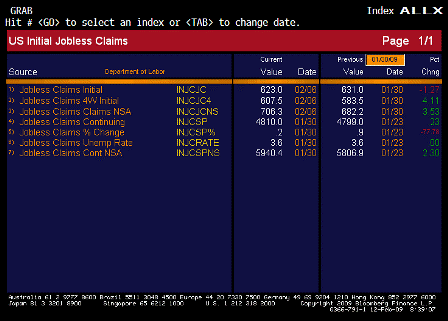
Initial Jobless Claims (Feb 7)

Survey 610K
Actual 623K
Prior 626K
Revised 631K

 
Karim writes:

  • Initial claims drop 8k to 623k
  • [top][end]

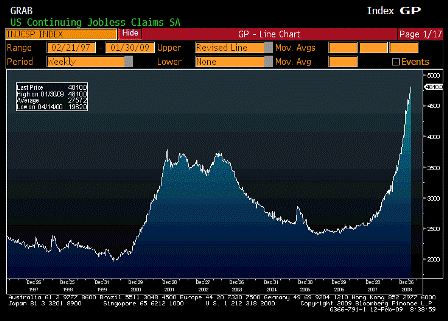
    Continuing Claims (Jan 31)

    Survey 4800K
    Actual 4810K
    Prior 4788K
    Revised 4799K

     
    Karim writes:

    • Continuing claims rise 11k to new cycle high
    • Chicago Fed Prez Evans yesterday that further policy accommodation was needed

    [top][end]

    Jobless Claims ALLX (Jan 31)

    [top][end]

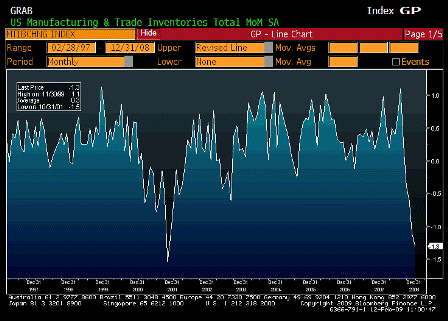
    Business Inventories MoM (Dec)

    Survey -0.9%
    Actual -1.3%
    Prior -0.7%
    Revised -1.1%

    [top][end]

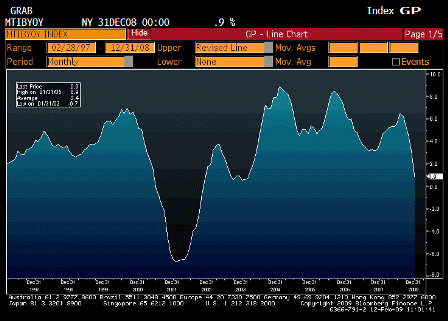
    Business Inventories YoY (Dec)

    Survey n/a
    Actual 0.9%
    Prior 2.9%
    Revised n/a


    [top]

    Obama does not need international help


    [Skip to the end]

    Obama Needs ‘Yes We Can’ Abroad to Help End Global Recession

    by Rich Miller

    Jan 19 (Bloomberg) — The U.S. led the global economy into its worst recession in at least a quarter century. Now the rest of the world is looking to Barack Obamato lead the way out. The trouble is, even the incoming commander-in-chief of the biggest economy can’t do it alone.

    Yes he can!

    And we would be better off if we did it ourselves.

    With industrial nations suffering their first synchronous decline since World War II, Obama needs policy makers in other countries to pull their weight.

    No he doesn’t!

    He also requires a resurrection of animal spirits — among investors, banks, companies and consumers — if his government-led effort to revive growth is to succeed.

    No he doesn’t!

    “We’re facing a more pervasive, more widespread downturn in the global economy than ever before,” says Allen Sinai, chief global economist at Decision Economics in New York. “It cries out for other countries to stimulate their economies, and stimulate them strongly, rather than to rely on a U.S. upturn to recover.”

    No it doesn’t!

    ‘Sweeping Effort’

    Obama has said the budget package won’t solve all America’s ills.

    Right, but the right fiscal package can solve the current financial ill- lack of domestic demand- in a matter of weeks.

    In a Jan. 8 speech, he called for a “sweeping effort” to help people who face foreclosure remain in their homes. He pledged to prevent “catastrophic failures” of banks and promised to overhaul “weak and outdated” financial regulation.

    That won’t do much for the macro economy in the immediate future.

    While Obama, 47, may be trying to temper expectations in the U.S., “hopes are high in Asia” that the U.S. stimulus will help countries there weather a collapse in exports, says Tim Condon, head of Asia research at ING Groep NV in Singapore. “They were pushed into trouble by an external shock and so want another one to help them accelerate their way out.”

    Let’s give it to them and thereby improve our real terms of trade dramatically!

    Condon says he doubts the Obama plan will be much help to the region. About $550 billion of the program consists of spending on such things as roads, bridges, education, health care and other domestic projects that would do little to boost America’s imports from Asia or elsewhere.

    Agreed, the fiscal package needs to be larger/better:

    1. Complete payroll tax holiday would add $20 billion per week to employees and employers.
    2. $300 billion to the state pro-rata based on population with no strings attached.
    3. Federal funding for national service jobs at $8 per hour that includes health care.
    4. Pitching In

      No matter how much governments do, it won’t generate a lasting recovery unless companies, banks and consumers also pitch in.

      Yes it will!

      “Fiscal expansion can’t be the answer forever,” says Peter Hooper, a former Federal Reserve official who’s now chief economist at Deutsche Bank Securities in New York.

      The right fiscal balance always has been and always will be ‘the answer’.

      “You need to get private spending going again. You need to get the financial sector working again.”

      No you don’t.

      That may take a while. U.S. retail sales fell for the sixth straight month in December, the longest string of declines in records going back to 1992, as the credit crunch led Americans to cut back on everything from eating out to buying cars.

      For his part, Obama says he is under no illusion that things can be turned around anytime soon.

      “There are no quick or easy fixes to this crisis,

      Yes there are!

      which has been many years in the making, and it’s likely to get worse before it gets better,” he said last month. “But now is the time to respond with urgent resolve to put people back to work and get our economy moving again.”

      A mid February package from Congress is not urgent resolve.

      Congress has been dragging its feet since it was clear in October that something had gone very wrong with aggregate demand.

      Randall Wray, Research Director for the Center for Full Employment
      and Price Stability and Senior Scholar at the Levy Economics Institute writes:

      It is amazing that the media keeps going back to pundits who got it wrong during the boom and continue to get it wrong in the bust. The US does not need foreign help to restore its economy. It does not need to resolve problems in the banking sector before it can restore its economy. All it needs is a sufficient fiscal stimulus to create jobs, restore consumer demand, and improve private sector balance sheets. This will pull along the financial sector and the foreign sector. US banks will not work their way out of insolvency and begin lending again until the economy starts to recover. While it is in the interest of sovereign foreign nations to use their own fiscal stimulus to restore growth, their governments wrongly depend on export-led growth models thus will wait until the US recovers. So the solution is fiscal stimulus in the US, likely on a scale that is at least twice as big as what Obama is pushing. And there is no need to get into a fight about whether it ought to be tax cuts or spending increases–the answer is that we need both: a payroll tax holiday, public infrastructure, direct job creation, and help for state and local governments.


      [top]
    2009-01-14 USER


    [Skip to the end]


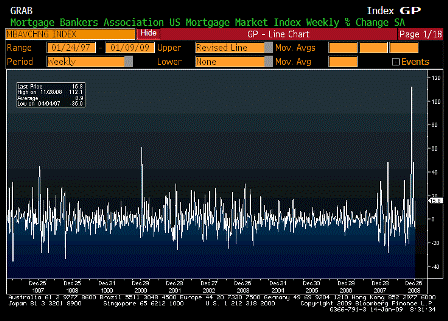
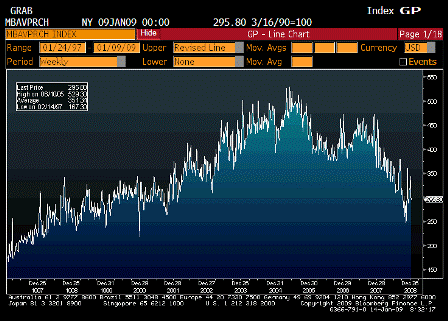
    MBA Mortgage Applications (Jan 9)

    Survey n/a
    Actual 15.8%
    Prior -8.2%
    Revised n/a

    [top][end]

    MBA Purchasing Applications (Jan 9)

    Survey n/a
    Actual 295.80
    Prior 344.20
    Revised n/a

    [top][end]

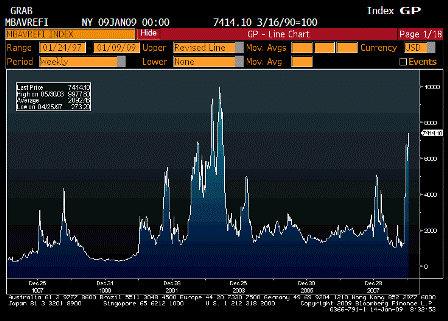
    MBA Refinancing Applications (Jan 9)

    Survey n/a
    Actual 7414.10
    Prior 5904.50
    Revised n/a

    [top][end]


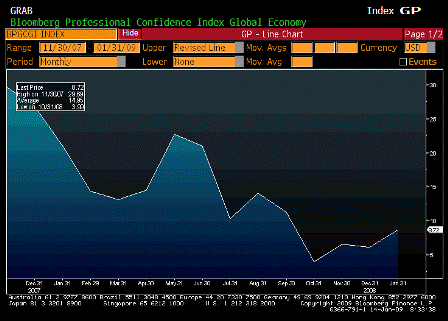
    Bloomberg Global Confidence (Jan)

    Survey n/a
    Actual 8.72
    Prior 6.07
    Revised n/a

    [top][end]


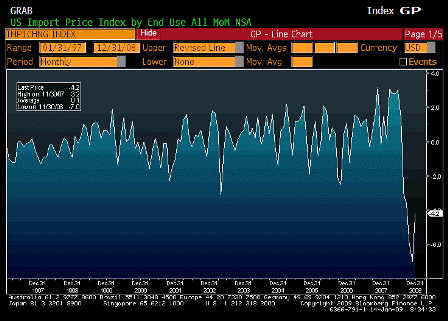
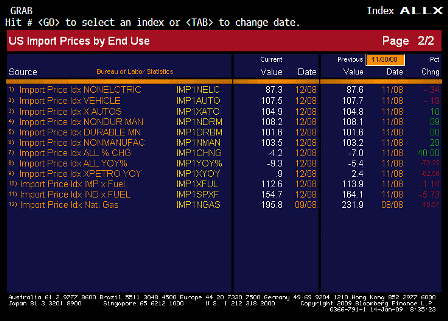
    Import Price Index MoM (Dec)

    Survey -5.3%
    Actual -4.2%
    Prior -6.7%
    Revised -7.0%

    [top][end]

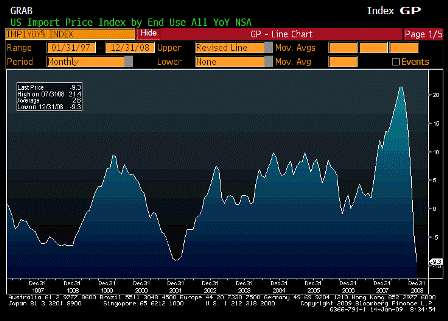
    Import Price Index YoY (Dec)

    Survey -9.5%
    Actual -9.3%
    Prior -4.4%
    Revised -5.4%

    [top][end]

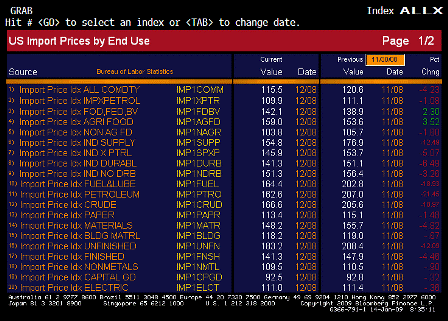
    Import Price Index ALLX1 (Dec)

    [top][end]

    Import Price Index ALLX2 (Dec)

    [top][end]


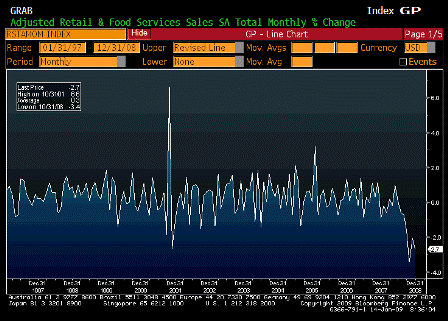
    Advance Retail Sales MoM (Dec)

    Survey -1.2%
    Actual -2.7%
    Prior -1.8%
    Revised -2.1%

    [top][end]

    Advance Retail Sales YoY (Dec)

    Survey n/a
    Actual -9.8%
    Prior -8.2%
    Revised n/a

    [top][end]

    Retail Sales Less Autos MoM (Dec)

    Survey -1.4%
    Actual -3.1%
    Prior -1.6%
    Revised -2.5%

    [top][end]


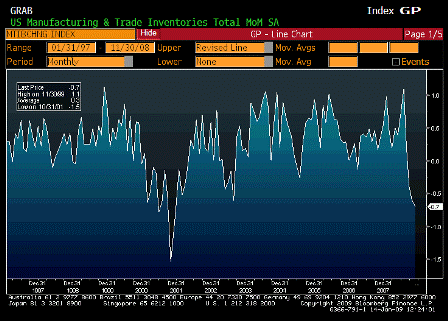
    Business Inventories MoM (Nov)

    Survey -0.5%
    Actual -0.7%
    Prior -0.6%
    Revised n/a

    [top][end]

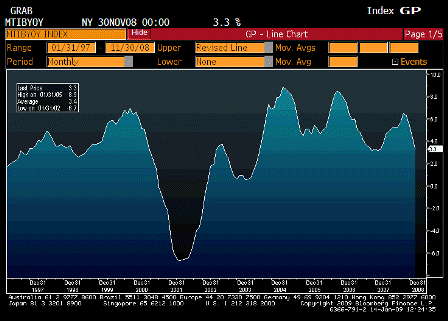
    Business Inventories YoY (Nov)

    Survey n/a
    Actual 3.3%
    Prior 4.5%
    Revised n/a


    [top]
    2008-12-12 USER


    [Skip to the end]


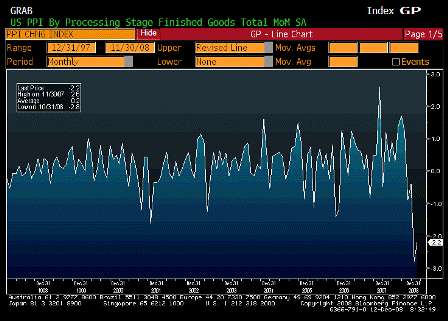
    Producer Price Index MoM (Nov)

    Survey -2.0%
    Actual -2.2%
    Prior -2.8%
    Revised n/a

    [top][end]

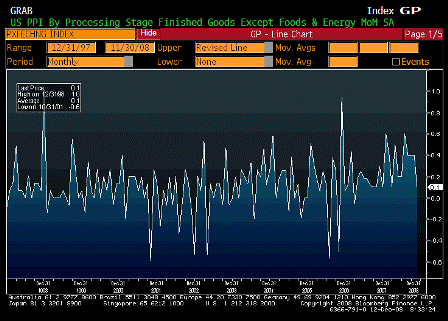
    PPI Ex Food and Energy MoM (Nov)

    Survey 0.1%
    Actual 0.1%
    Prior 0.4%
    Revised n/a

    [top][end]

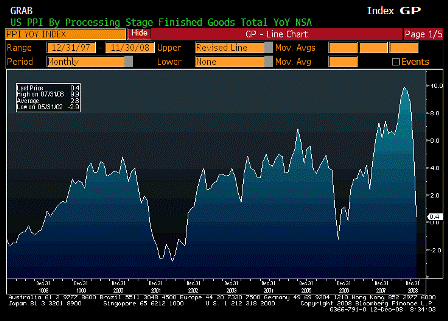
    Producer Price Index YoY (Nov)

    Survey 0.2%
    Actual 0.4%
    Prior 5.2%
    Revised n/a

    [top][end]

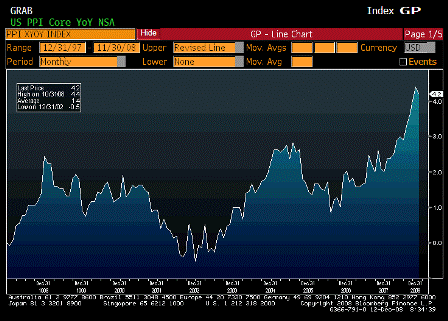
    PPI Ex Food and Energy YoY (Nov)

    Survey 4.2%
    Actual 4.2%
    Prior 4.4%
    Revised n/a

    [top][end]

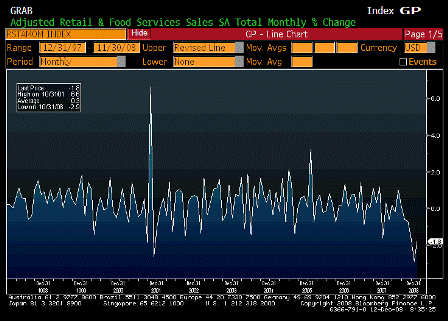
    Advance Retail Sales MoM (Nov)

    Survey -2.0%
    Actual -1.8%
    Prior -2.8%
    Revised -2.9%

    [top][end]

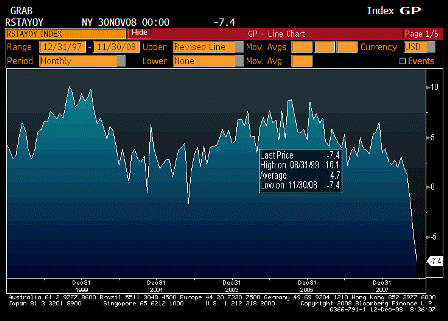
    Advance Retail Sales YoY (Nov)

    Survey n/a
    Actual -7.4%
    Prior -4.6%
    Revised n/a

    [top][end]

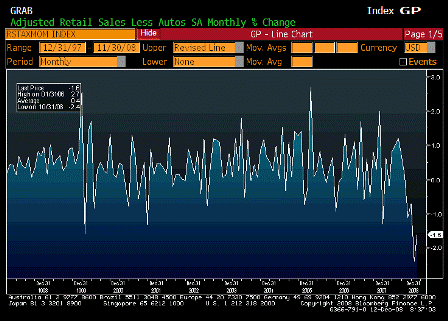
    Retail Sales Less Autos MoM (Nov)

    Survey -1.8%
    Actual -1.6%
    Prior -2.2%
    Revised -2.4%

    [top][end]

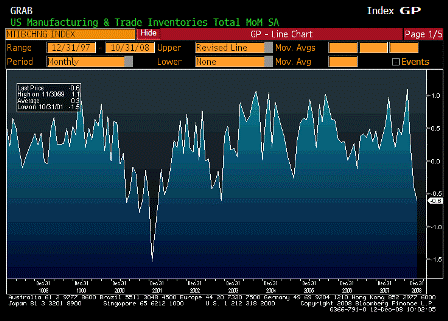
    Business Inventories MoM (Oct)

    Survey -0.2%
    Actual -0.6%
    Prior -0.2%
    Revised -0.4%

    [top][end]

    Business Inventories YoY (Oct)

    Survey n/a
    Actual 4.6%
    Prior 5.4%
    Revised n/a

    [top][end]

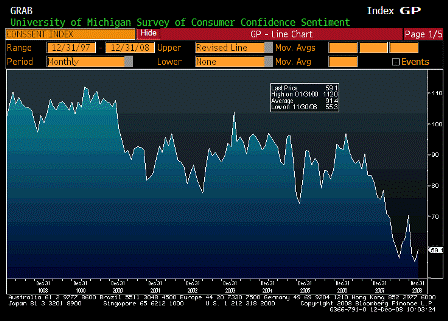
    University of Michigan Confidence (Dec P)

    Survey 54.5
    Actual 59.1
    Prior 55.3
    Revised n/a

    [top][end]

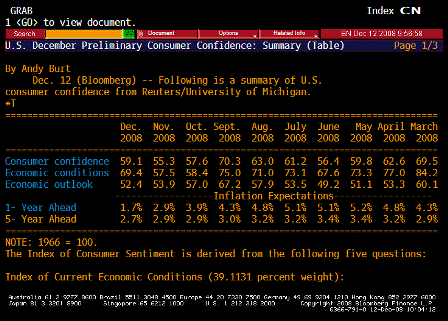
    University of Michigan TABLE Inflation Expectations (Dec P)


    [top]
    EU News Highlights 12-01-08


    [Skip to the end]

    With no sign of a meaningful response, and, worse yet, no safe channel to get it done even if they wanted to, systemic risk in the eurozone continues to escalate.

    Highlights

    European Manufacturing Contracts More Than Estimated
    German Retail Sales Drop as Recession Damps Spending
    Spanish Manufacturing Contracted at Record Pace in November
    ECB to Cut Benchmark Rate 1/2 Point, Economists’ Survey Shows
    EU’s Barroso Sees Right Conditions For ECB Rate Cut
    Italy approves economic aid, boost for banks
    European Government Bonds Gain on Signs Slump Is Deepening


    [top]
    2008-11-25 USER


    [Skip to the end]

     
    Karim writes:

    • Overlooked with the Fed headlines, but likely to lead to further downward revisions to Q4/Q1 growth outlook.

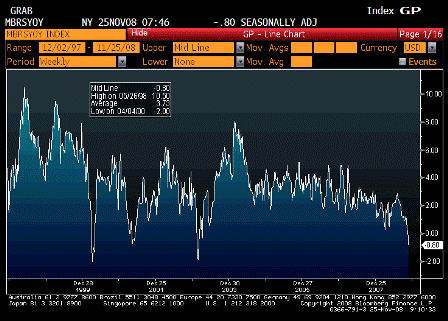
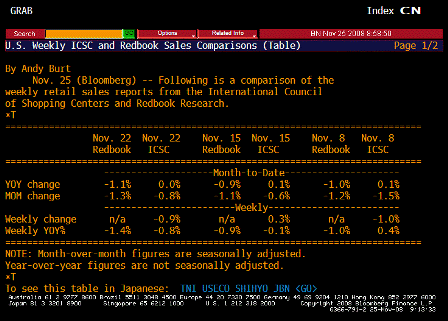
    ICSC UBS Store Sales YoY (Nov 25)

    Survey n/a
    Actual -0.80%
    Prior -0.10%
    Revised n/a

     
    Looking very soft, even with low gasoline prices.

    [top][end]

    ICSC UBS Store Sales WoW (Nov 25)

    Survey n/a
    Actual -0.90%
    Prior 0.30%
    Revised n/a

    [top][end]

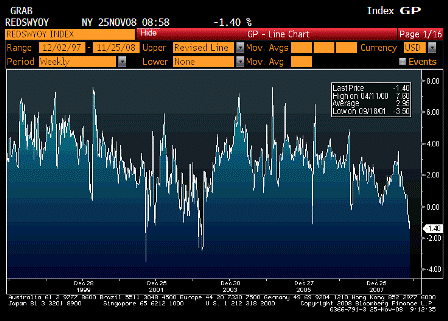
    Redbook Store Sales Weekly YoY (Nov 25)

    Survey n/a
    Actual -1.40%
    Prior -0.90%
    Revised n/a

     
    Same.

    [top][end]

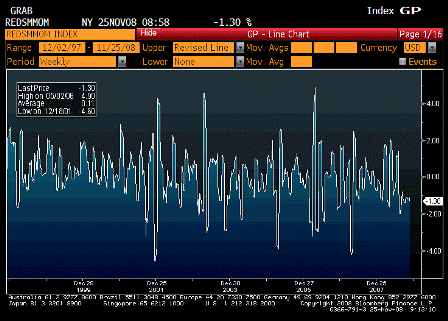
    Redbook Store Sales MoM (Nov 25)

    Survey n/a
    Actual -1.30%
    Prior -1.10%
    Revised n/a


    Karim writes:

    • Johnson Redbook sales down 1.3% m/m thru 3rd week of November.
    • Another negative retail sales month sets up Q4 real GDP for at least -4%

    [top][end]

    ICSC UBS Redbook Comparison TABLE (Nov 25)

    [top][end]


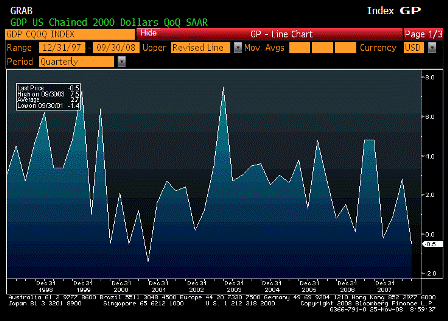
    GDP QoQ Annualized (3Q P)

    Survey -0.5%
    Actual -0.5%
    Prior -0.3%
    Revised n/a

     
    As expected and in line with the longer term down trend in real gdp growth

    Good evidence of a continuing and increasing lack of aggregate demand.

    [top][end]

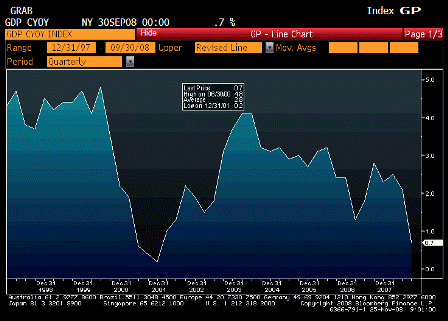
    GDP YoY Annualized Real (3Q P)

    Survey n/a
    Actual 0.7%
    Prior 2.1%
    Revised n/a

     
    Mildly positive but the trend is still looking down.

    [top][end]

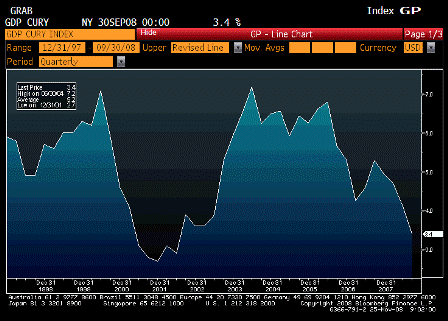
    GDP YoY Annualized Nominal (3Q P)

    Survey n/a
    Actual 3.4%
    Prior 4.1%
    Revised n/a

     
    Barely positive.

    [top][end]

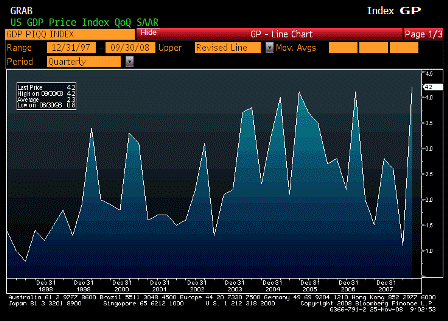
    GDP Price Index (3Q P)

    Survey 4.2%
    Actual 4.2%
    Prior 4.2%
    Revised n/a

     
    High but expected to fall with falling commodity prices.

    [top][end]

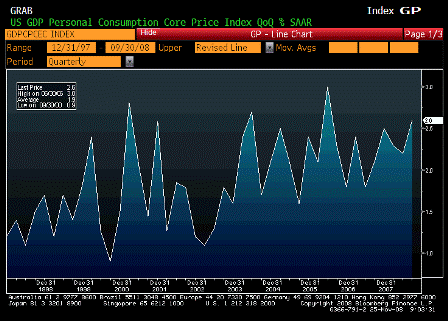
    Core PCE QoQ (3Q P)

    Survey 2.9%
    Actual 2.6%
    Prior 2.9%
    Revised n/a

     
    Looks to be in a long term uptrend, though also expected to fall with commodity prices.

    [top][end]

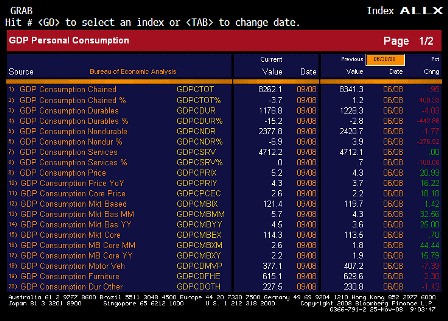
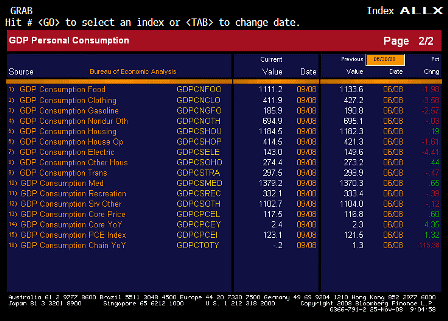
    GDP ALLX 1 (3Q P)

    [top][end]

    GDP ALLX 2 (3Q P)

    [top][end]


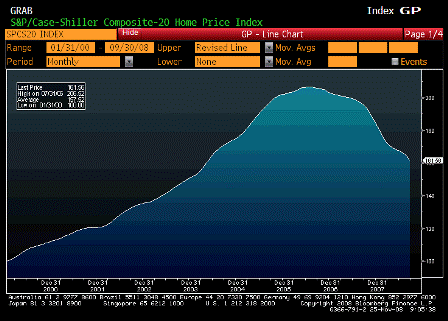
    S&P Case Shiller Home Price Index (Sep)

    Survey 163.00
    Actual 161.56
    Prior 164.57
    Revised 164.40

     
    Took a turn for the worse.

    Karim writes:

    • Case Shiller down 1.85% q/q and -17.4% y/y

    [top][end]

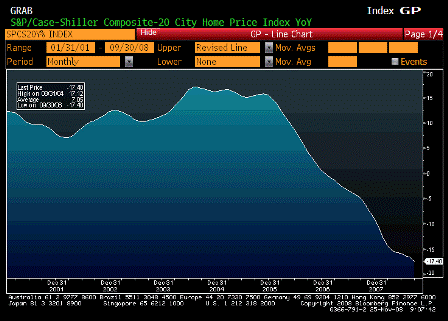
    S&P CS Composite 20 YoY (Sep)

    Survey -16.90%
    Actual -17.40%
    Prior -16.62%
    Revised -16.60%

    [top][end]

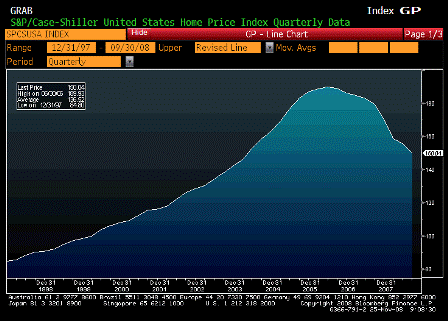
    S&P Case Shiller US Home Price Index (3Q)

    Survey n/a
    Actual 150.04
    Prior 155.32
    Revised 155.45

    [top][end]

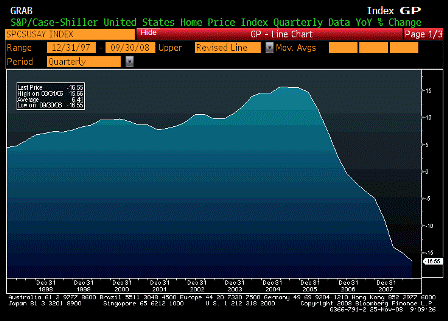
    S&P Case Shiller US Home Price Index YoY (3Q)

    Survey -17.05%
    Actual -16.55%
    Prior -15.40%
    Revised -15.07%

    [top][end]


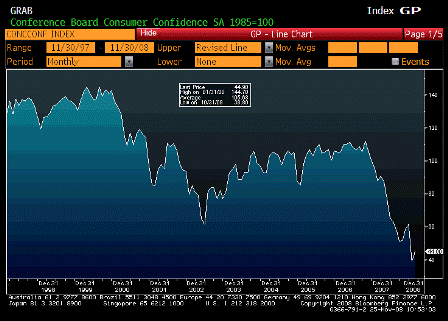
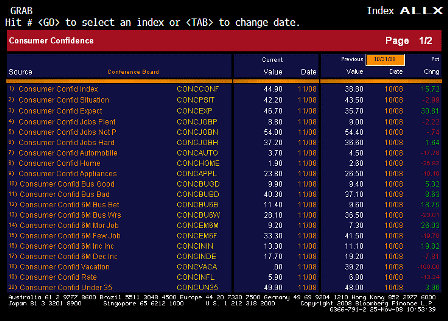
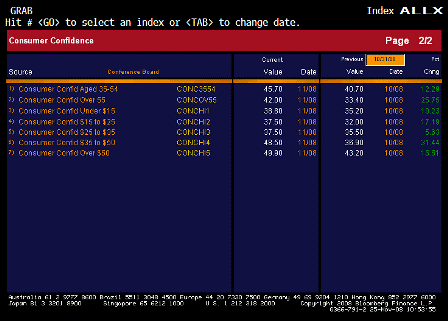
    Consumer Confidence (Nov)

    Survey 38.0
    Actual 44.9
    Prior 38.0
    Revised 38.8

     
    Tiny blip up- well above expectations.

    [top][end]

    Consumer Confidence ALLX 1 (Nov)

    [top][end]

    Consumer Confidence ALLX 2 (Nov)

    [top][end]


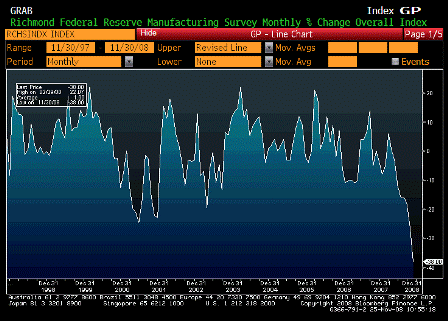
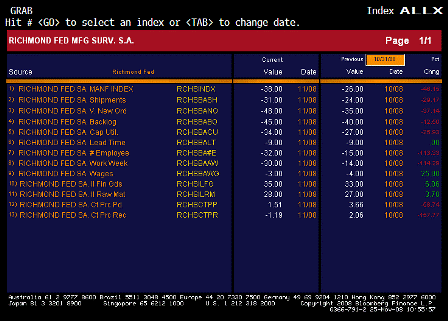
    Richmond Fed Manufacturing Index (Nov)

    Survey -27
    Actual -38
    Prior -26
    Revised n/a

     
    Far worse than expected, more in line with Q4 GDP forecasts of -4%.

    [top][end]

    Richmond Fed Manufacturing Index ALLX (Nov)

    [top][end]


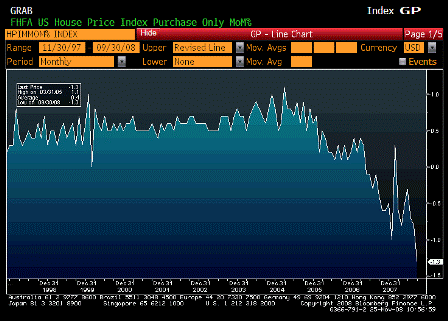
    House Price Index MoM (Sep)

    Survey -0.7%
    Actual -1.3%
    Prior -0.6%
    Revised -0.8%

     
    Also falling like a rock.

    [top][end]

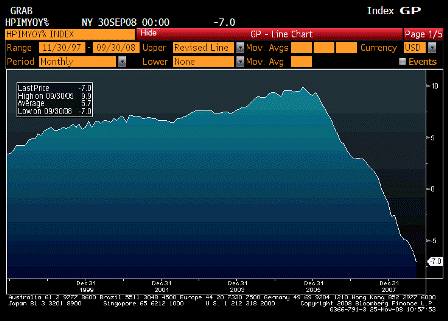
    House Price Index YoY (Sep)

    Survey n/a
    Actual -7.0%
    Prior -6.1%
    Revised n/a

     
    No sign of turning around yet.

    [top][end]

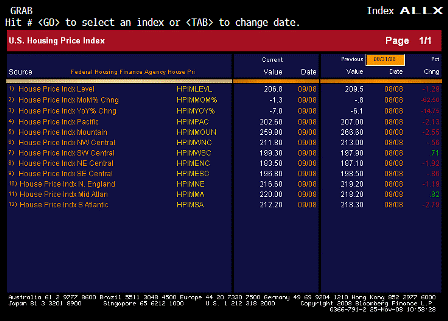
    House Price Index ALLX (Sep)

    [top][end]

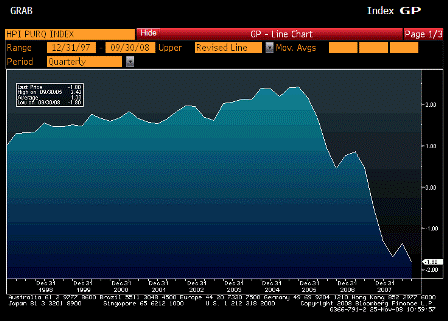
    House Price Purchase Index QoQ (3Q)

    Survey n/a
    Actual -1.8%
    Prior -1.4%
    Revised n/a

     
    The decline has resumed.


    [top]