Durable goods orders, Redbook retail sales

Not good.
Note the year over year change.
And inventories remain way high:

Durable Goods Orders
er-4-26-1
Highlights
The factory sector posted a respectable March with orders for durable goods up 0.8 percent which follows a revised downswing of 3.1 percent in February and a very solid 4.3 percent gain in January. March reflects a big gain for defense goods which helped offset a downward swing for commercial aircraft. A negative in the report is a 3.0 percent decline for motor vehicle orders reflecting weakness at the retail level.

Data on core capital goods orders are uninspiring, unchanged for new orders in March to extend a soft trend. Shipments for this series, which are inputs into GDP, inched 0.3 percent higher but follow outright declines in the first two months of the quarter.

Shipments in March fell 0.5 percent and unfilled orders fell 0.1 percent. Manufacturers are carefully watching inventories for unwanted builds keeping inventories flat in the month and the inventory-to-shipments ratio unchanged at 1.66.

er-4-26-2
er-4-26-3

Housing starts, Redbook retail sales

Starts and permits down and below expectations. I see this as removing any hope of any kind of sustainable growth. The traditional sources of private sector credit expansion- housing, vehicles, and general investment are continuing to decelerate when acceleration is needed just to replace the capital expenditures that were being generated by $100 oil. And even then GDP growth was modest, at best.

United States : Housing Starts
er-4-19-1
Highlights
Data on the housing sector are slowing going into the key spring season. Housing starts fell a very sharp 8.8 percent in March to a 1.089 million annualized rate which is well below Econoday’s consensus for 1.167 million and below the low estimate for 1.120 million. Permits are showing similar weakness, down 7.7 percent at a 1.086 million rate which is likewise below both the consensus and low estimate.

Weakness in starts is split roughly evenly between single-family and multi-family components with weakness in permits concentrated in multi-families. Nevertheless, there is fundamental strength in the year-on-year rates, at plus 14.2 percent for starts and a less spectacular plus 4.6 percent for permits.

Regional data show declines throughout except for starts in the Northeast with ongoing work tied to a rush last year in permits (on a changes in New York City real estate law). Turning to permits, the Midwest is showing the most strength with a 24.2 percent year-on-year gain followed by the South at 11.3 percent. Not favorable is weakness in the West, a key region for new housing where permits are down a year-on-year 6.1 percent. Permits in the Northeast are down 21.7 percent.

A positive in the report is strength in total completions, up 3.5 percent in the month for a 31.6 percent year-on-year gain. Yet most of this report is downbeat. Spring is the season that those in the housing sector count on, but momentum definitely is not building. Watch for existing home sales for March on tomorrow’s calendar.

Nor is there any sign of life at the retail sales level:
er-4-19-2

Saudi policy, Consumer sentiment

Confirms what had to be the case as a simple point of logic.

Saudis set price and let quantity adjust:

Saudi Arabia is producing below its potential capacity because it only responds to demand, the prince said. “If we produced more oil than there is demand, we would destroy many markets. So we consider supply and demand, and we look at any demand we receive and we deal with it.”

Less then expected and trending lower:

Consumer Sentiment
er-4-18-1
Highlights
A week of mostly weak economic data ends on a drop for consumer sentiment, to a much lower-than-expected 89.7 for the flash April reading vs 91.0 for final March.

Weakness is centered in the expectations component, down 1.9 points to 79.6 to signal, perhaps, emerging doubts over future job and income prospects. The assessment of current conditions is down only 2 tenths to 105.4 in an early indication that consumer activity in April will roughly match that of March, which however was a weak month judging by the retail sales report posted earlier in the week.

In another headache, long-term inflation expectations are eroding further despite the rise in oil prices, down 2 tenths for the 5-year outlook to 2.5 percent. One-year expectations are stable at 2.7 percent.

The decline in this report isn’t exactly incremental but is far from a free fall, especially the resilience in current conditions. Still, low wage growth and a heated political climate are not proving to be positives for consumer confidence.

er-4-18-2

Mtg purchase apps, Retail sales, Business inventories, Atlanta Fed

A bit of an increase after a dip, but still low and still depressed, as per the chart.

And spikes up like this have most often subsequently reversed:

MBA Mortgage Applications
er-4-13-1
Highlights
Driven by falling interest rates, mortgage application activity was brisk in the April 8 week both for home purchases, up 8.0 percent, and refinancing, up 11.0 percent from the previous week. Purchase applications are up a striking 24 percent from this time last year, attaining the second highest level since May 2010. Mortgage rates fell to the lowest level since January 2015, with the average 30-year fixed rate for conforming mortgages ($417,000 or less) down 4 basis points from the prior week at 3.82 percent.

er-4-13-2
Bad one here, and not to forget sales = income:

Retail Sales
er-4-13-3
Highlights
Retail sales, down a disappointing 0.3 percent in March, were pulled lower by auto sales but unfortunately do show wider weakness. Auto sales fell a very steep 2.1 percent in March and last posted a monthly gain way back in November. This is the biggest drop for vehicle sales since February last year.

In an offset, gasoline sales, boosted by higher prices at the pump, jumped 0.9 percent. Excluding just gasoline — which offers a very telling reading on consumer demand — retail sales fell 0.4 percent. Excluding both autos and gasoline, sales rose 0.1 percent which is 2 tenths below expectations.

A look at year-on-year rates helps to clarify trends in the data. Overall retail sales are up only 1.7 percent, well down from 3.7 percent in February. Excluding autos, sales are up only 1.8 percent. The best reading comes from ex-auto ex-gas which is at plus 3.9 percent for, however, a 9 tenths decline from February. The reading of the greatest concern, however, is once again excluding only gasoline where year-on-year sales slowed to plus 3.3 percent from February’s 5.4 percent.

A sign of the month’s weakness is contraction at restaurants, which like autos is a discretionary category and which fell a very sharp 0.8 percent in the month. A plus is building materials which rose a very strong 1.4 percent for a second month in gains that point to extending strength for residential investment. Other components include a sharp decline for apparel and for department stores, offset by a second straight strong gain for health & personal care.

There are upward revisions to February but they definitely do not offset weakness, despite whatever uncertainties over Easter adjustments, in the immediate month of March. This report, especially the stubborn weakness for auto sales, raises key questions over the health of the consumer, who is benefiting from low unemployment but not from wage strength. The report especially raises questions over the outlook for overall economic growth.

er-4-13-4
And more bad:

Business Inventories
er-4-13-5
Highlights
Sales are falling but fortunately so are inventories which fell 0.1 percent in February vs a 0.4 percent decline for sales. The combination keeps the inventory-to-sales ratio, which has been trending higher, at 1.41.

Retail inventories rose a very steep 0.6 percent in February especially against a 0.2 percent decline for sales. Retail inventories of autos, where sales have been weak, rose 1.3 percent in the month to swell the inventory-to-sales ratio to 2.14 from 2.12. Inventories at both manufacturers and wholesalers fell in the month to keep ratios for these readings stable.

Retail inventories, given this morning’s weak retail sales report for March, may be a risk to the nation’s inventory outlook, especially for autos where inventory backup also points to trouble for factory production. Lower down the supply chain, however, sales and inventories are balanced, at least for now.

er-4-13-6
er-4-13-7

NFIB small business optimism, Redbook retail sales, Import/export prices

When this we going up a bit it made headlines. Now when it’s flashing recession it doesn’t:

NFIB Small Business Optimism Index
er-4-12-1
Highlights
Small business owners remain pessimistic, with the small business optimism index dipping another 0.3 points in March to 92.6, surpassing February’s two year low and remaining well below the 42-year average of 98. Four of the 10 component indices posted a gain and six posted declines. Among the most optimistic parts of the index, plans to increase capital outlays rose to remain at very solid levels while the job openings were a little less hard to fill in March, but still very hard. But earnings trends continued turning from bad to worse in March, and though small business owners were more optimistic than in February in their expectations that the economy will improve, this component of the index is still in deep pessimistic territory at a net negative 17 percent.

Below prior recession levels:
er-4-12-2
And no upturn hear yet:
er-4-12-3
Deflationary pressures continue:
er-4-12-4

ECB footnote, Trade, Fed Atlanta, Redbook retail sales, ISM non manufacturing

Who would’ve thought?
;)

The ECB makes this point in a footnote on page 10:

The ECB Explains Why Central Banks Can’t Go Bankrupt in a Footnote

“Central banks are protected from insolvency due to their ability to create money and can therefore operate with negative equity.”

Trade deficit higher than expected.

GDP estimates being revised down:

International Trade
er-4-5-1
er-4-5-2

And note the general downturn in trade which has always been associated with recessions in the past:
er-4-5-3
GDP growth forecast down to only +.4% annualized, and the inventory correction impulse is yet to come:
er-4-5-4
No sign of life here yet:
er-4-5-5
Up a bit, but the trend still looking lower from last summer’s highs, as the slump in oil capex works its way through the economy:

ISM Non-Mfg Index
er-4-5-6
er-4-5-7

Car sales, Employment, Construction spending, Earnings, ISM manufacturing, Consumer sentiment

This is the big news today, and there’s nothing good about it. It’s way below expectations and continues the declilne from last year’s peak:

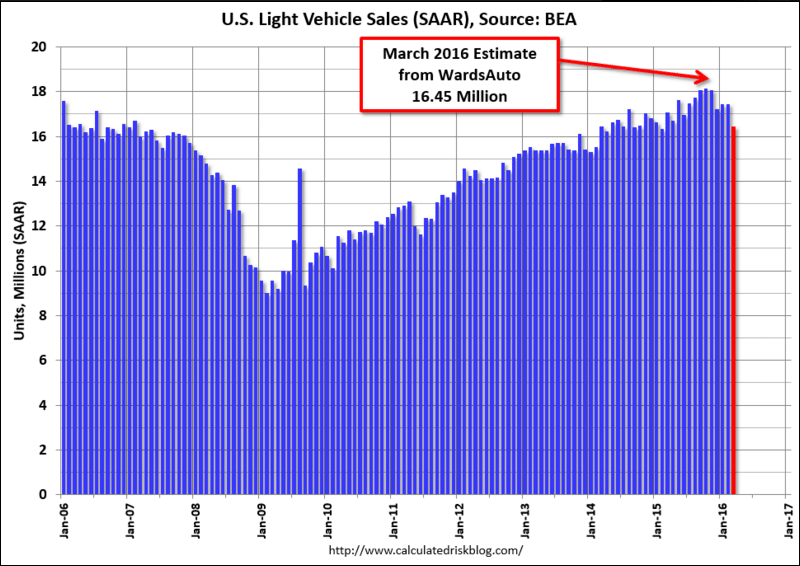
U.S. Light Vehicle Sales decline to 16.45 million annual rate in March

by Bill McBride

Based on an estimate from WardsAuto, light vehicle sales were at a 16.45 million SAAR in March.

That is down about 4% from March 2015, and down about 6% from the 17.43 million annual sales rate last month.

er-4-1-1
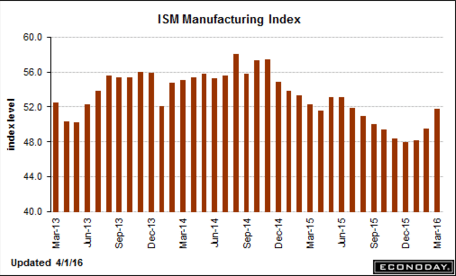
A bit better than expected, and, again, the growth rate (though generally declining) remains above GDP growth, indicating negative productivity growth. Also, it’s becoming more obvious that the ‘functional’ labor force has been a lot larger than most believed ever since the economy collapsed in 2008. Likewise, wage gains remain far below those of prior recoveries.

Employment Situation
er-4-1-2
Highlights
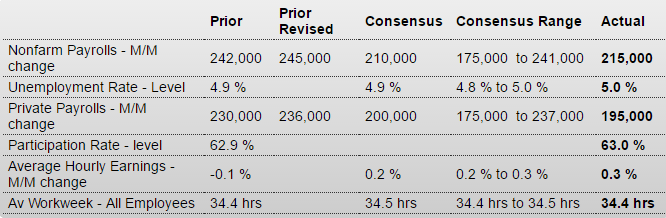
The labor market is growing with nonfarm payrolls up a higher-than-expected 215,000 in March and with the labor participation rate rising 1 tenth to 63.0 percent. The gain in participation, reflecting new job seekers coming into the market, is pulling the unemployment rate higher, up 1 tenth in March to 5.0 percent in what is the result of strength, not weakness, for employment. And there’s pressure in average hourly earnings, at least on the monthly level with a higher-than-expected gain of 0.3 percent that, however, did not lift the year-on-year which is sagging at plus 2.3 percent.

Payrolls by industries show further big gains for trade & transportation, construction and also retail. Professional & business services are also strong suggesting that employers have plenty of jobs to fill. Manufacturing, however, is once again down.

Not showing greater strength is the workweek, steady at 34.4 hours, nor manufacturing hours, with a decline in the latter pointing to another month of disappointment for the factory sector.

Revisions are not a factor in today’s report, one that, despite weak spots, points to accelerating economic growth. Yet the report is probably not strong enough to reawaken talk of a rate hike this month, at least not following Janet Yellen’s dovish speech on Tuesday, though the June FOMC may seem like a rising possibility.

er-4-1-3
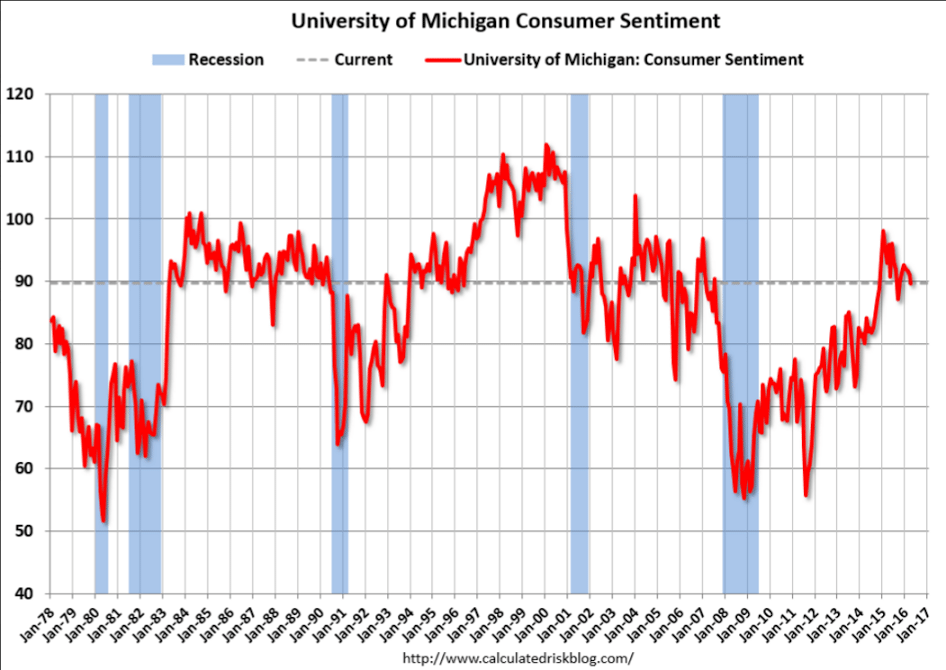
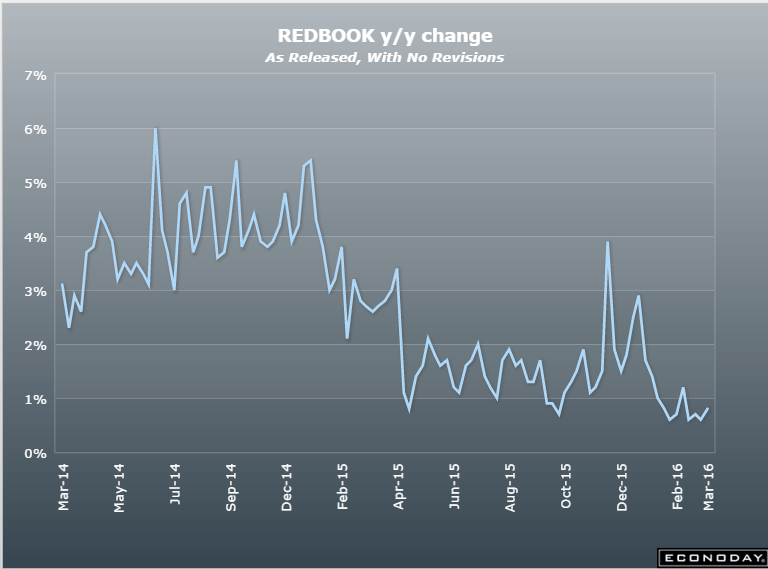
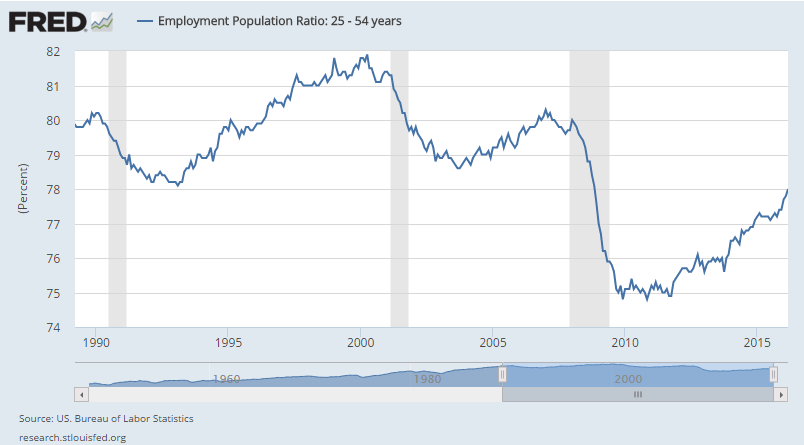
This is only gradually getting back to the LOWS of the last two cycles:
er-4-1-4
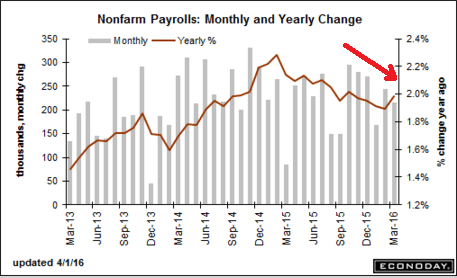
With every little wiggle up they scream WAGE INFLATION, but then wages revert lower and nothing is said. Then a wiggle up this week and it’s “WAGE INFLATION!!!!” again.
er-4-1-5
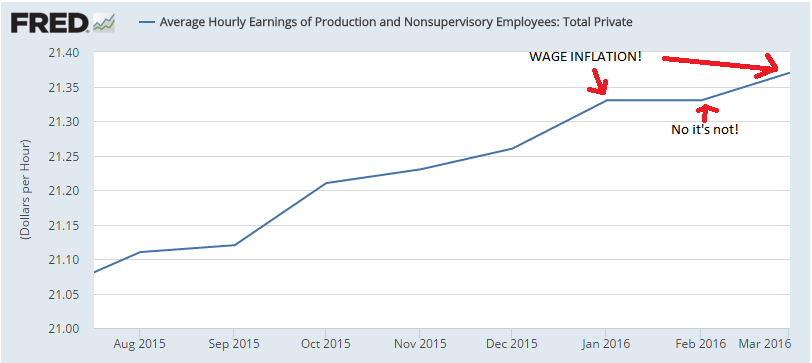
But a look at the year over year growth chart shows wage growth remains both low and depressed, a clear sign of a big whopping shortage of aggregate demand:
er-4-1-6
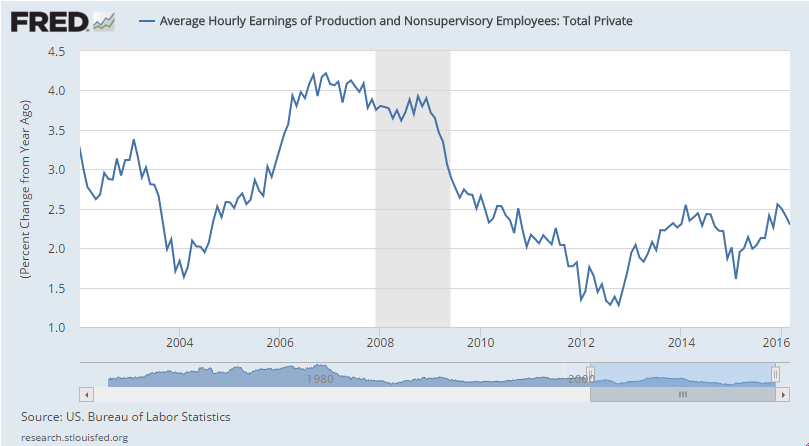
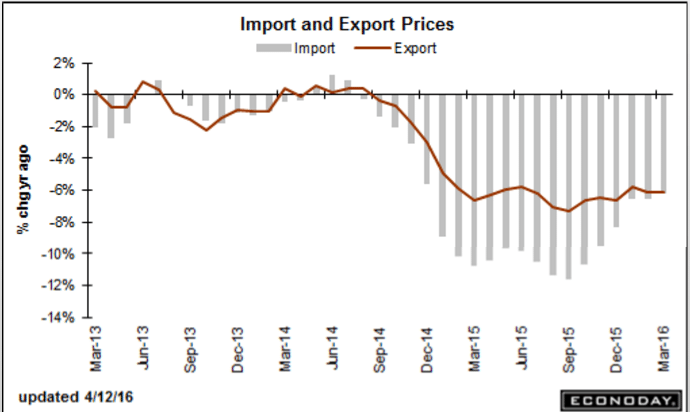
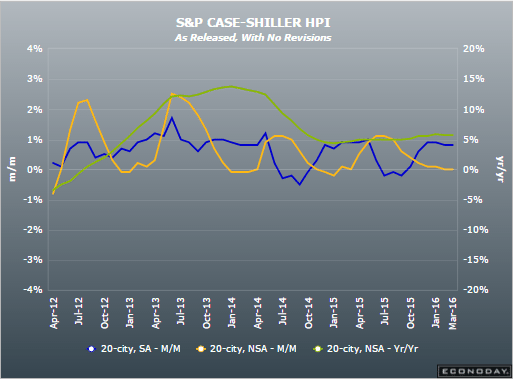
Cold winter last year, warm winter this year. The weather only gets mentioned when they are trying to make low prints look better? Note from the charts it’s still well below pre recession levels without adjusting for inflation:

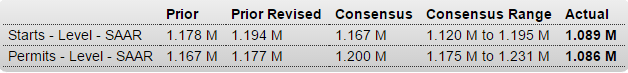
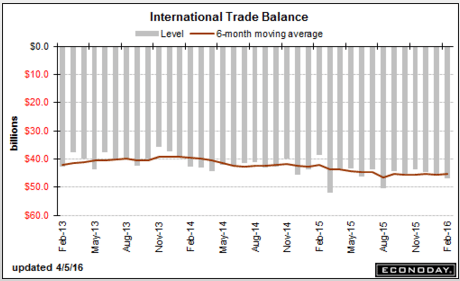
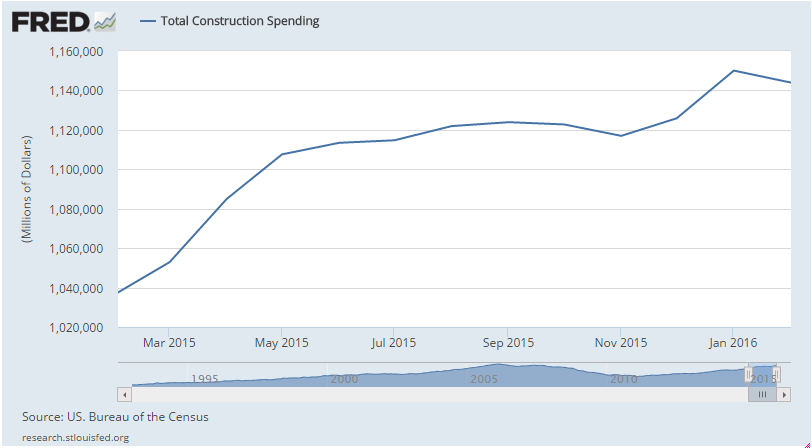
Construction Spending
er-4-1-7
Highlights
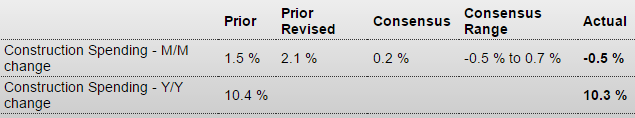
A 0.5 percent decline for February masks what is otherwise a very solid construction spending report that includes upward revisions and gains for the residential component. January is now revised 6 tenths higher to a gain of 2.1 percent with the residential component moving from unchanged to plus 0.9 percent. New single-family homes now show a 0.5 percent gain for January and a very strong 1.2 percent gain for February. Multi-family homes also show a gain, up 0.9 percent following a 3.6 percent January surge. Year-on-year growth for residential spending is now in the double digits at 10.7 percent.

It’s the non-residential component that dragged February’s totals lower, down 1.3 percent with weakness in the manufacturing, educational, and highway & street subcomponents. Still, all together, non-residential construction spending, boosted especially by hotels and also offices, is tracking in line with the residential side, at a year-on-year plus 10.6 percent.

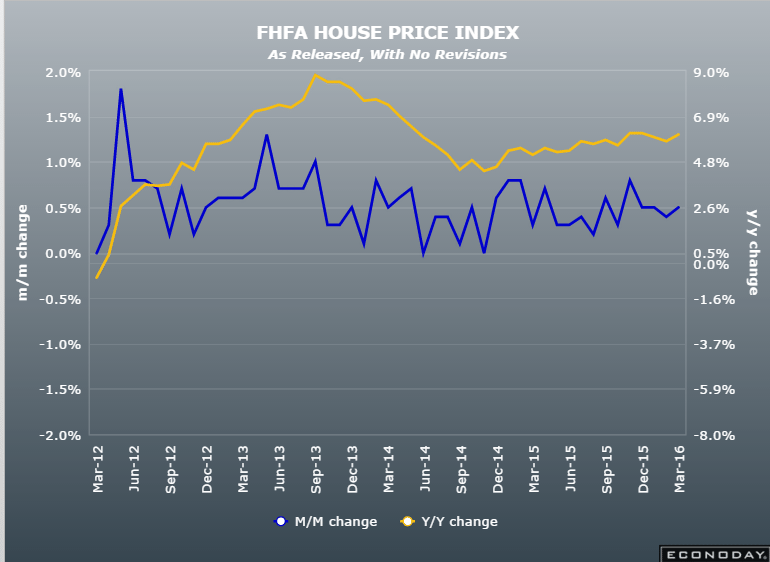
Construction spending, along with building strength for construction employment, are isolated but still fundamental positives for the housing sector where sales growth and price appreciation, however, have stalled.

er-4-1-8
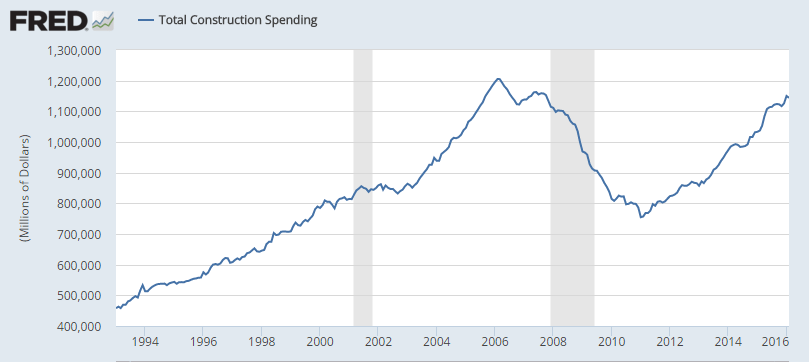
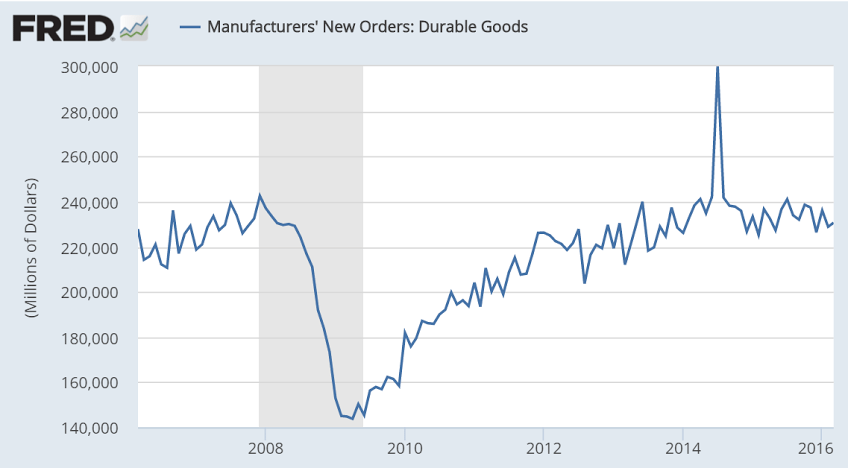
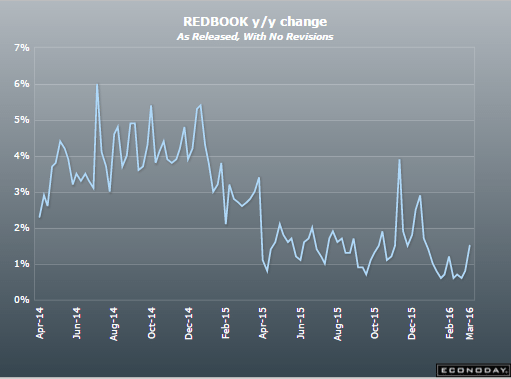
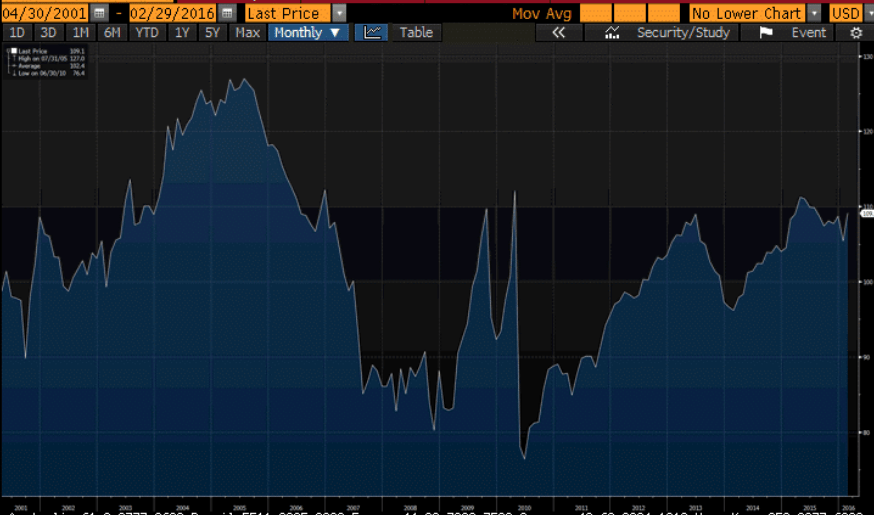
And note how flat it’s been since May:
er-4-1-9

No Easy Way Higher Without Earnings Growth

March 31 (WSJ) — First-quarter earnings for S&P 500 companies are forecast to slump 8.5% from the same period last year, according to FactSet. Revenues at S&P 500 companies are forecast to log a drop of 1.1% in the first quarter, according to FactSet, which would mark the fifth consecutive quarter of declining revenues. Analysts polled by FactSet predict earnings at S&P 500 companies will rise 3.8% in the third quarter from the same period of 2015. Revenues are forecast to advance 1.9% in the third quarter. Profits and revenues are expected to accelerate in the fourth quarter, with analysts forecasting an 11% increase in earnings and a 4.3% rise in revenues for S&P 500 companies.

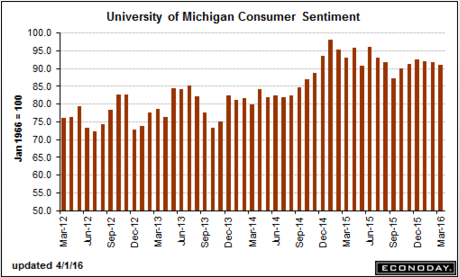
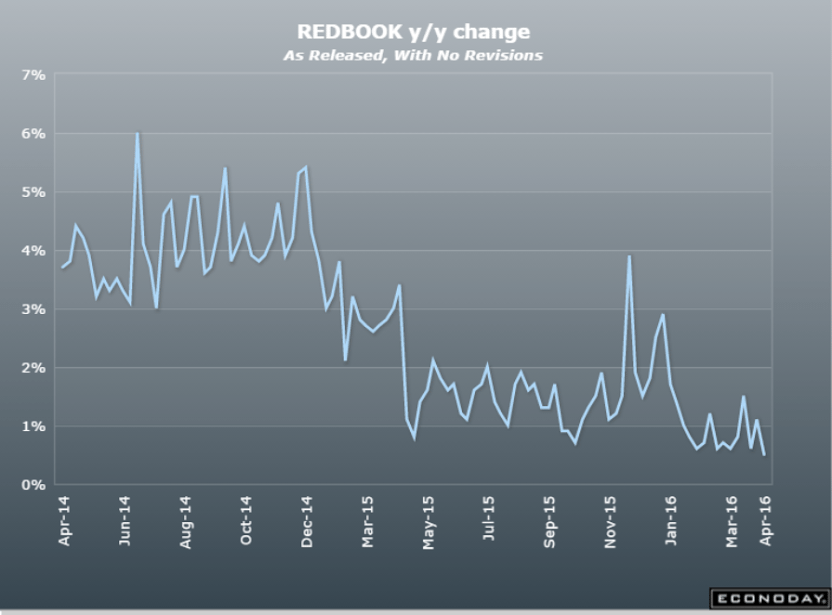
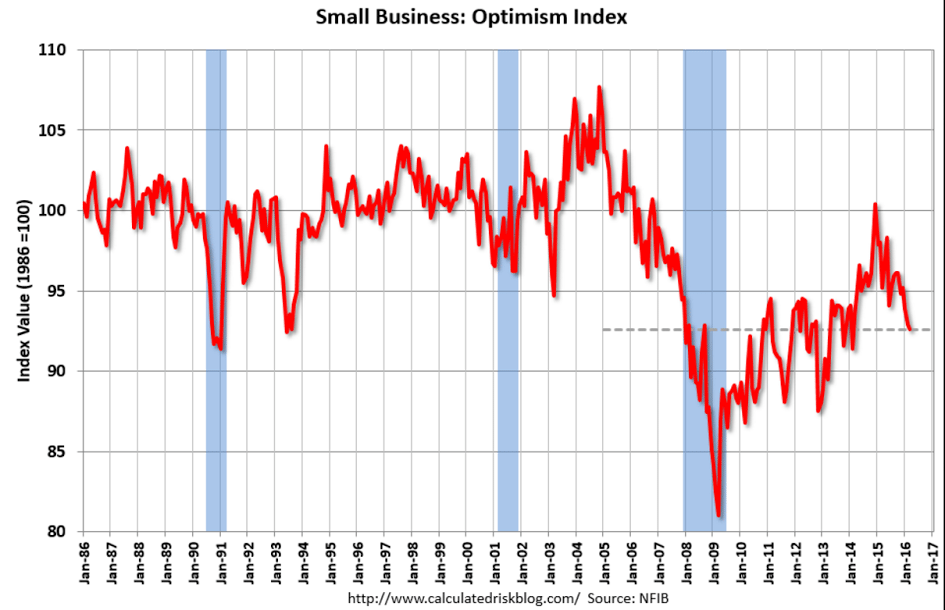
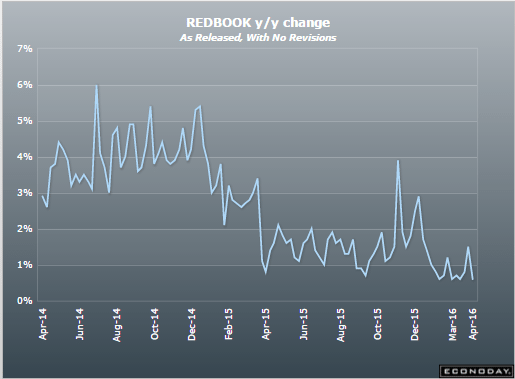
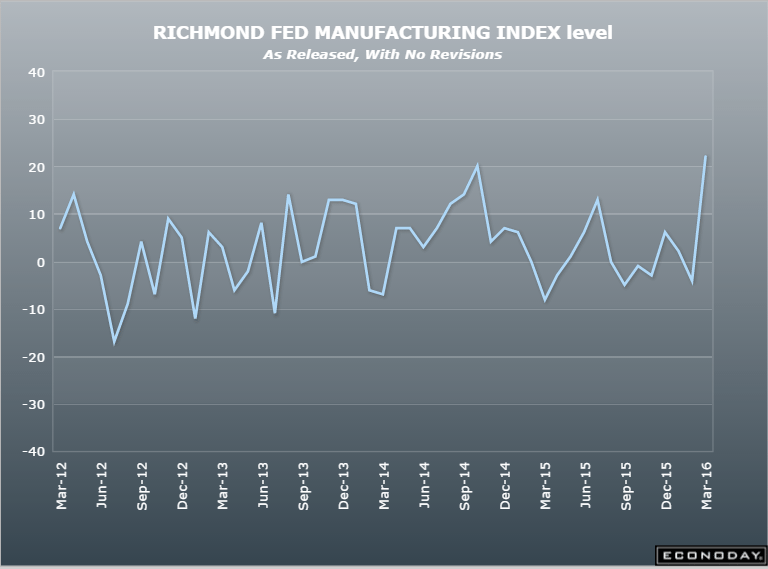
Better than expected but the rest of the news tells me this likely to go back down:
er-4-1-10
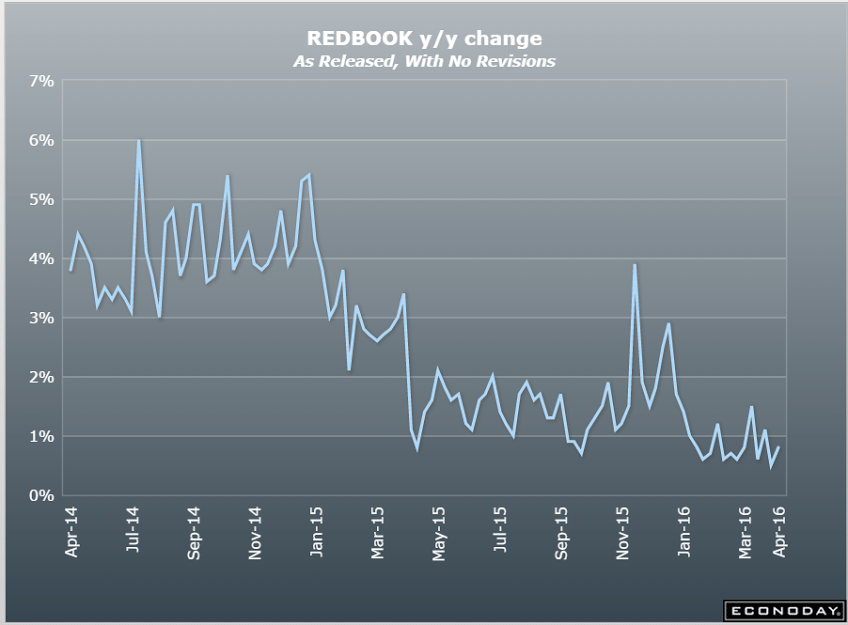
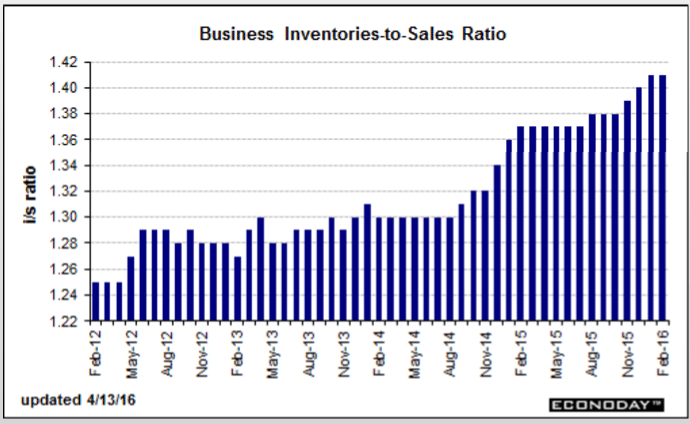
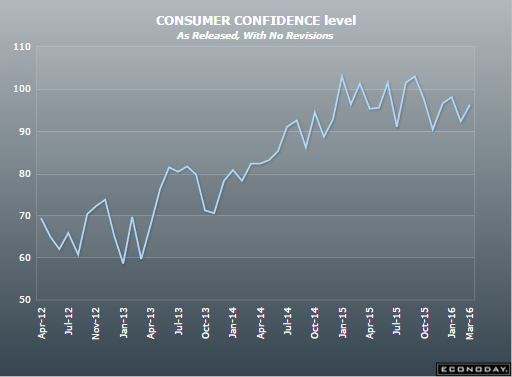
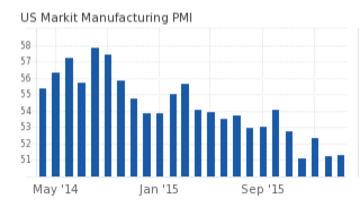
Continues to soften:
er-4-1-11

Redbook retail sales, Housing price index, Consumer confidence

At least so far, even with the easier comparisons with last year’s weak sales at this time, there’s still very little growth:
er-3-29-1
Nothing happening here:
er-3-29-2

The chart shows how it stopped rising when oil capex collapsed, and has been working its way lower ever since:

Consumer Confidence
er-3-29-3
Highlights
Lack of wage gains and the exaggerated political climate have yet to dent consumer spirits as consumer confidence is holding firm, at a solid 96.2 in March. An initial drop in February had raised concerns but less so now, not only following the gain in March but also with a 1.8 point upward revision to February to a more respectable 94.0.

A negative in the March data is the closely watched jobs-hard-to-get subcomponent which isn’t pointing to strength for Friday’s employment report, rising a very sharp 3.0 percentage points to 26.6 percent. An offset, however, is a 2.6 percentage point rise in those describing jobs as plentiful to 25.4 percent. Another offset is the consumer’s 6-month outlook on the jobs market with slightly more seeing jobs opening up and slightly fewer seeing less jobs ahead. The future income assessment is stable and favorable as are the assessments of business conditions.

Buying plans are mixed with autos down but with housing stable and appliances up. Inflation expectations are steady at 4.7 percent which is very subdued for this reading, one that won’t please Federal Reserve policy makers who are trying to pull inflation higher.

This report isn’t gangbusters but it is solid and should help take the edge off of yesterday’s disappointing data on personal spending.

er-3-29-4

Personal income and spending, Dallas Fed, Pending home sales, Atlanta Fed, Deportations

Remember the hype when spending came out at up .5 last month- hard evidence the economy was heading north? Well, it just got revised away to a recession like .1, and PCE down to only a 1% year over year increase, and no one is saying anything, with the core CPE gain down to .1 vs last month’s .3 which was deemed evidence of a return to inflation. Not mention the .1 drop in wages and salaries after all the hype about the return of ‘wage inflation’:

Personal Income and Outlays
er-3-28-1
Highlights
The outlook for the consumer has buckled, at least a bit following a surprisingly weak personal income and spending report for February. Income rose a soft 0.2 percent with wages & salaries slipping 0.1 percent. But the worst news comes from the spending part of the report, up only 0.1 percent and with January revised sharply lower, now also at 0.1 percent vs an initial jump of 0.5 percent.

And, in what will also push back chances for an April FOMC rate hike, inflation data are on the soft with the core PCE up only 0.1 percent and the year-on-year rate unchanged at 1.7 percent and no closer to the Fed’s 2 percent goal. Overall prices are down 0.1 percent with the year-on-year rate at plus 1.0 percent.

Turning back to income, the fall in wages & salaries is the first since September last year but was offset in part by a rise in disposable income that reflected gains for both income transfers and rental income. And consumers continued to put money in the back as the savings rate, in perhaps a sign of consumer defensiveness, rose 1 tenth to 5.4 percent for a 3-year high.

The downward revision to January retail sales to minus 0.4 percent from an initial plus 0.2 percent (posted at mid-month) swept January spending in this report likewise lower. Both durable goods and non-durable goods now show contractions in the month with growth in service spending pulled lower. Data for February are also soft with spending on non-durable goods down sharply on lower fuel prices and with spending on durable goods and services little changed.

GDP estimates for the first quarter will not be going up following this report and estimates for the second quarter and beyond may be coming down. The lack of wage gains, together perhaps with softness in home appreciation, may be holding back the consumer more than thought. This report points squarely at weakness, weakness for what is the core itself of the U.S. economy.

Up a bit from very depressed levels, but problematic details remain:

Dallas Fed Mfg Survey
er-3-28-2
Highlights
Weakness eased in the Dallas Fed’s manufacturing sector this month, in what is the latest positive signal for March. The general activity index jumped 18 points though is still deeply in the negative column, at minus 13.6 for the 15th straight month of contraction. But positives are expansion in production, at plus 3.3 to end two prior months of contraction, and also a gain for capacity utilization, also at plus 3.3. But order readings are in contraction though less so than prior months. Readings on employment, however, showed no improvement and remain in the negative column. Input prices show no change with selling prices still contracting. Wage pressures, however, remain firm. One special positive in the report is a gain for the outlook, at 6.1 for the first positive reading in four months. The Empire State, Philly Fed, and Richmond Fed reports are all showing strength this month, joined now by the hard-hit Dallas Fed, indications that point to a bounce-back from what was a very soft month of February for the factory sector.

Looks to me like a bit of volatility- a move down followed by a move back up- while the actual level remains far below prior cycles:

Pending Home Sales Index
er-3-28-3
Highlights
A surge in the Midwest fed a very promising and stronger-than-expected 3.5 percent rise in pending home sales for February. Pending sales in the Midwest rose 11.4 percent with monthly sales also up in the South and West. The jump in the Midwest mirrors a February jump in the West on the new home side, in what are perhaps initial signs of isolated life in what has been a dormant housing sector of late. Today’s report points to a badly needed bounce ahead for final sales of existing homes which, in previously released data for February, plunged 7.1 percent.

er-3-28-4
Down again, with more to come from accelerating liquidation of excess inventories, as ongoing oil capex cuts and related spending cuts continue as well:
er-3-28-5

Tracking Obama’s deportation numbers

By Mike Corones

Feb 25 (Reuters) — Barack Obama has called himself the “champion in chief” of immigration law reform. Latino activists, angry at his administration’s removal of illegal immigrants, have responded by calling him the deporter in chief. What do the data tell us?

“America is expelling illegal immigrants at nine times the rate of 20 years ago; nearly 2m so far under Barack Obama, easily outpacing any previous president,” the Economist wrote in February 2014. “Border patrol agents no longer just patrol the border; they scour the country for illegals to eject. The deportation machine costs more than all other areas of federal criminal law-enforcement combined.”

Redbook retail sales, FHFA house price index, Richmond Fed, PMI manufacturing

Continued recessionary type weakness:
er-3-22-1

These are relatively small changes and not quality adjusted:
er-3-22-2
Nice move up! Could just be lots of firms seeing slight improvement after a larger dip:

er-3-22-3

A bit worse than expected:

PMI Manufacturing Index Flash
er-3-22-4

Highlights
Early indications on March’s factory activity were positive in both the Empire State and Philly Fed reports, but not from the manufacturing PMI flash which, at 51.4 vs a final 51.3 in February and a February flash of 51.0, points to no significant pickup.

Respondents in the sample continue to report declining demand for energy equipment, the result of low oil prices, and subdued demand for exports, the result of weak global demand tied with the strength of the dollar. A drop in pre-production inventories is a key negative in the report, hinting at a weakening outlook for future business. Destocking is also underway for finished goods which are also on the decline. Production in this sample is near its weakest pace of the last 2-1/2 years. Another negative is a drop in selling prices, only the second of the last 3-1/2 years. On the positive side, both new orders and employment, though soft by recent standards, continue to expand.

er-3-22-5