Consumer confidence, Euro zone comments

Consumer confidence (soft data) up for the month but retail sales (hard data) continue to decelerate:

No one talking about how this reduced what would have been private sector income and net financial assets by exactly that much, as the savings on interest was not spent by the governments but instead went towards deficit reduction:

Euro zone budget savings could complicate ECB rate hikes: Bundesbank

By Balazs Koranyi

Jul 24 (Reuters) — Euro zone countries have saved nearly a trillion euros ($1.17 trillion) in debt costs since the global financial crisis and governments may now try to pressure the ECB to keep borrowing costs low, the Bundesbank said on Monday. Germany saved around 240 billion euros compared with pre-crisis levels, the Bundesbank said. “If rates on average were still at their pre-crisis levels, interest expense last year alone would have increased by nearly 2 percent of the nominal gross domestic product,” the Bundesbank said. “Since 2008, savings have totaled almost 1 trillion euros or almost 9 percent of euro area GDP.”

CPI, Retail sales, Industrial production, Hotel stats, rail week, US budget deficit, Asset price chart,Trump comments

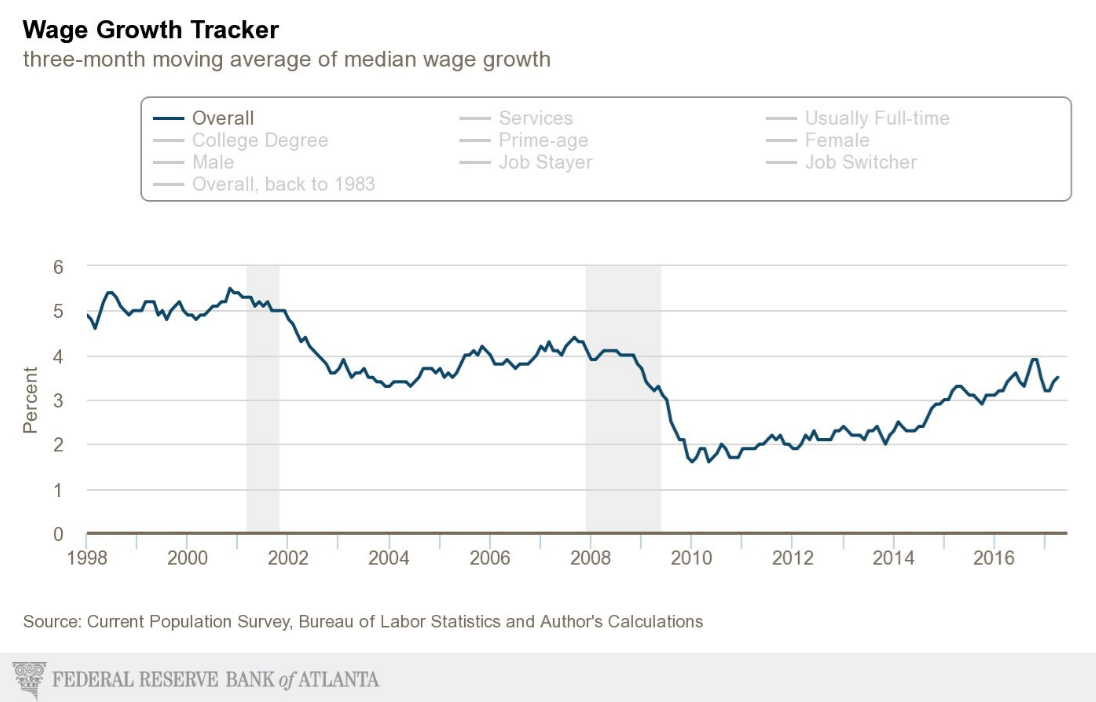
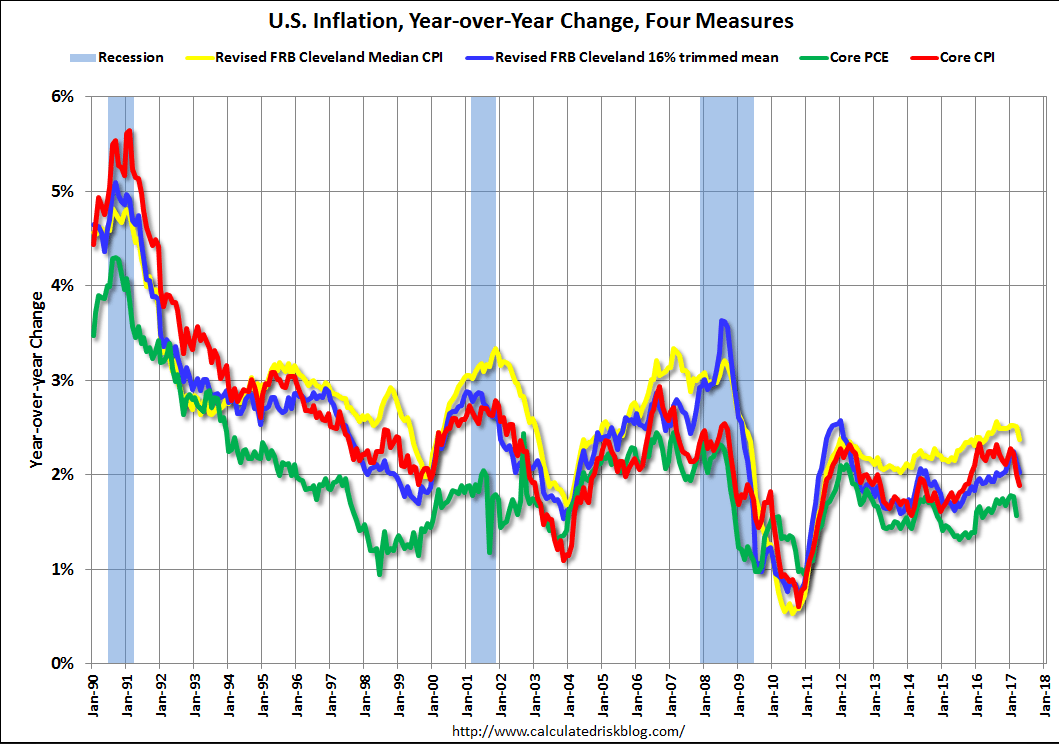
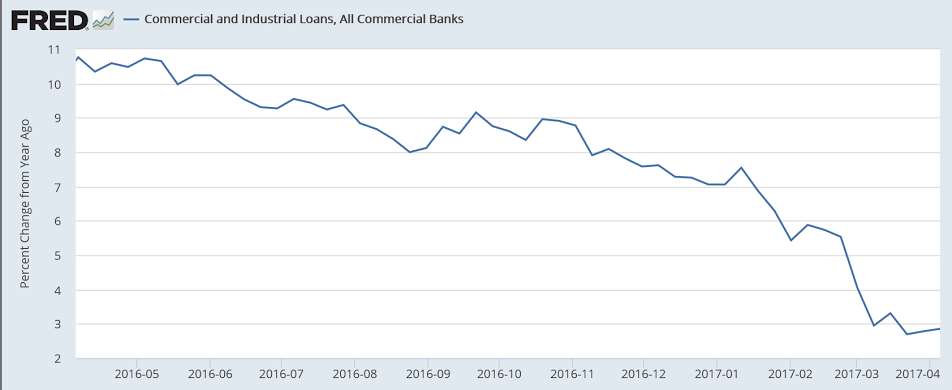
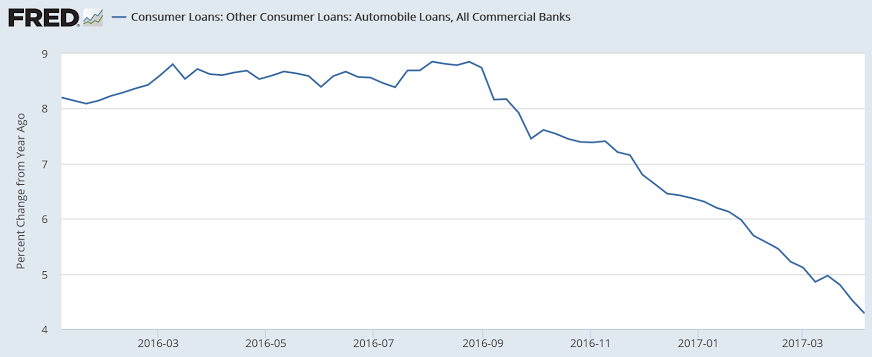
The Fed continues to fail to meet it’s target. They just need a little more time… ;)
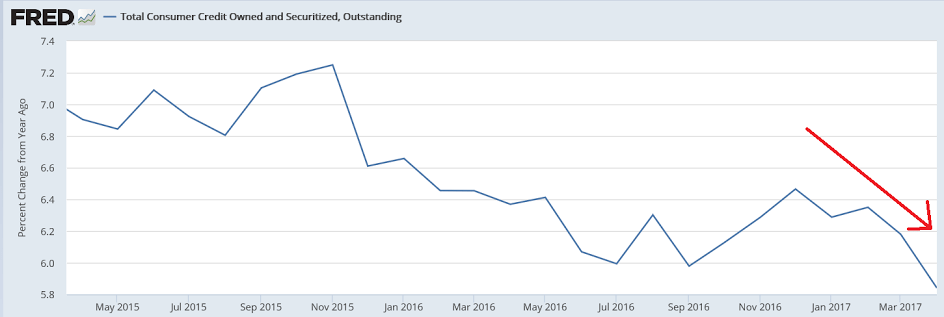
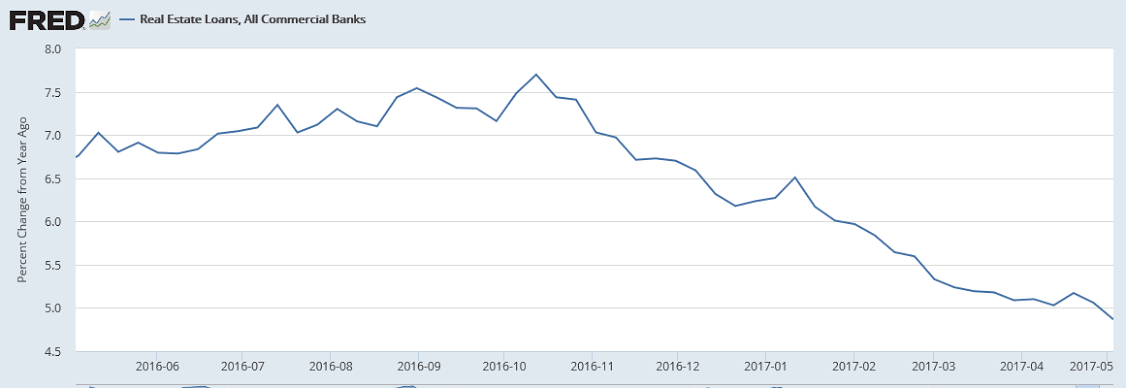
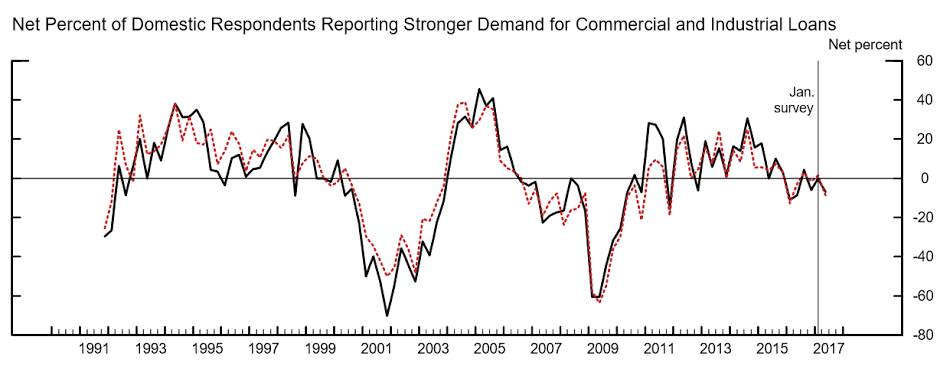
And coincidentally this is inline with the credit deceleration as previously discussed:
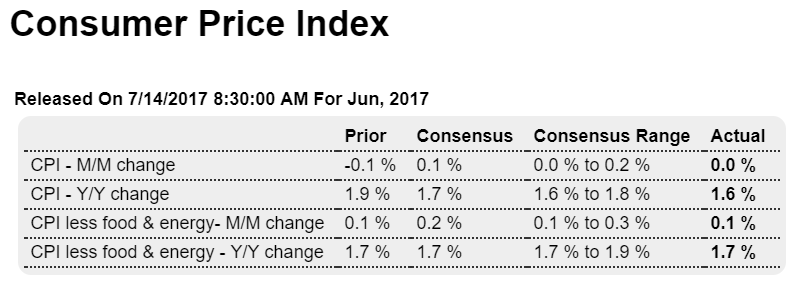
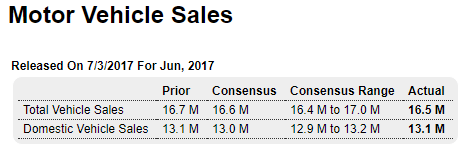
Highlights

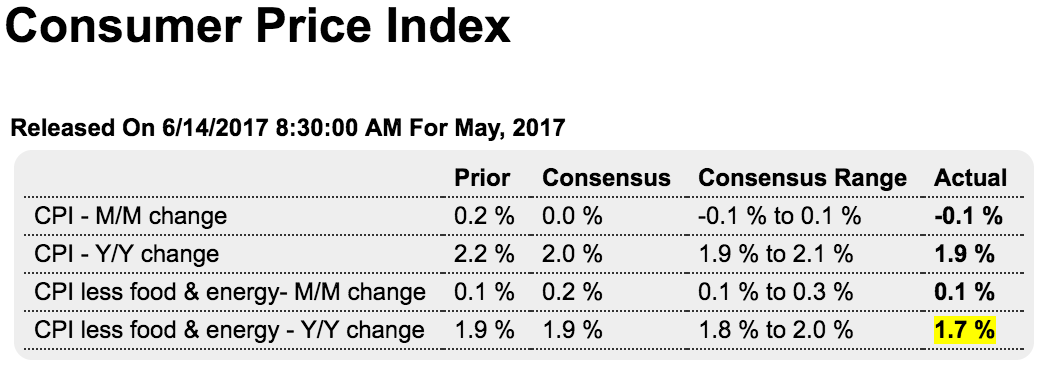
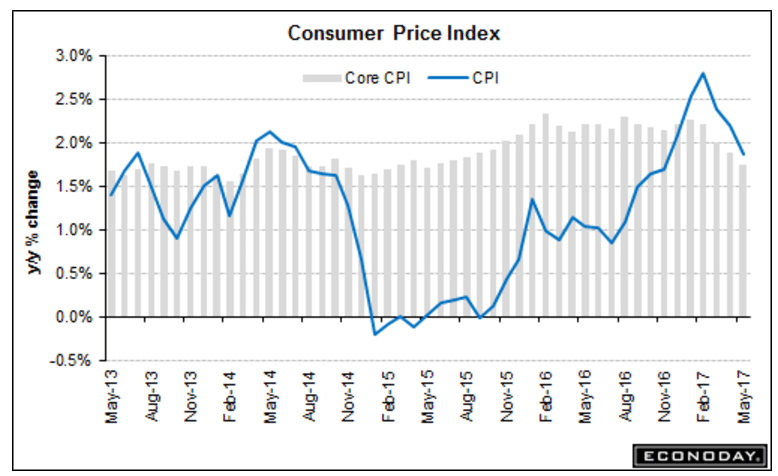
In what is one of the very weakest 4-month stretch in 60 years of records, core consumer prices could manage only a 0.1 percent increase in June. This is the third straight 0.1 percent showing for the core (ex food & energy) that was preceded by the very rare 0.1 percent decline in March. Total prices were unchanged in the month with food neutral and energy down 1.6 percent.

Housing, which is a central category, continues to moderate, also coming in at 0.1 percent following a 0.2 percent gain in May. Apparel is down for a fourth month in a row with transportation, reflecting falling vehicle prices, down for a second month. Medical care, which had been moderating, picked up with a 0.4 percent gain while prescription drugs which Janet Yellen has been citing for special weakness, bounced back with a 1.0 percent gain. However wireless telephone services, another area cited by Yellen for weakness, posted another sizable decline, down 0.8 percent in June.

Year-on-year, the core is steady at 1.7 percent with total prices, which fluctuate much more than the core, down 3 tenths to 1.6 percent. The Fed may be blaming this stretch of weakness on special factors, but that argument is losing force.

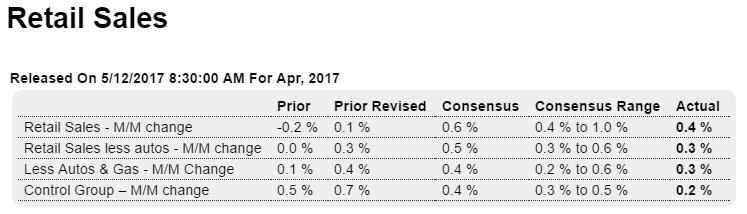
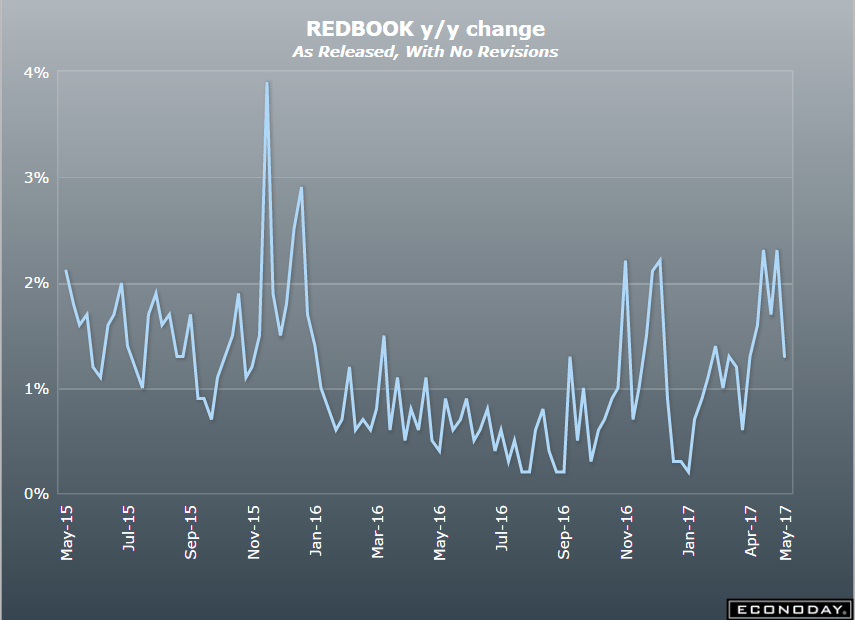
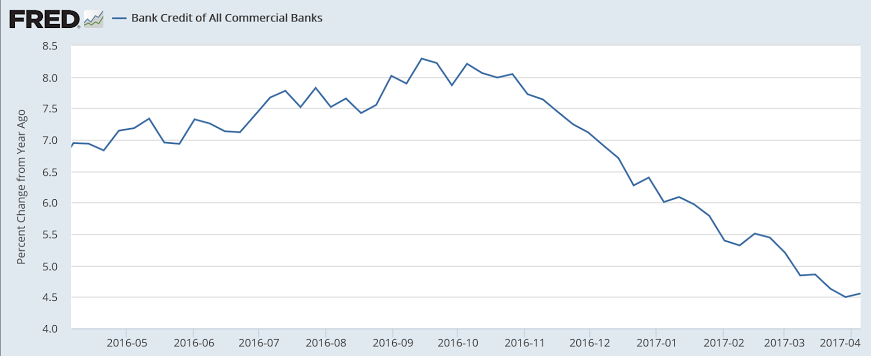
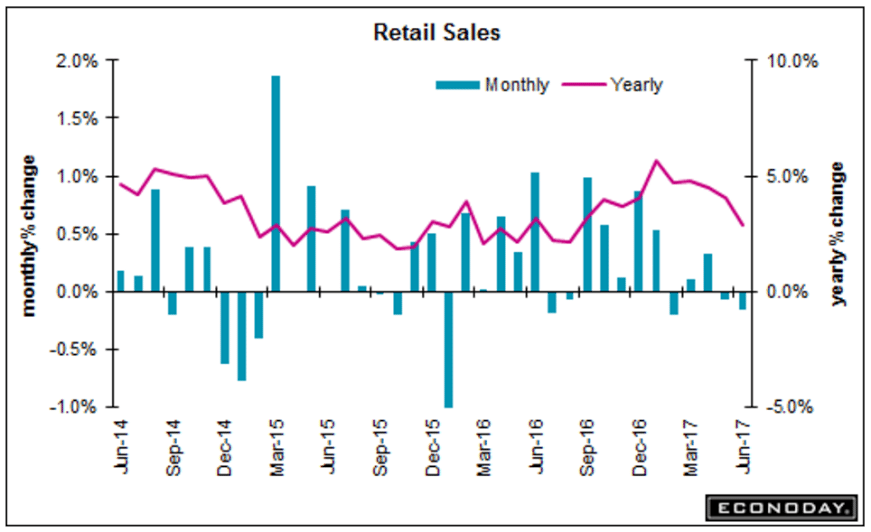
Also decelerating in line with decelerating credit aggregates:
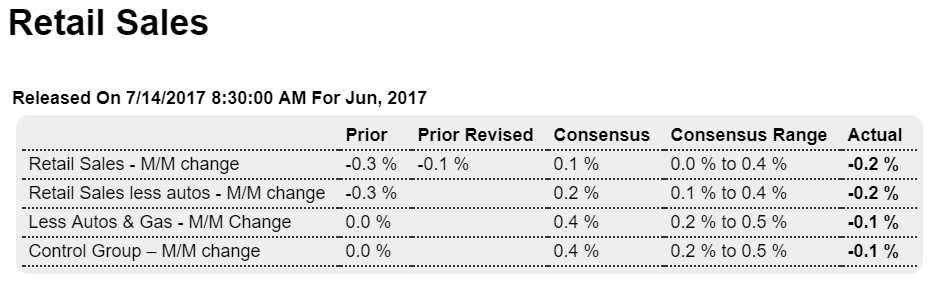
Highlights

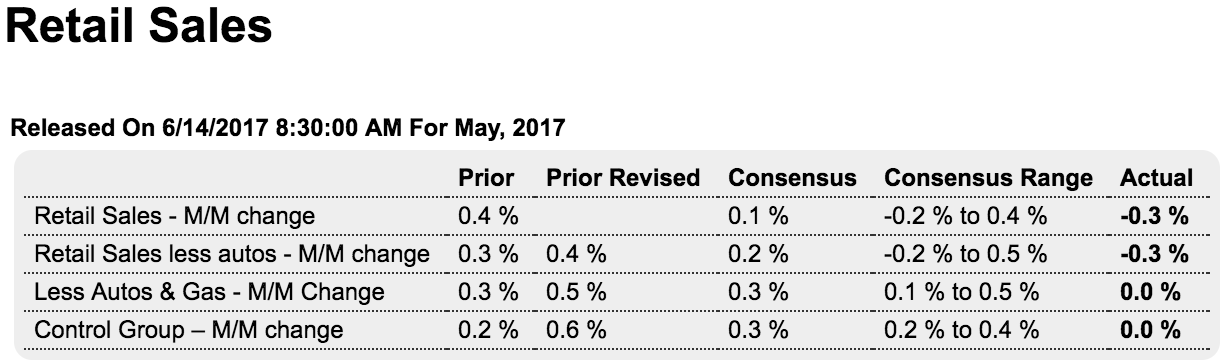
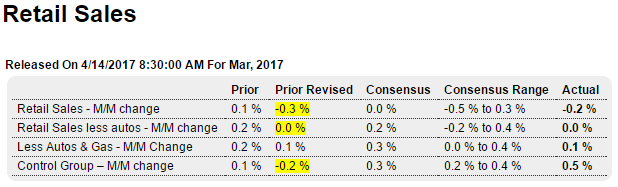
Consumer spending in second-quarter GDP will not be getting a lift from the retail component as retail sales fell an unexpected 0.2 percent in June. This follows a revised 0.1 percent decline in May and a revised 0.3 percent gain for April which proved to be the quarter’s only respectable showing.

Readings show wide weakness with vehicle sales coming in with a marginal 0.1 percent increase, the same for furniture and also electronics & appliances. Declines include food & beverage stores, down a sharp 0.4 percent, and department stores down 0.7 percent following the prior month’s 0.8 percent plunge. Restaurants are also weak, down 0.6 percent for the third decline in four months. Gasoline sales fell 1.3 percent reflecting price weakness. Nonstore retailers, which include e-commerce, are a positive in the report with a 0.4 percent gain as are building materials rising 0.5 percent gain.

But there really aren’t very many positives in today’s report, one that points to a surprising lack of consumer spirit and one that will not be raising estimates for second-quarter GDP.

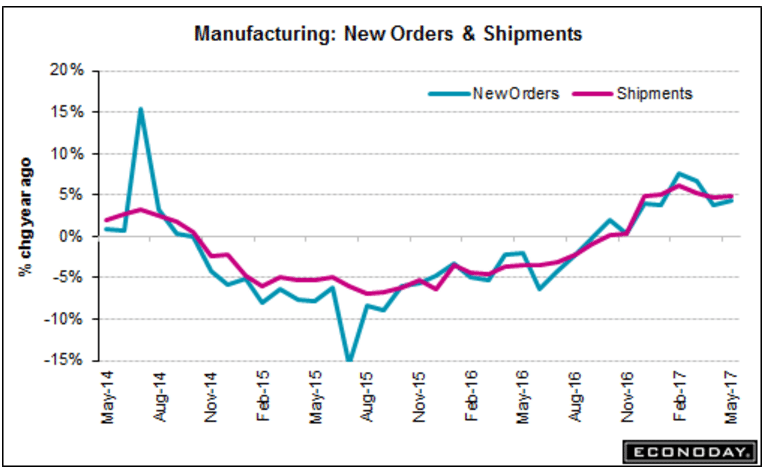
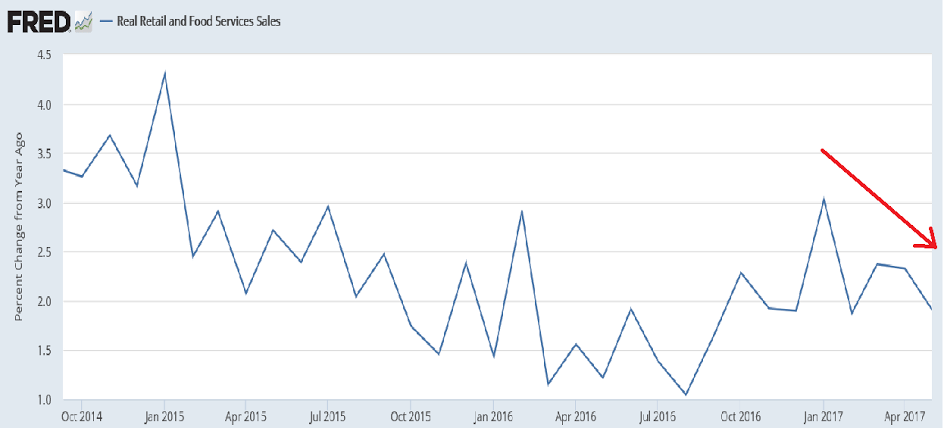
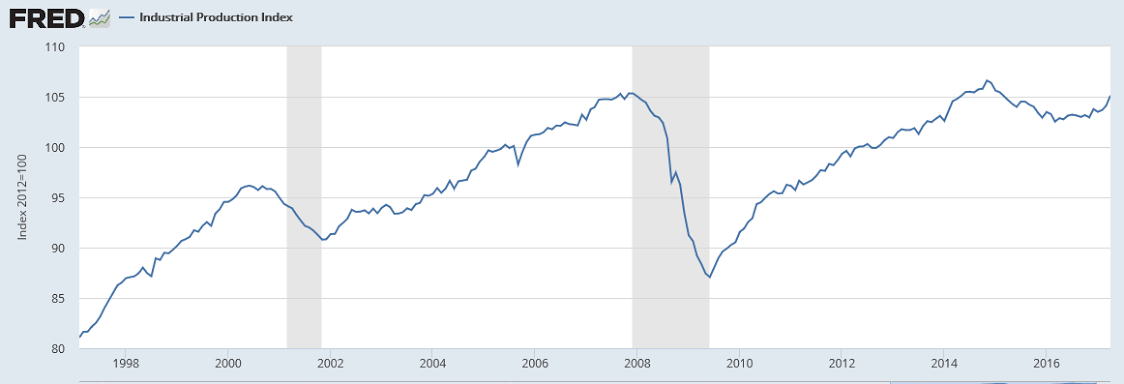
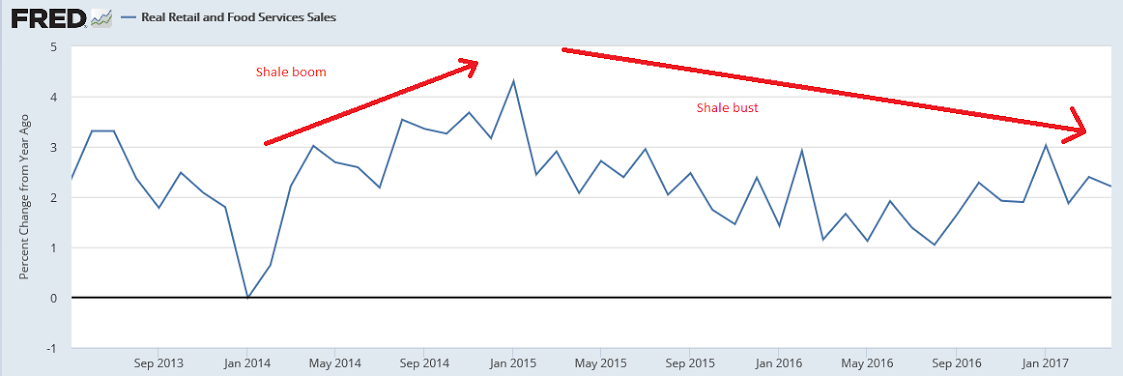
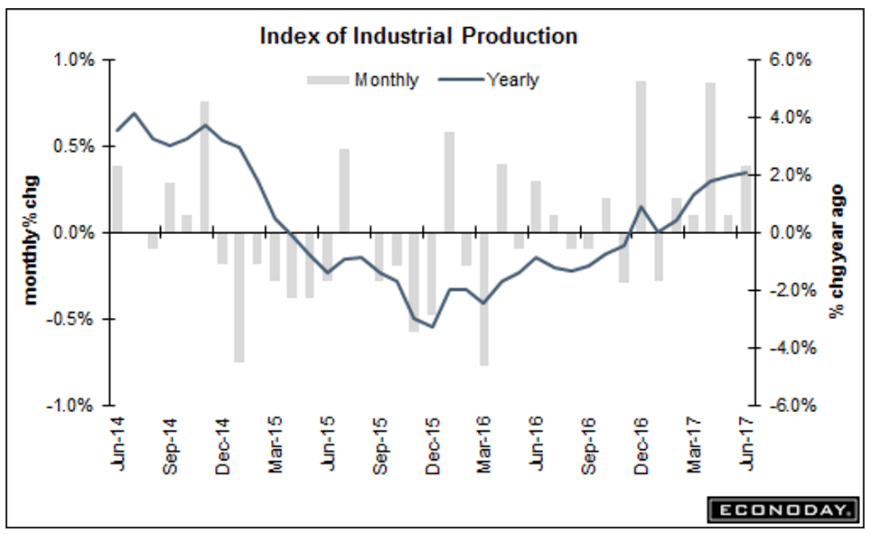
Annual growth chugging along at a modest 2%, leveling off after the setback from the oil capex collapse, as per the chart:
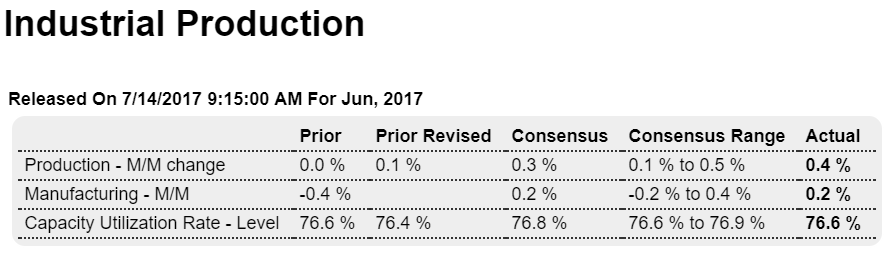
Highlights

Mining is once again the highlight of an otherwise soft industrial production report. Gaining 1.6 percent for a third straight sharp increase, mining pulled industrial production up 0.4 percent in June as utilities posted no change and manufacturing managed an as-expected 0.2 percent gain.

Manufacturing makes up the vast bulk of the industrial sector and a breakdown does show strength with vehicles up 0.7 percent and selected hi-tech up 0.8 percent. But both consumer goods and business equipment came in flat with construction supplies down slightly.

The gain for manufacturing follows May’s 0.4 percent decline with a 1.0 percent surge in April nearly offset by March’s 0.8 percent plunge. The factory sector is moving forward, just not very fast. Today’s report is the first definitive factory data for June; watch next week for the first tentative data on May with Empire State on Monday and Philly Fed on Thursday. Note that traditional non-NAICS numbers for industrial production may differ marginally from NAICS basis figures.

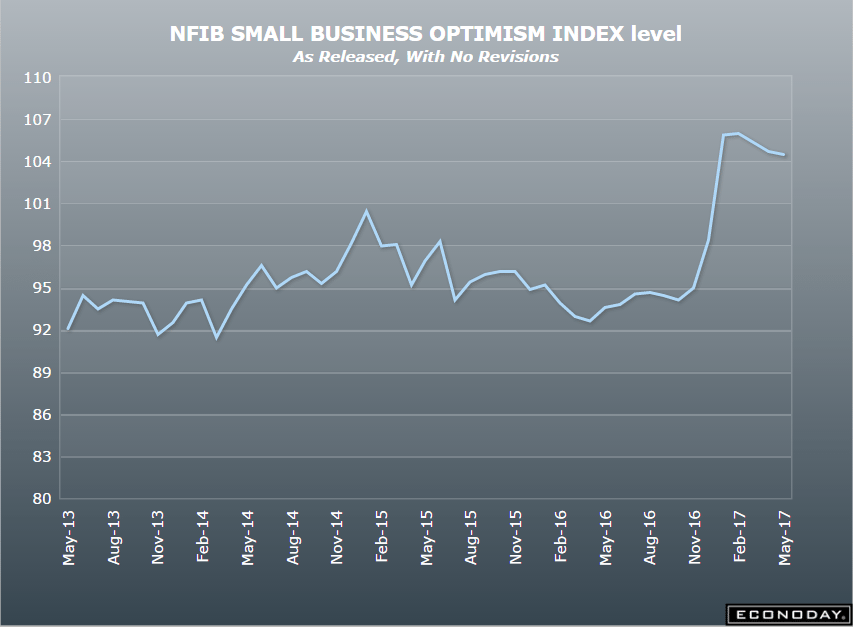
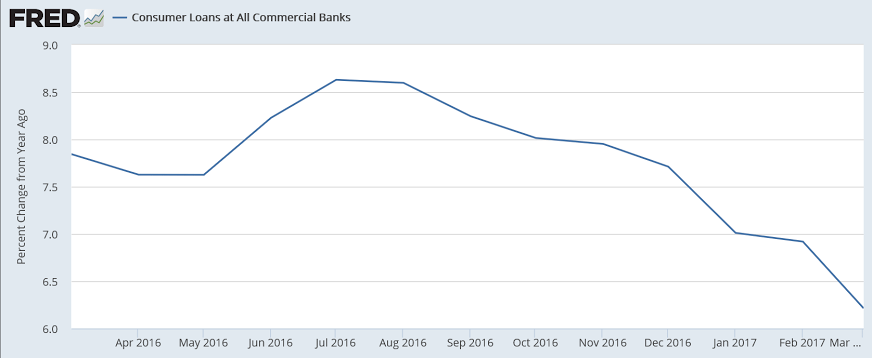
Trumped up expectations have now all but reversed, also in line with the deceleration of consumer lending:
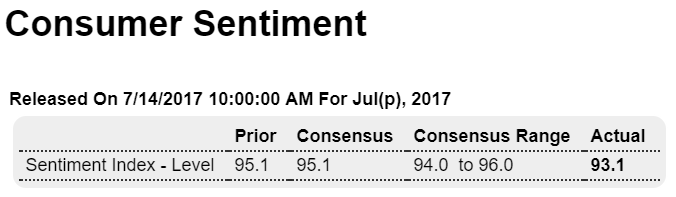
Highlights

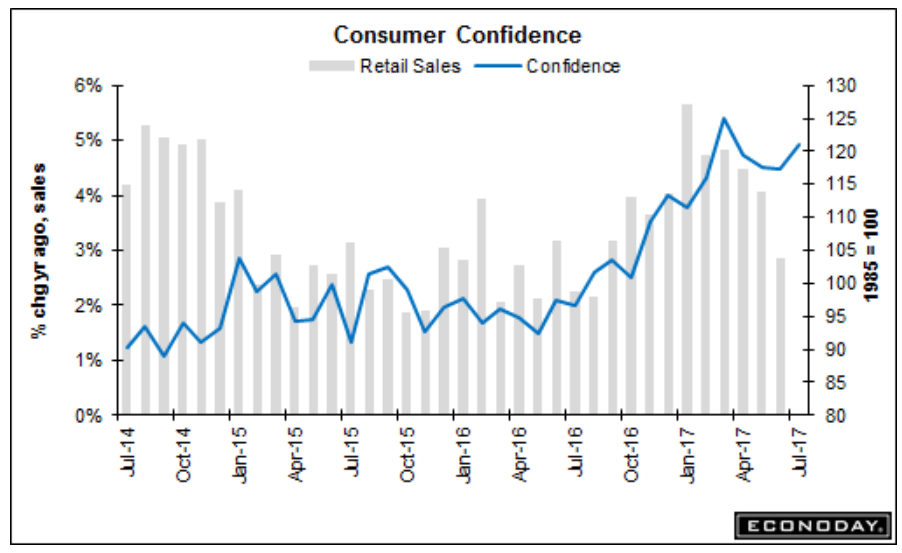
Economic expectations are falling while current conditions remain high, a combination that the consumer sentiment report warns points to economic slowing ahead. The consumer sentiment index fell a sharp 2 points in the preliminary results for July to a much lower-than-expected 93.1.

The expectations component is down nearly 4 points to 80.2 for its lowest reading since before the election, in October last year. Republican expectations have been falling sharply from steep highs, down to 108.9 for a more than 7 point decline from June. Democrat expectations are actually improving slightly but remain very low at 63.2.

Current conditions rose slightly in the month to 113.2 which is a positive indication for this month’s consumer activity. But it’s future activity that may be in trouble. Inflation expectations edged higher in the month but remain very low at 2.7 percent for the 1-year outlook and 2.6 percent for the 5-year.

The drop in this index together with the drop in this morning’s retail sales report are new and imposing negatives for the consumer outlook.

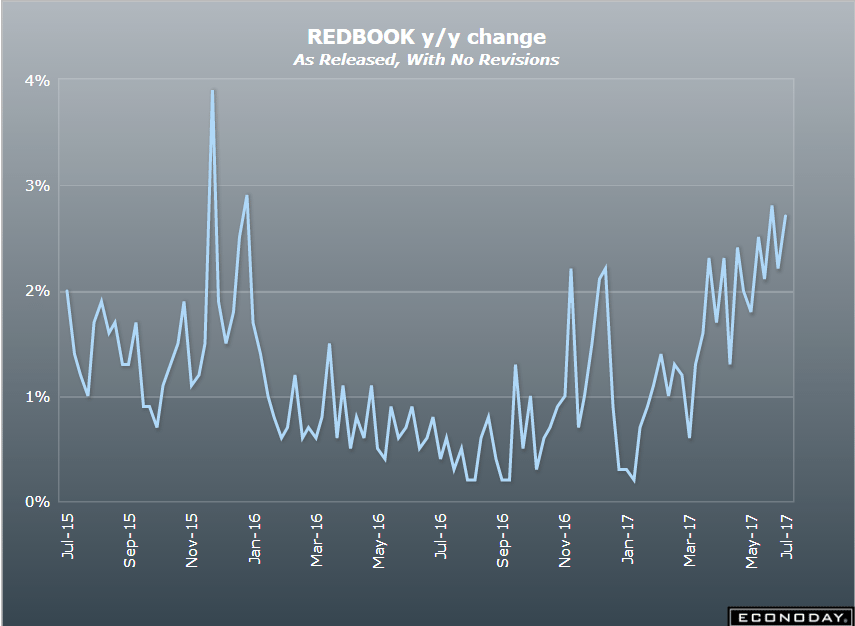
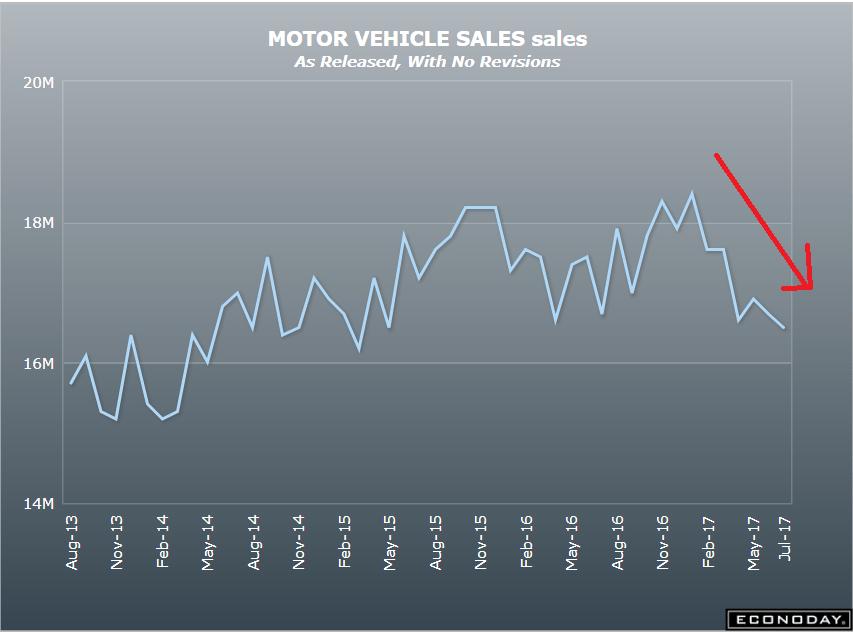
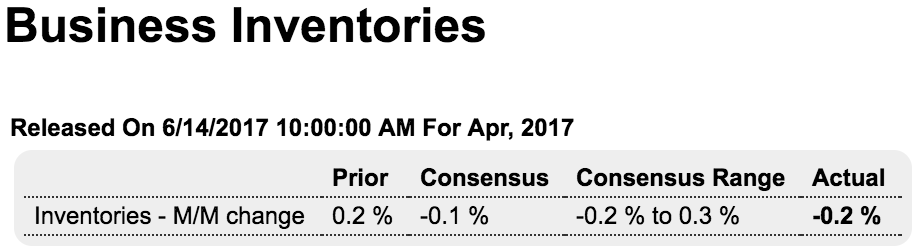
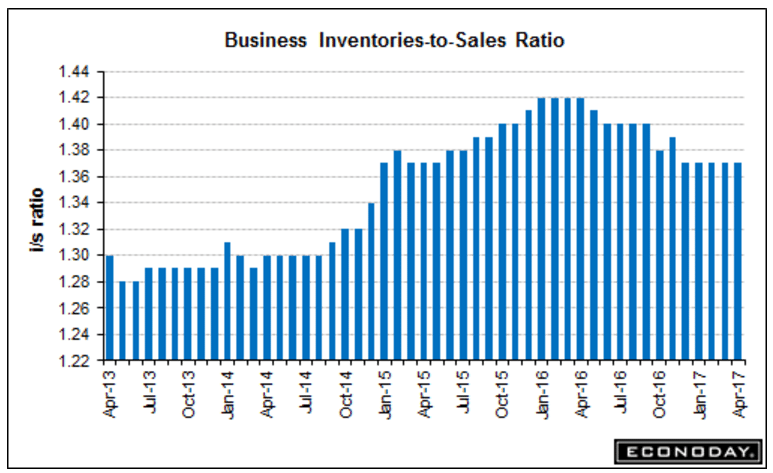
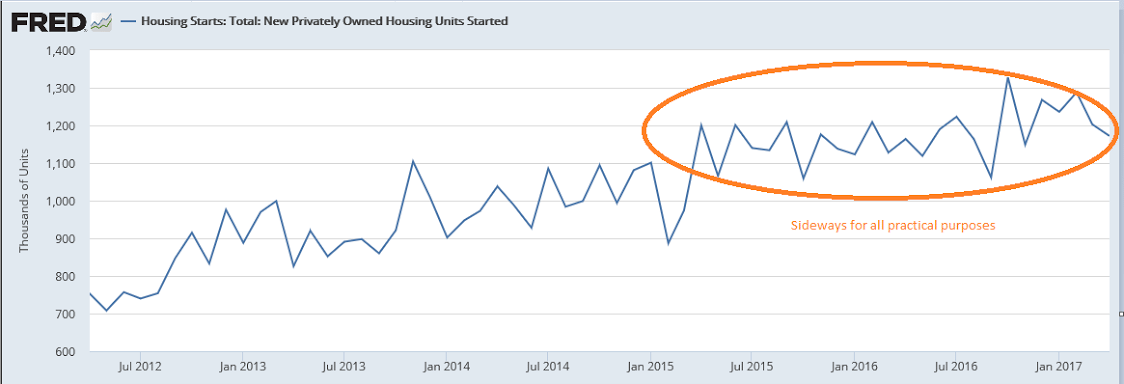
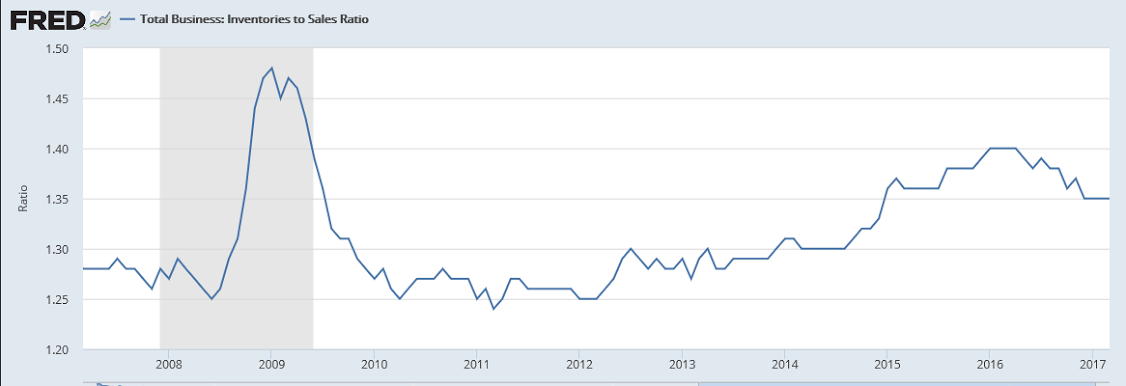
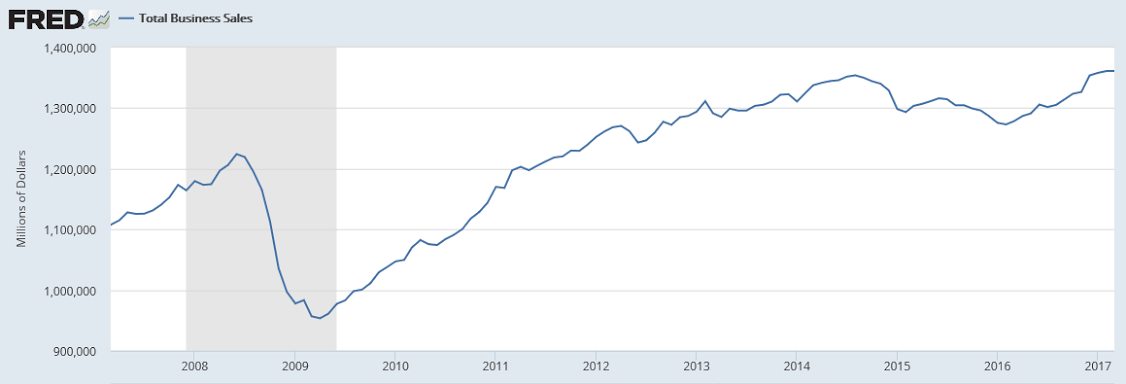
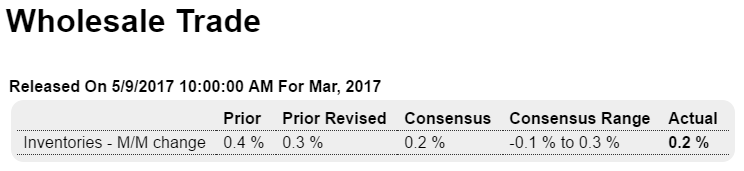
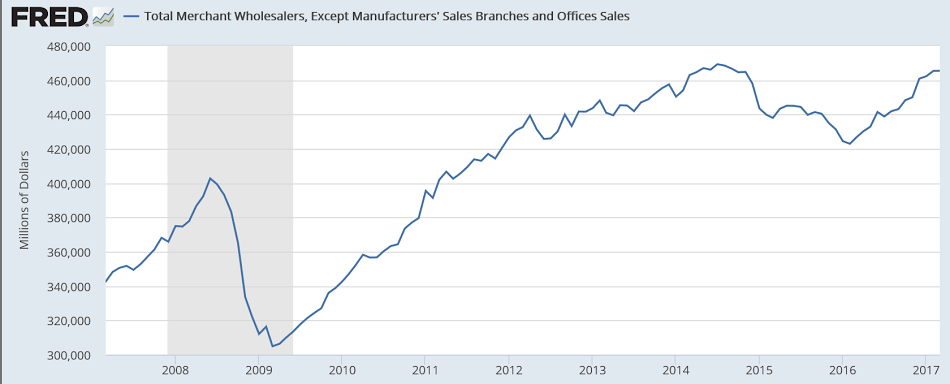
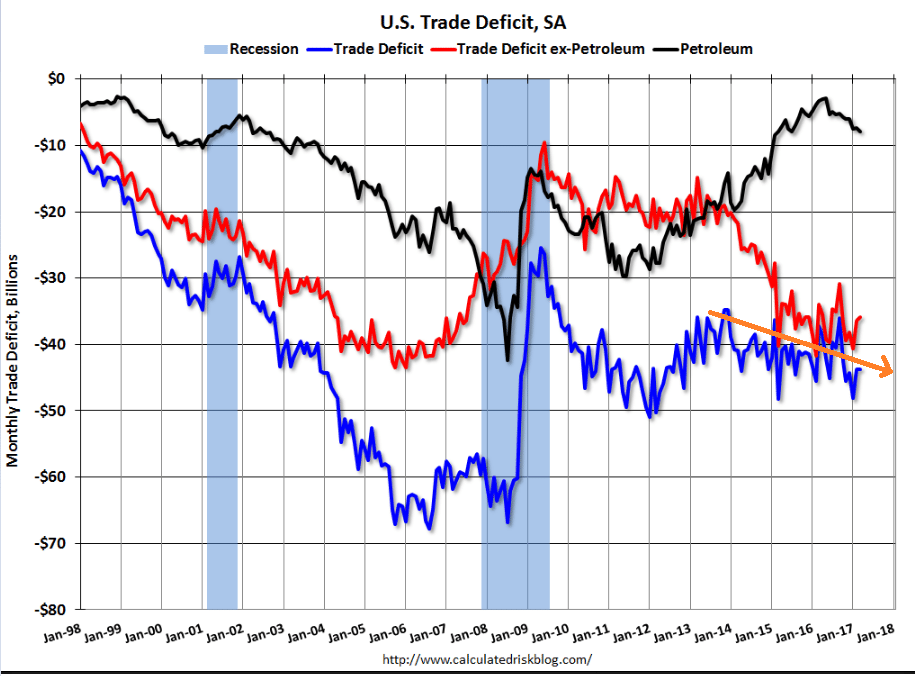
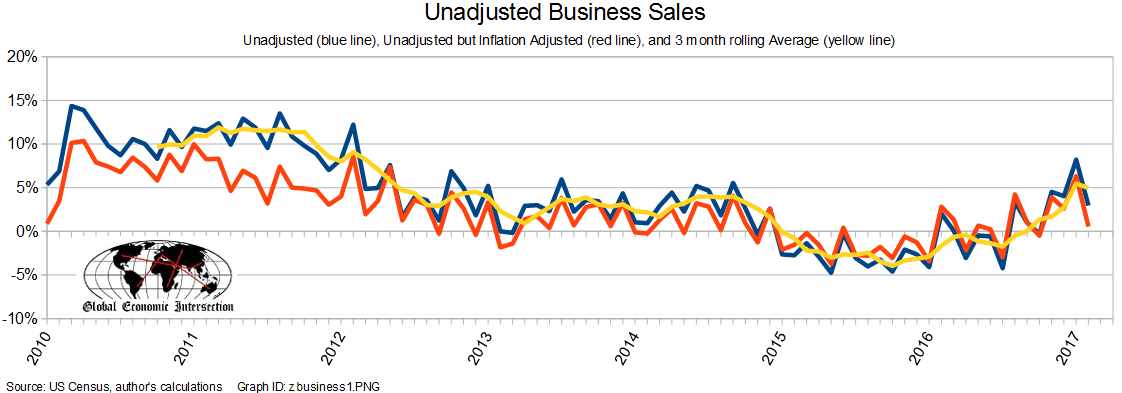
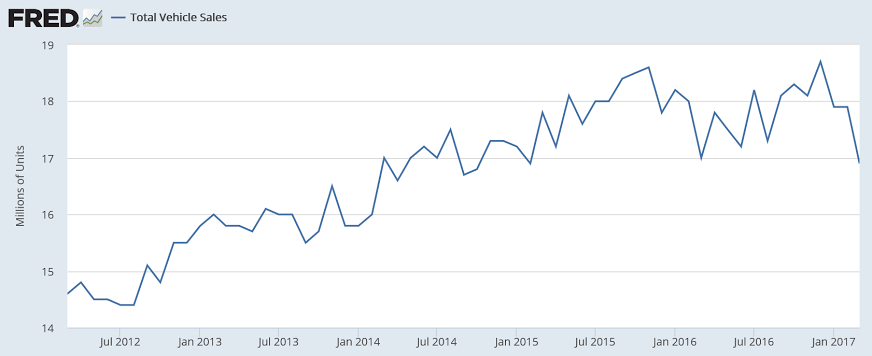
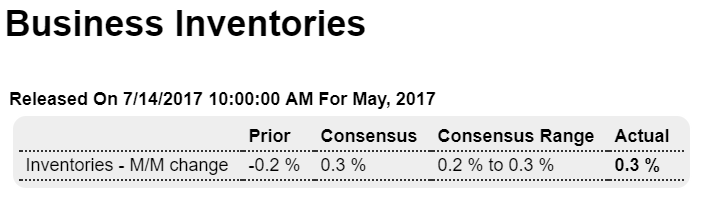
Consequence of falling sales:

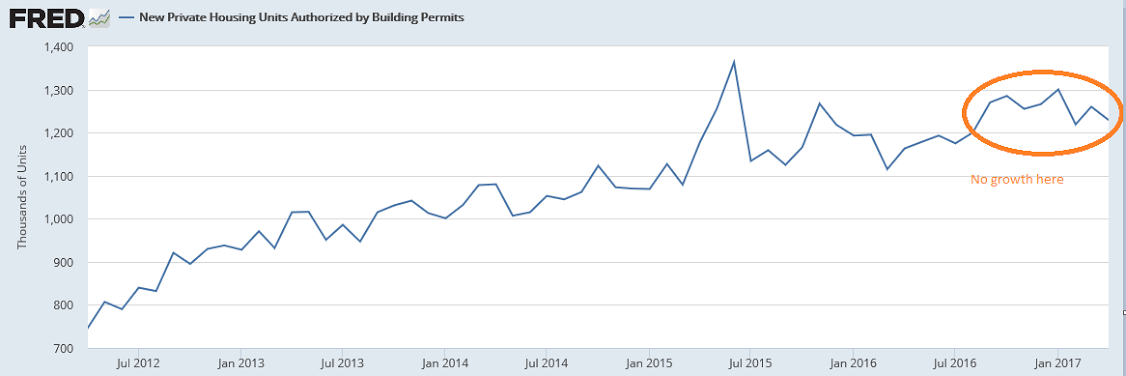
No growth of consequence from last year:

From HotelNewsNow.com: STR: US hotel results for week ending 8 July

The U.S. hotel industry reported mixed year-over-year results in the three key performance metrics during the week of 2-8 July 2017, according to data from STR.

In comparison with the week of 3-9 July 2016, the industry recorded the following:

• Occupancy: -3.0% to 65.3%
• Average daily rate (ADR): +1.1% to US$122.73
• Revenue per available room (RevPAR): -2.0% to US$80.11
Read more at http://www.calculatedriskblog.com/#biuKy43OQFvtIM6K.99

Rail Week Ending 08 July 2017: Slowing Continues

Week 27 of 2017 shows same week total rail traffic (from same week one year ago) improved according to the Association of American Railroads (AAR) traffic data. The economically intuitive sectors slowing continues.

Receipts lower than expected due to income slowdowns:

United States Government Budget

The US government posted a USD 90 billion budget deficit in June 2017, larger than market expectations of a USD 35 billion gap and compared with a USD 6 billion surplus in the same month of the previous year. Outlays jumped 33 percent to USD 429 billion while receipts increased at a much slower 3 percent to USD 339 billion.

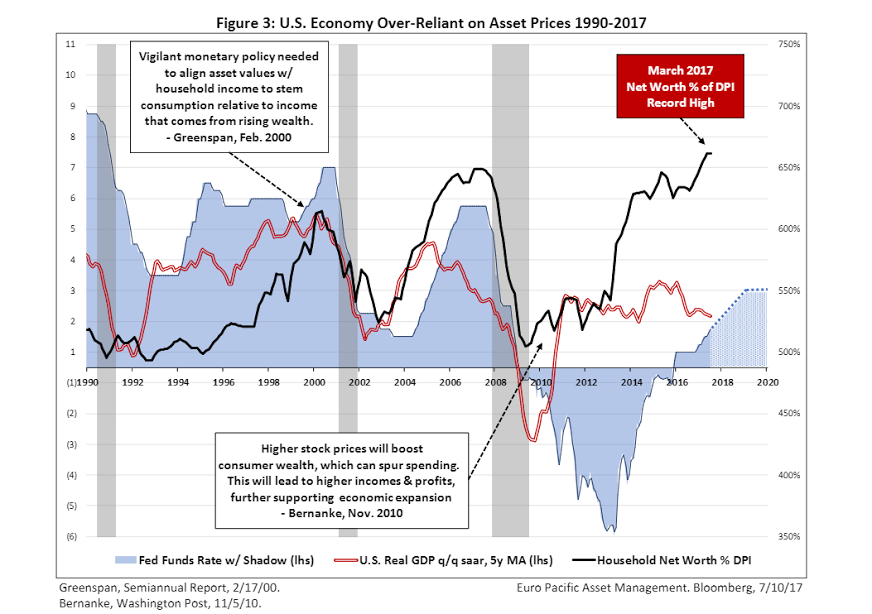
Asset prices as a % of real disposable income:

Question: You were joking about solar, right?

Trump: No, not joking, no. There is a chance that we can do a solar wall. We have major companies looking at that. Look, there’s no better place for solar than the Mexico border — the southern border. And there is a very good chance we can do a solar wall, which would actually look good. But there is a very good chance we could do a solar wall.

One of the things with the wall is you need transparency. You have to be able to see through it. In other words, if you can’t see through that wall — so it could be a steel wall with openings, but you have to have openings because you have to see what’s on the other side of the wall.

And I’ll give you an example. As horrible as it sounds, when they throw the large sacks of drugs over, and if you have people on the other side of the wall, you don’t see them — they hit you on the head with 60 pounds of stuff? It’s over. As cray as that sounds, you need transparency through that wall. But we have some incredible designs.

Factory orders, Small business hires, Redbook retail sales

Weaker q2 vs q1, and muddling along at about 3% year over year as previously discussed:

Highlights

Forecasters thought factory orders would get a lift from nondurables but they didn’t as total orders fell 0.8 percent in May vs Econoday’s consensus for minus 0.5 percent. Nondurable orders, held down by weakness in petroleum and coal, also fell 0.8 percent as did durable orders where last week’s advance data showed a 1.1 percent decline.

But there are positives in today’s report and they include a small lift for core capital goods orders (nondefense ex-aircraft) which, boosted by a jump in mining equipment, rose 0.2 percent vs last week’s initial estimate for a 0.2 percent decline. A small plus is a 1 tenth upward revision to April which is now at plus 0.3 percent. Shipments for core capital goods, which are inputs into second-quarter business investment, are similarly revised upward, now at plus 0.1 percent and 0.2 percent in May and April.

Weakness in the report includes aircraft orders with both commercial and defense falling in the double digits in the month. Orders for motor vehicle & parts rose a very solid 1.2 percent though consumer goods fell 0.2 percent.

But manufacturing activity, as described in last week’s PMI manufacturing report, is no better than subdued as total shipments rose only 0.1 percent following no change and minus 0.2 percent in the two prior months. A clear negative is a 0.2 percent decline in unfilled orders. Inventories fell 0.1 percent following no change in April, keeping inventories-to-shipments steady at a lean 1.38 ratio that points, however, to a defensive outlook that won’t be helping second-quarter GDP.

There are bright spots in this report which overall, however, is consistent with a sector that is struggling to find momentum.

Also in line with weak demand

Small business hires dropped in June, but employees saw wages rise, Paychex survey shows

  • Small business hiring fell in June, but wages continued to increase, Paychex says.
  • The Small Business Jobs Index is at its lowest level since late 2011.
  • “The decline in this month’s index and modest growth in wages seem to reflect an unclear regulatory picture combined with a narrowing labor market,” Paychex President and CEO Martin Mucci says.
  • Definitely looking up some, though probably a lot fewer of these types of retailers now:

    Highlights

    Same store sales were up 2.7 percent year-on-year in the July 1 week, picking up the pace by 0.5 percentage points from the previous week to a tick below the strongest growth since January 2016 posted two weeks ago. Month-to-date same store sales versus the prior month also strengthened and were up 0.7 percent, an 0.1 percentage point improvement from the prior week. Full month year-on-year same store sales were up 2.5 percent, back up to the strongest pace in at least year also seen in the June 3 and June 17 weeks. The week’s survey results put a strong finish on a very good month for retailers in Redbook’s sample, who are reporting the best sales performance comparisons in 17 months after faltering sales in May, and suggest strong ex-auto less gas retail sales for the month.

    Motor vehicle sales, Holiday spending

    Also decelerating in line with deceleration of bank auto lending. One by one the data releases seem to be confirming the last 6 month’s rapid deceleration of bank lending:

    Highlights

    The consumer remains disengaged based on vehicle sales where weakness extended into June, at a 16.5 million annualized rate vs what were modest expectations for 16.6 million and against 16.7 million in May. North American-made sales edged up to 13.1 million from 13.0 million though the gain is due more to rounding than improvement, at 13.05 vs 13.03 million out to two decimals. These results do not point to strength for what has been a very weak autos component of the retail sales report.

    Good news here! ;)
    Happy 4th!

    WASHINGTON – Americans are expected to spend $7.1 billion on food for cookouts and picnics as they celebrate the Fourth of July this year, up from $6.8 billion in 2016, according to the annual survey released today by the National Retail Federation and conducted by Prosper Insight & Analytics.

    According to the survey, 219 million Americans plan to celebrate the holiday, or 88 percent of those surveyed. A total of 162 million — 66 percent of those surveyed — plan to take part in a cookout or picnic, spending an average $73.42 per person, up from last year’s $71.34. The numbers cover only food items, not other holiday-related spending.

    Retail sales, CPI, business inventories

    Highlights

    Consumer spending was unusually weak in the first quarter and doesn’t look to be improving this quarter. Retail sales fell 0.3 percent in May vs Econoday’s consensus for a 0.1 percent gain. Weakness riddles the report including a 1.0 percent drop for department stores, a 0.2 percent decline for autos, and a 0.1 percent dip for restaurants. Two readings that echo price contraction in this morning’s consumer price report are gasoline stations, down 2.4 percent, and electronics & appliances stores, down 2.8 percent as phone prices continue to come down.

    Other readings are likewise very weak, at minus 0.3 percent excluding autos and no change when excluding both autos and gasoline. Control group sales are also unchanged (this excludes autos, building materials, gasoline and restaurants).

    Wages aren’t showing any traction and neither is consumer spending. The consumer just hasn’t been participating this year and will need to accelerate very quickly otherwise second-quarter GDP is in jeopardy. Yet expectations seem fixed that the Fed, despite consumer weakness and despite inflation weakness, is determined to raise rates at today’s FOMC.

    The drop since November concerns me as that’s when all the credit aggregates picked up their pace of deceleration, including consumer credit:

    Since November, this has turned south as well:

    Inventory and sales both dropping, not good:

    Highlights

    The news on the second quarter continues to darken as business inventories fell 0.2 percent in April which is 1 tenth below Econoday’s consensus. Inventories at retailers also fell 0.2 percent with wholesale inventories down a very sharp 0.5 percent. Factory inventories were positive but only barely, at 0.1 percent. Declining inventories are a possible signal of business caution and a certain negative for second-quarter GDP.

    Housing starts, Industrial production, Fed wage tracker

    No surprise here, after seeing what mortgage lending has been doing:

    Highlights

    A topping out from lower-than-indicated expansion highs is the news from the April housing starts report where levels, though still healthy, are disappointing. Starts fell 2.6 percent to a 1.172 million annualized rate that is well below Econoday’s low estimate for 1.215 million. Downward revisions are a factor in the report, totaling 27,000 in the prior two months.

    The strength in the report is in the key single-family component with starts up 0.4 percent to a rate of 835,000. Otherwise, however, the report is filled with minus signs. Permits for single-family homes fell 4.5 percent to a 789,000 rate with completions also down 4.5 percent, to 784,000.

    The sharpest weakness comes from multi-family homes where starts fell 9.2 percent to a 337,000 rate. Permits did rise 1.4 percent to 440,000 but completions dropped 17.2 percent to a 322,000 rate.

    April was supposed to be a rebound month for the economy. It was for the jobs report but bounces in last week’s retail sales and consumer price reports were minimal with today’s report an outright negative for the second quarter. Still most housing data, especially sales, have been showing significant strength going into the spring sales season.

    As previously discussed, industrial production is muddling through at modest levels with weakness spreading to the service sector. These numbers are not inflation adjusted, which means industrial production hasn’t even gotten back to the highs of the prior cycle:

    Stalled at lows of prior cycle:

    Retail sales, Business inventories and sales, Inflation

    A bit weaker than expected, prior month revisions about a wash.

    Highlights

    Retail sales did recover in April but not as much as expected, up 0.4 percent overall and up 0.3 percent excluding autos which both miss Econoday’s consensus estimates by 2 tenths. Core readings are likewise soft, up 0.3 percent ex-auto ex-gas which misses the consensus by 1 tenth and up only 0.2 percent for the control group where a 0.4 percent gain was the call.

    Vehicle sales rose 0.7 percent in April following three straight sizable declines. Nonstore retailers continue to outperform with electronics & appliances showing a second strong gain. But showing a third month of weakness and hinting at lack of demand for basic goods is the general merchandise category where the department store subcomponent, in an echo of company news out of the sector, shows only marginal strength.

    Revisions are helpful but again but by much. The overall rate for March is revised 3 tenths higher to plus 0.1 percent but February, at minus 0.2 percent, is unrevised. The upward revision for March will be a modest plus for first-quarter GDP where the first estimate on consumer spending came in barely positive and at an expansion low.

    Consumer confidence may be through the roof but retail sales, and consumer spending in general, have been stuck on the ground. Despite a very easy comparison against a very weak first quarter, second quarter consumer spending is off to no better than a moderate start.

    This is not population adjusted:

    Business inventories remain elevated:

    Business Inventories rise 0.2% in March, above economist’s expectations of a 0.1% gain. Inventories in February were revised lower to a 0.2% rise from the prior estimate of a 0.3% gain. Business sales were flat in March. The inventory-to-sales ratio, an indication of demand, remained steady at 1.35 in March. Inventories were a drag on first quarter growth, subtracting almost 1%.

    Business sales have flattened, and this chart is not adjusted for inflation:

    Today’s cpi report took all the indicators down a bit:

    NFIB index, Redbook retail sales, Jolts, Wholesale trade, MMT Article, NY Fed Consumer expectations

    Trumped up expectations fading only slowly, as confirmed by stocks, etc:

    A glimmer of hope seems to have faded:

    Highlights
    There’s plenty of help-wanted signs but still too few qualified applicants. Job openings in March totaled 5.743 million, up from a revised 5.682 million in February and well ahead of hirings which totaled 5.260 million.

    Professional & business services, where employers often turn to first when they can’t fill staff themselves, shows a strong rise in openings, to 1.1 million for a 26,000 gain. But hirings for this component are down, 55,000 lower to 989,000 and pointing perhaps to hiring delays but also to lack of strong candidates. Manufacturing shows a 30,000 monthly rise to 394,000 openings with hirings up 26,000 to 322,000. Government also shows a strong gain for openings, up 33,000 to 537,000 and led by state & local education.

    This report is consistent with tight conditions in the labor market and hints at the risk, at least for skilled workers, of wage inflation ahead.

    This chart still looks to me like it’s rolling over:

    Highlights

    Wholesale inventories came in at a consensus 0.2 percent increase led by a sharp build in autos, excluding which March inventories were unchanged. Sales in the wholesale sector were unchanged in the month though the mismatch with the inventory build does not lift the stock-to-sales ratio which holds at a healthy 1.28. These results will not upset expectations for an incremental 0.1 percent rise in Friday’s business inventories report. Inventories have been moving higher gradually, largely in line with underlying demand.

    Looks like there’s already been a recession, and not coming back, but note that it’s also looking like it may have rolled over before reaching the prior highs, and this is not adjusted for inflation:

    MMT going mainstream?

    The Rock-Star Appeal of Modern Monetary Theory

    Factory orders, Trade, Chain store sales

    Highlights

    Factory orders, like much of the economy, fizzled in March, up only 0.2 percent and skewed higher for a third month in a row by aircraft. The split between the report’s two main components shows a 0.5 percent dip for nondurable goods — the new data in today’s report where weakness is tied to petroleum and coal — and a 0.9 percent rise for durable orders which is 2 tenths higher than last week’s advance report for this component.

    The gain for durables looks impressive but when excluding transportation equipment (which is where aircraft is tracked) orders fell 0.3 percent. But core capital goods orders are a plus in the report, rising 0.5 percent (nondefense ex-aircraft) though the gain follows marginal increases of 0.1 and 0.2 percent in the prior two months.

    Unfilled factory orders, which had been in long contraction, are a clear plus, up 0.3 percent following February’s 0.1 percent gain for the best back-to-back showing in 2-1/2 years. A negative however is a 0.1 percent decline in total shipments that came despite a constructive 0.5 percent rise in shipments of core capital goods. Inventories were unchanged in the month though the dip in shipments drove the inventory-to-shipments ratio 1 tenth higher to a less lean 1.32.

    Aircraft had a weak year last year and have been making up lost ground so far this year. But how long Boeing can give total orders a lift is uncertain, and the performance of the wider factory sector, despite sky high strength in many anecdotal reports, has been no better than mixed.

    Both imports and exports down which isn’t a good sign for GDP, as the trade deficit seems to be slowly working its way higher. Also, there was more evidence that the reported positive spike in nonresidential investment for Q1 is suspect:

    Highlights

    A decline in imports held down March’s international trade gap to $43.7 billion which is moderately under Econoday’s consensus for $44.5 billion. But the breakdown doesn’t point to cross-border strength as exports fell 0.9 percent to $191.0 billion in the month against a 0.7 percent decline for imports at $234.7 billion.

    The petroleum gap widened sharply in the month to a nearly 2-year high of $7.9 billion and reflects higher prices for imports and a decline in exports. Exports showing the most weakness are industrial supplies, autos, and consumer goods. Foods rose slightly in March as did the key category of capital goods which otherwise has been flat.

    On the import side most components are lower especially capital goods in what, along with capital goods shipments and nonresidential construction spending, is another contrast with the first-quarter GDP surge in nonresidential investment. Contrasting with the weakness in imports is a rise in imports of autos, up a sharp $1.2 billion in the month to $30.3 billion.

    Country data are in line with trend: the nation’s trade gap with China totaled $24.6 billion in the month followed by the EU at $11.2 billion with Japan at $7.2 billion and Mexico at $7.0 billion. Canada is next at a distant gap of $1.4 billion.

    Breaking down the data between goods and services shows a small widening in the goods deficit to $65.5 billion offset in part by a modest looking but still constructive $0.4 billion dollar rise in the surplus on services. The overall decline in exports and imports is a concern, but today’s report has several positives, not only the surplus on services but also the rise in capital goods exports. Today’s report should give a modest and badly needed lift to revision estimates for first-quarter GDP.

    Highlights

    Chain stores are reporting mostly stronger rates of year-on-year sales growth for April, a month however that got a big boost from this year’s Easter shift out of March. Sales reports from chains are in year-on-year terms only and are not adjusted for calendar effects such as the shift in Easter which is a major holiday for the retail sector. The best way to look at chain-store sales during Easter shifts is to take both March and April together and with this comparison, stores are mostly downbeat. Weakness in consumer spending has been the dominant feature so far of the 2017 economy.

    Retail sales, Bank loans, Philly state index

    Worse than expected and downward revisions as well. Seems related to what looks like a continuing credit collapse:

    Highlights

    First-quarter consumer spending is in trouble. Retail sales fell 0.2 percent in March which is under the Econoday consensus for no change. Importantly, February sales are revised sharply lower, to minus 0.3 percent vs an initial gain of 0.1 percent.

    Vehicle sales round out the quarter with a 3rd straight sharp decline at minus 1.2 percent. Sales at gasoline stations, due to lower prices, fell 1.0 percent. But when excluding both vehicles and gasoline, sales could only manage — despite sky high consumer confidence — a second straight 0.1 percent increase.

    Other areas of weakness include sporting goods which fell 0.8 percent and furniture stores which were down 0.3 percent. And two special areas of weakness are restaurants which fell 0.6 percent for a second straight decline and building materials which fell 1.5 percent. These last two components are excluded in the control group reading which, boosted by a 2.6 percent gain for electronics & appliances and supported by a 0.3 percent increase for general merchandise, rose an outsized 0.5 percent. But even here, February sales for the control group are revised 3 tenths lower and now stand at minus 0.2 percent.

    There are plenty of bad luck wildcards for March including heavy weather and late tax refunds. But today’s report also scales down what had already been a disappointing February. Total consumer spending (which includes services) came in with only 0.1 percent and 0.2 percent gains in the first two months of the year and today’s February revision points to the same for February’s retail sales component (note also that January retail sales are revised down 1 tenth to a 0.5 percent gain). Consumer spending makes up 70 percent of GDP and today’s results, however much they may raise expectations for a snap back, are certain to lower expectations for the first quarter.

    Econintersect Analysis:

  • unadjusted sales rate of growth decelerated 5.3 % month-over-month, and up 3.0 % year-over-year
  • unadjusted sales (but inflation adjusted) up 0.6 % year-over-year
  • unadjusted sales three month rolling average compared to the rolling average 1 year ago decelerated 0.5 % month-over-month, and is up 5.0 % year-over-year.
  • unadjusted business inventories growth rate accelerated 0.4 % month-over-month (up 2.8 % year-over-year with the three month rolling averages showing inventory growth now growing), and the inventory-to-sales ratio is 1.48 which is at recessionary levels (above average for this month in normal times of economic growth).

  • No recovery in sight yet for bank credit growth, which has been the engine driving spending: