Rig count, Retail sales, Industrial production, NY Manufacturing, Atlanta Fed

More bad news for oil related capital expenditures:

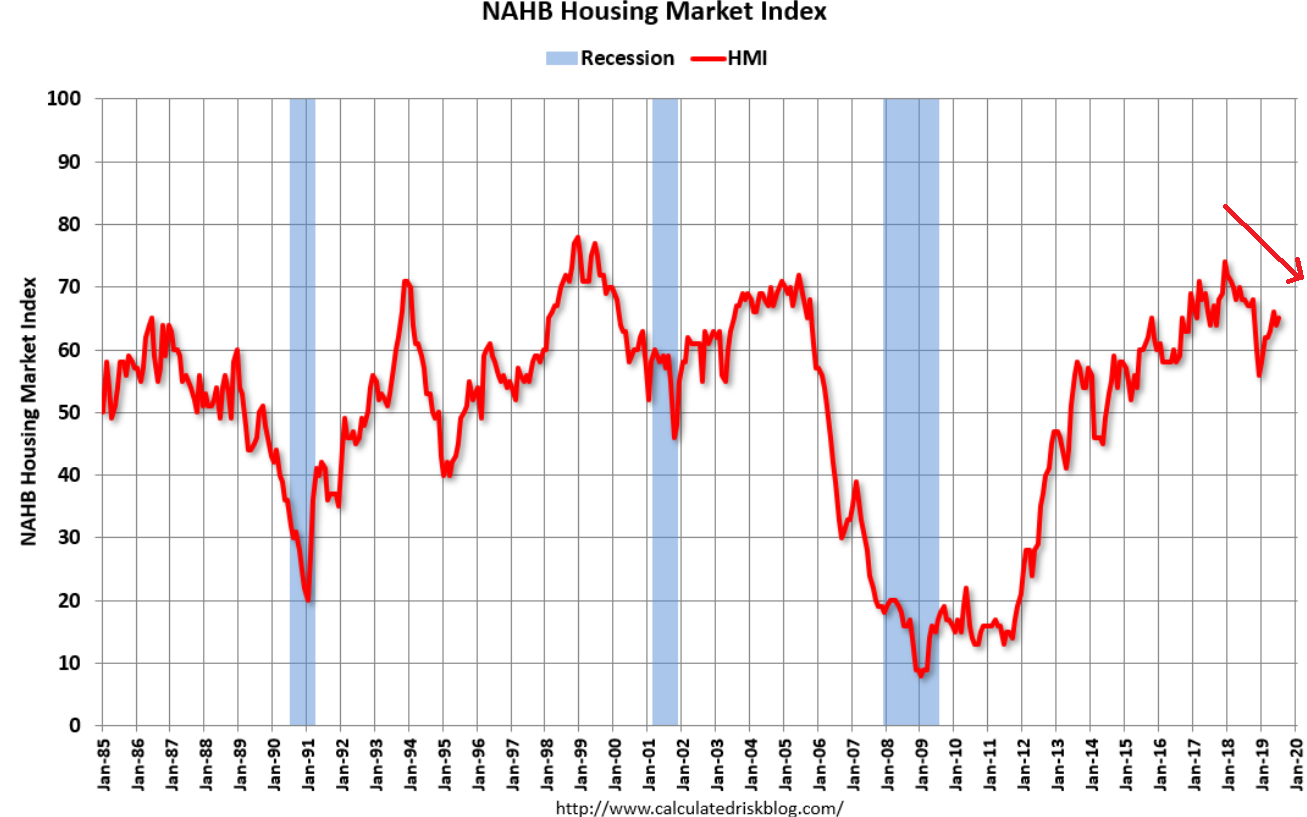
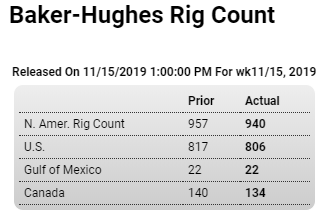
U.S. Rig Count Crashes Again: Loses Nearly 100 Rigs In 3 Months

Highlights

The Baker Hughes North American rig count is down 17 rigs in the November 15 week to 940. The U.S. rig count is down 11 rigs from last week to 806 and is down 276 rigs from last year at this time. The Canadian count is down 6 rigs from last week to 134 and, compared to last year, is down 63 rigs.

For the U.S. count, rigs classified as drilling for oil are down 10 at 674, gas rigs are down 1 at 129, and miscellaneous rigs remain unchanged at 3. For the Canadian count, oil rigs are down 9 at 88 but gas rigs are up 3 at 46.

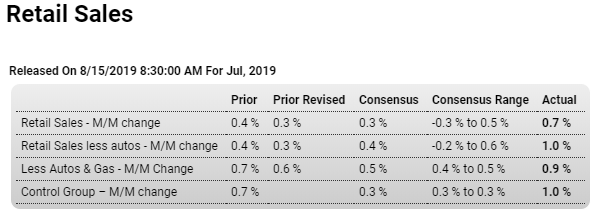
Serious weakness underway:

Highlights

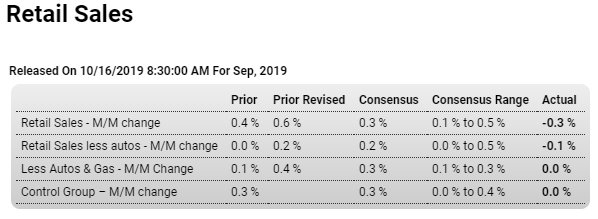
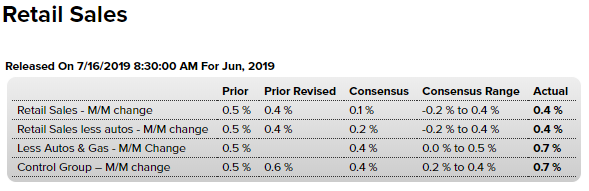
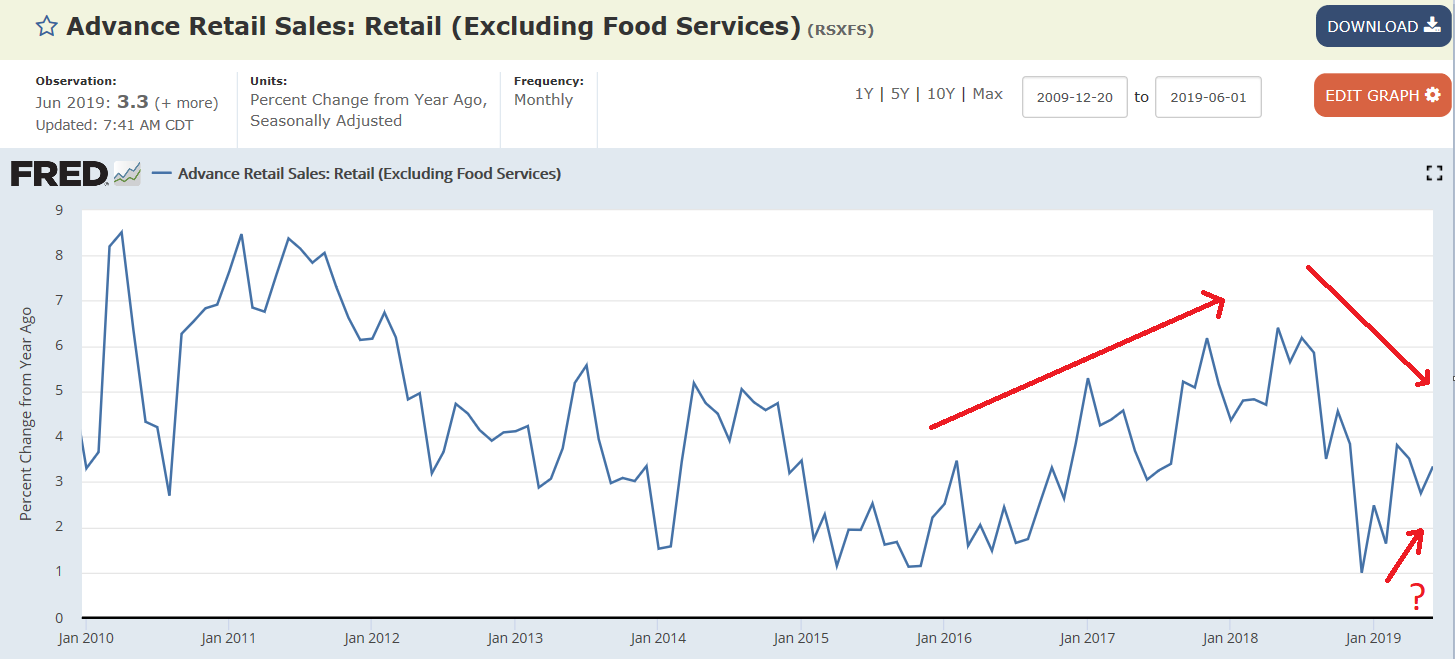
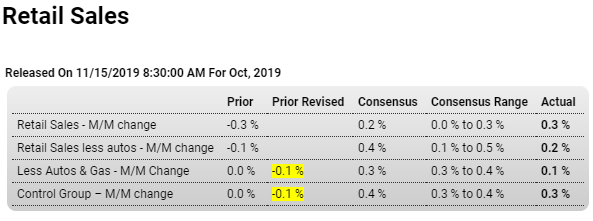
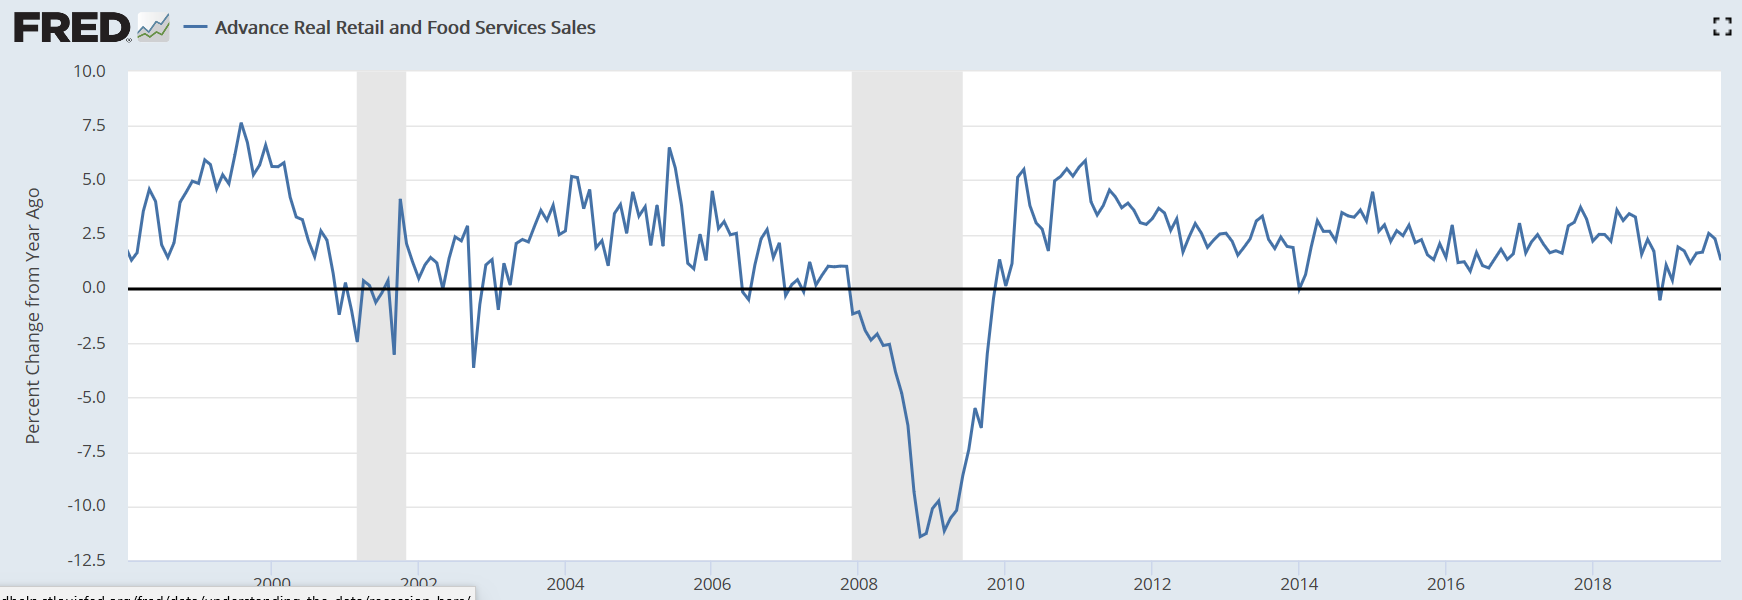
The headline edged above expectations but the details of the October retail sales report aren’t pointing to much momentum going into the holiday shopping season. Total sales did rise 0.3 percent in the month but ex-auto sales, which were thought to prove stronger, proved a little less solid than the headline at a 0.2 percent gain. Control group sales, which are GDP inputs, posted a solid 0.3 percent gain which, however, was a tenth below Econoday’s consensus.

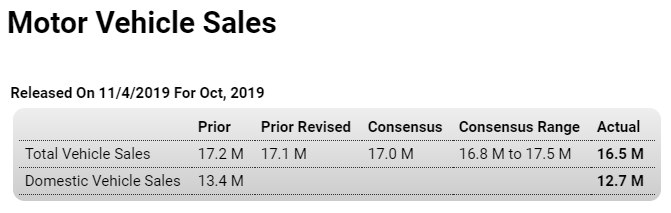
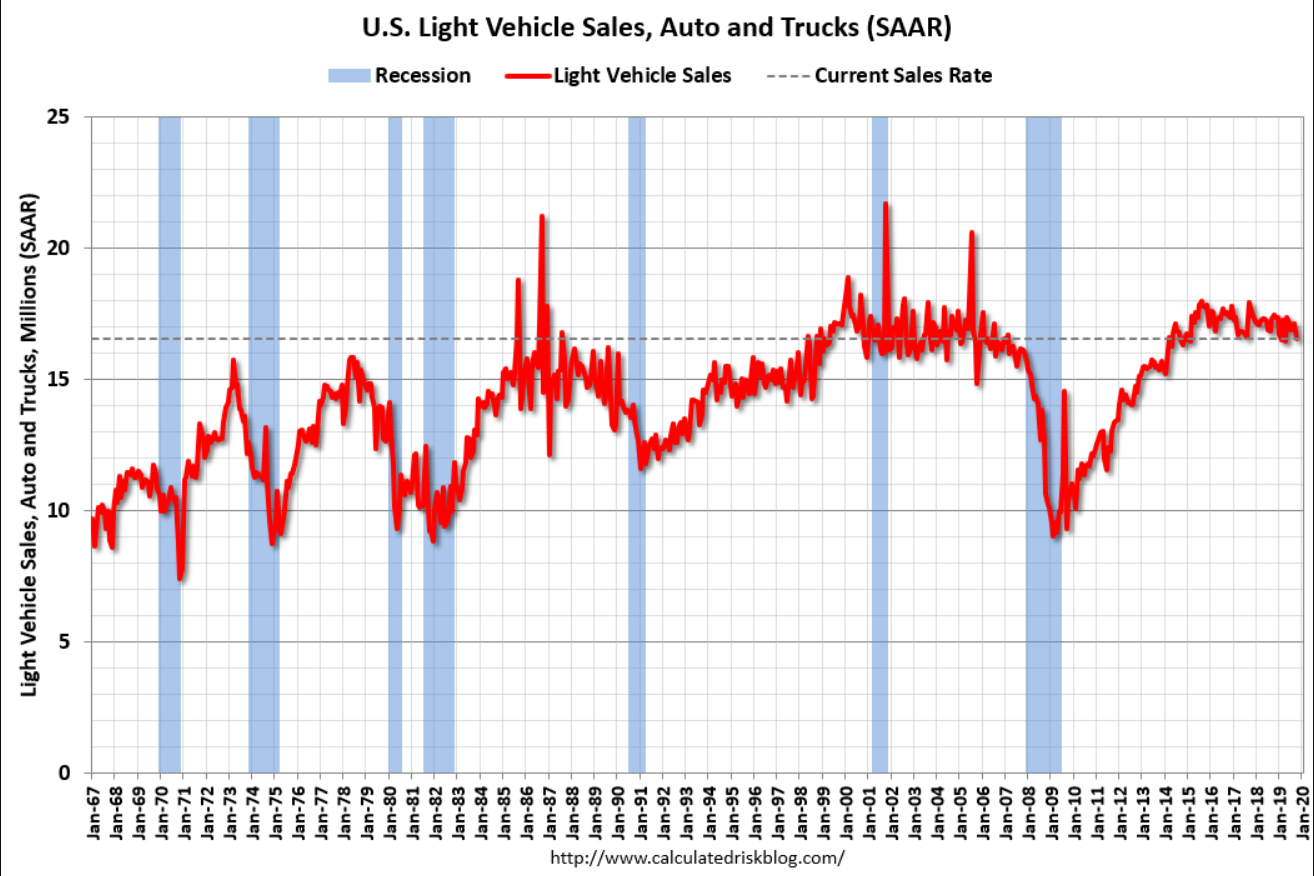
First the positives which are led by motor vehicles where sales, despite weakness in unit auto sales posted earlier in the month, rose 0.5 percent in October. Sales at gasoline stations, which are typically skewed by monthly price swings, jumped 1.1 percent. When excluding both autos and gas, retail sales managed only a 0.1 percent rise to fall below Econoday’s consensus range.

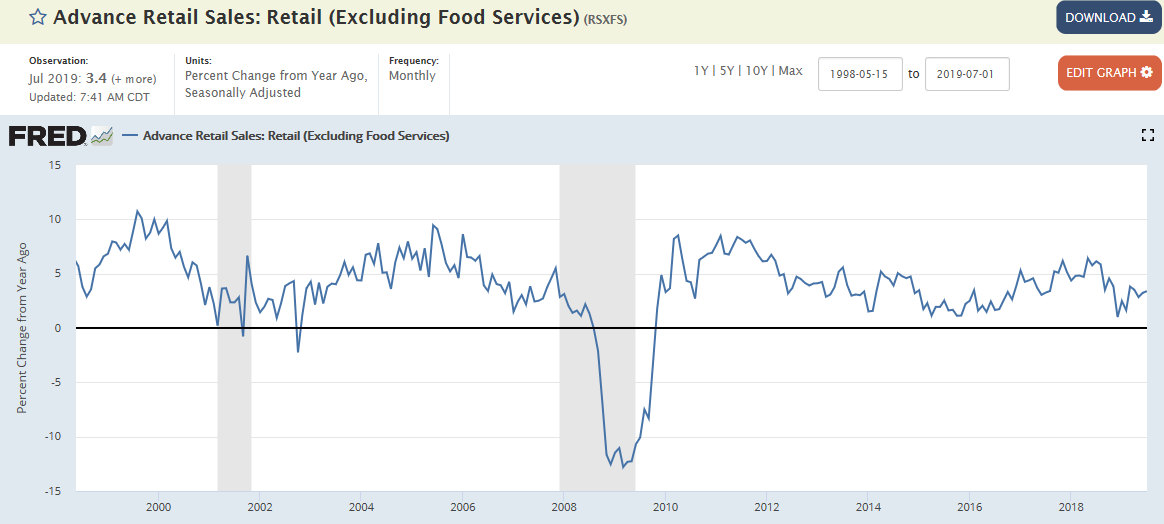
Sales at clothing stores, reflecting weak prices, fell 1.0 percent with sales at furniture stores nearly as weak with a 0.9 percent drop. Sporting goods sales fell 0.8 percent in the month with electronics & appliances down 0.4 percent. A telling confirmation of weakness is a 0.3 percent reduction in restaurant sales, one that doesn’t speak to much consumer enthusiasm.

A plus in the report, as it usually is, are sales at nonstore retailers which rose 0.9 percent in what is a solid indication for e-commerce holiday sales. The retail sector is of course going through an e-commerce driven restructuring as confirmed by payrolls in the sector which have fallen sharply this year. Actual retail sales have been growing this year though October’s nominal 3.1 percent rise from October last year is no more than moderate at best.

For the Federal Reserve, consumer spending is the economy’s bulwark but one or two of reports like this, especially during the holidays, could raise talk that global-related weakness in manufacturing is spilling into the general economy, talk that would point to a resumption of rate cuts.


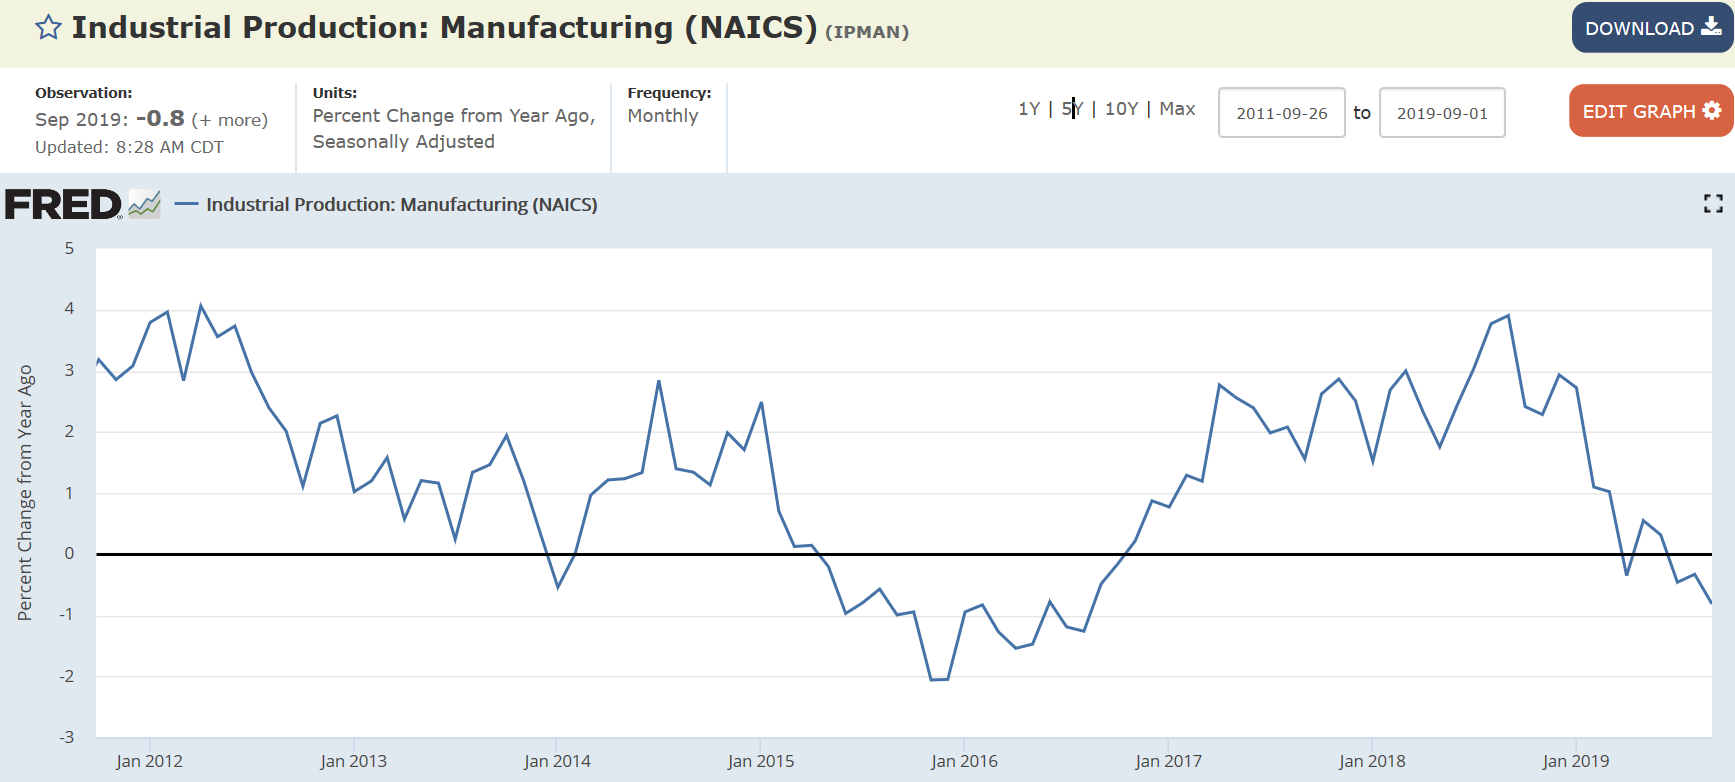
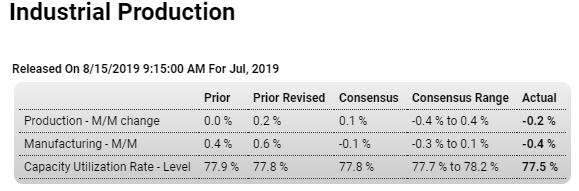
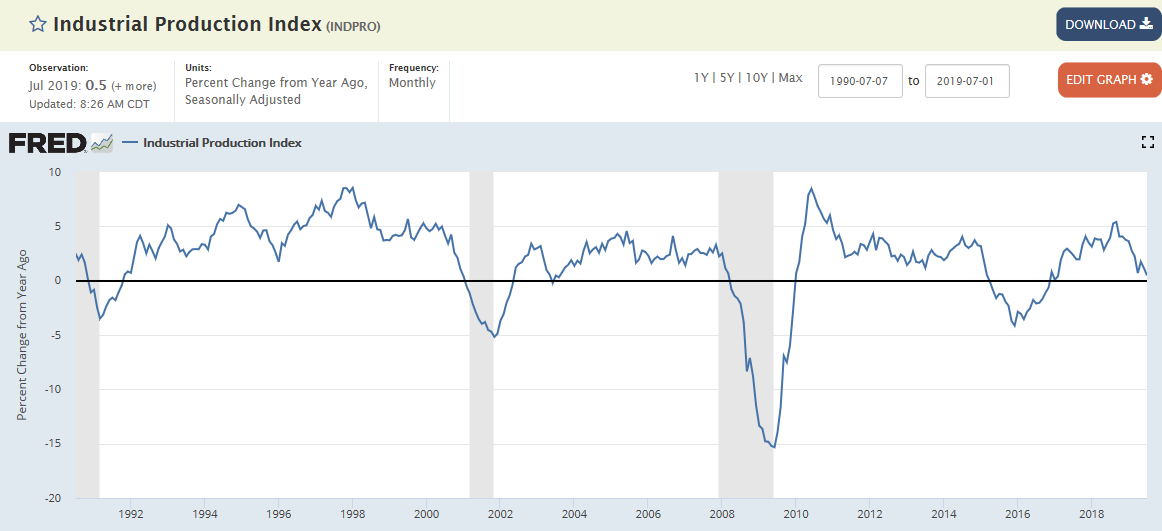
Deeper into contraction and not just the auto strike:
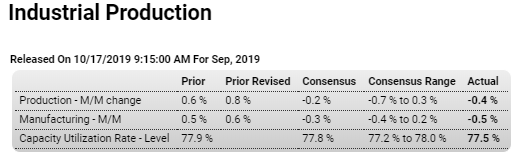
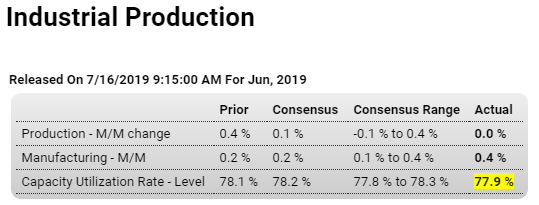
Highlights

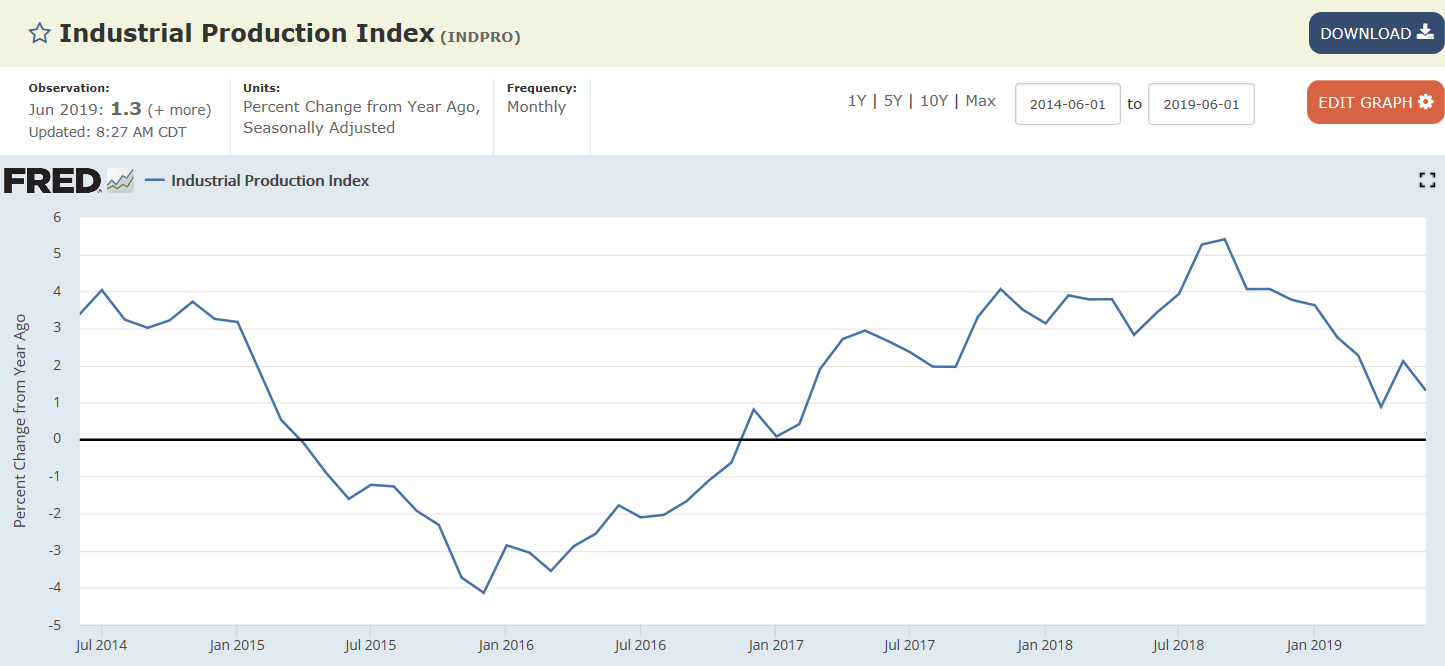
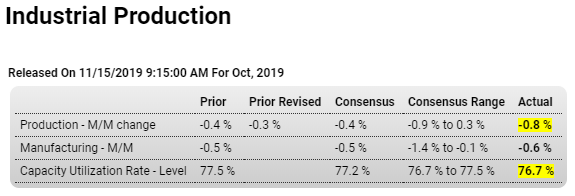
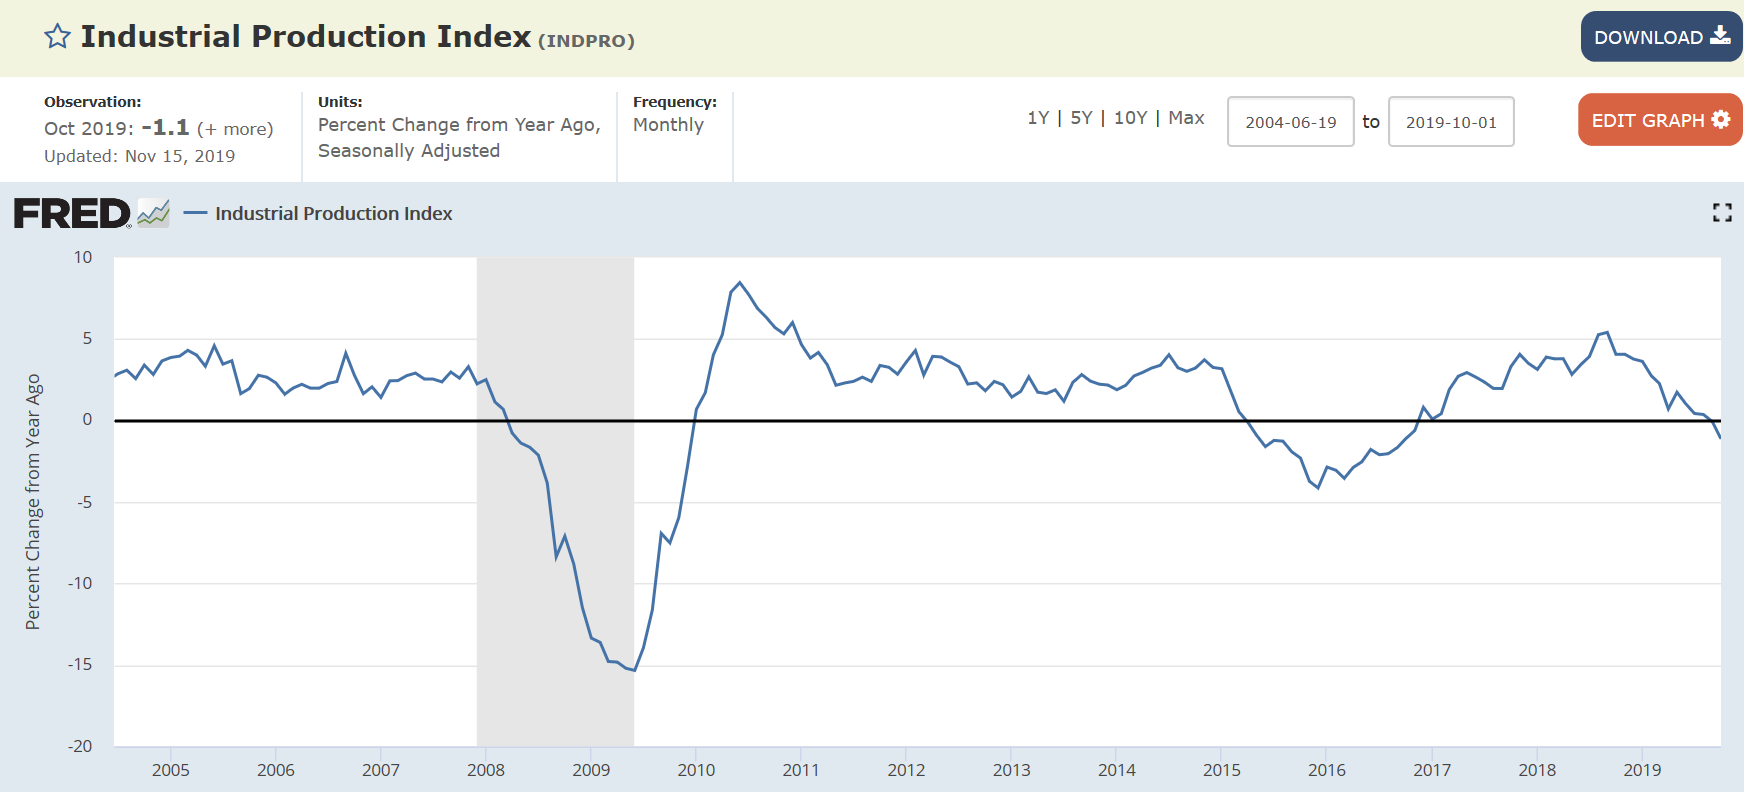
The effects of the now resolved GM strike have made a strong appearance in industrial production data and are largely responsible for two straight monthly contractions, at a much deeper-than-expected minus 0.8 percent in October following a revised minus 0.3 percent in September.

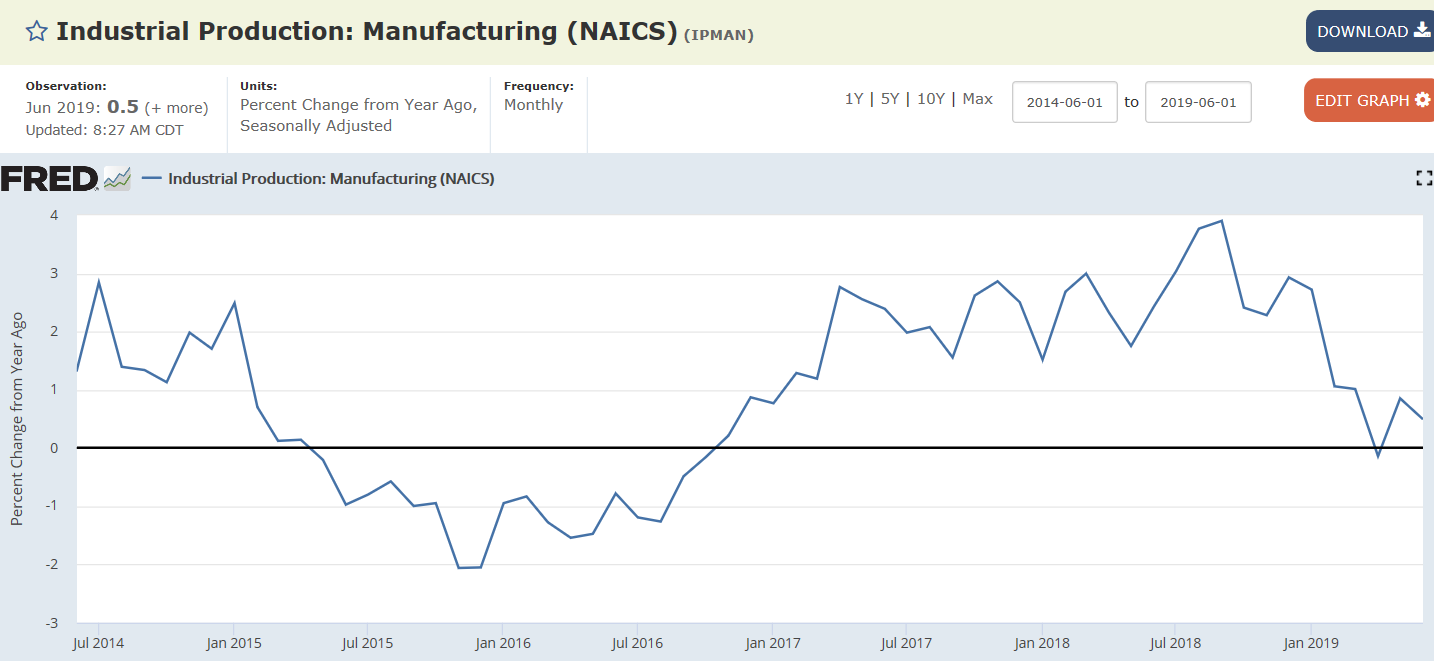
Motor vehicle production fell 7.1 percent in October following a 5.5 percent drop in September and even a 1.2 percent decline in August which was before the strike took effect. October’s drop in vehicle production pulled down overall manufacturing output where volumes fell 0.6 percent, a result that is slightly more severe than Econoday’s consensus and following September’s 0.5 percent decline.

But the bad news isn’t completely limited to vehicles. Production of business equipment fell 0.6 percent in October following a 1.1 percent drop in September in results that won’t cool concern at the Federal Reserve over weakness in business spending. Other readings are likewise soft with volumes of consumer goods down 0.8 percent in a very steep drop that followed smaller declines in September and August. And despite signs of improvement in construction, supplies for the sector have been on a two-month slide, down 0.4 percent in October.

Outside manufacturing, mining continues to stagger, down 0.7 percent following a 0.8 percent drop in September. On the year, mining, where production growth had been in the double digits, is up only 2.7 percent in the latest data which, however, is still a respectable gain for volumes and compares with minus 1.5 percent for manufacturing. Utilities output, the third major component in the report along with manufacturing and mining, fell a monthly 4.0 percent in what likely reflects, not only weather effects, but also lower manufacturing volumes.

With the GM strike now over, vehicle production will presumably begin to reverse its declines and make for outsized overall gains in the coming months. Yet the strike hit a domestic manufacturing sector that has already been weakened by slowing export demand, creating the risk of dislocations in fourth-quarter factory data. Capacity utilization in today’s report reflects the overall weakness, down 8 tenths in the month to a lower-than-expected 76.7 percent.


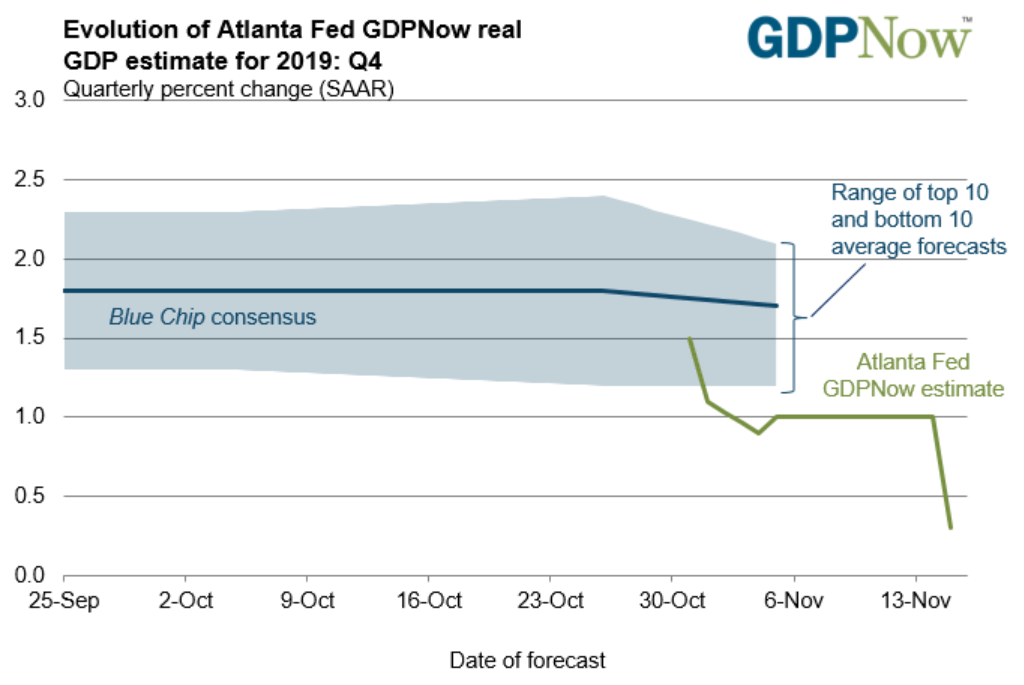
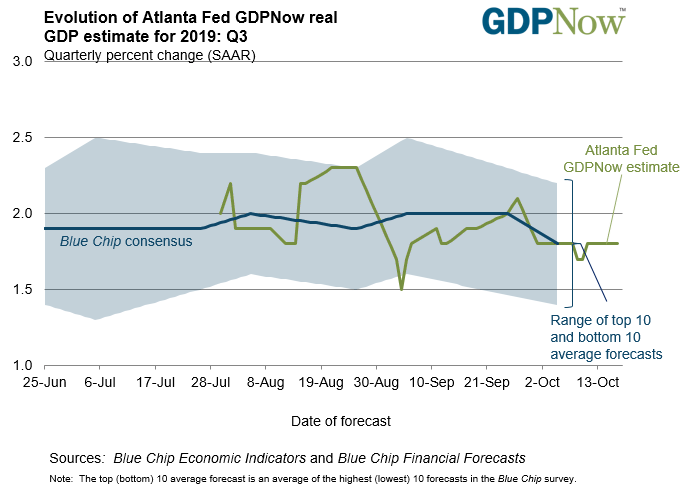
Current forecast is .3:

Employment, Vehicle sales, Factory orders, Headlines, US and Japan services, US and Euro area trade, Credit standards

Job openings now in full retreat:

The contraction continues:

Highlights

Unit vehicle sales, at a much lower-than-expected annual rate of 16.5 million, proved very soft in October and will lower expectations for next week’s retail sales report. October’s pace is the slowest since April reflecting sharp slowing in light truck sales. Vehicle sales have been soft this year, averaging a 16.9 million pace versus 17.2 million and 17.1 million in the two prior years. Despite this, 2019 has been a good year for overall consumer spending and is the fundamental reason why the Federal Reserve stepped back last week from signaling any further rate cuts.


Typical headlines:


Service sectors following manufacturing into contraction:


Global trade collapse- imports and exports going down:

Procyclical action underway maybe:

Banks tightened standards on credit cards in third quarter, Fed survey finds

Housing starts, Industrial Production, Q3 GDP

Fell back this month after last month’s spike from the drop in rates and still looking to me like it’s going nowhere from historically depressed levels, and not population adjusted:

Highlights

Upward trajectory is the theme of housing starts and permits, in data where September’s headlines don’t always tell the fundamental story. Housing starts came in at a 1.256 million annual rate in September that falls not only well short of expectations but also August which is revised higher to 1.386 million. But behind the headline is a small gain, to 918,000, for single-family starts. These pack more GDP punch per unit than multi-family starts which dropped a very sharp 28.2 percent to 338,000. The three-month average for single-family starts is up very sharply, at 901,000 for the 5th straight increase.

Permits for single-family homes are keeping pace with starts, at 882,000 in the month with this three-month average up 20,000 to 862,000 for a fourth straight increase. Total permits dipped back to 1.387 million reflecting a sharp fall in multi-units to 505,000.

Year-on-year, single-family starts are up 4.3 percent with single-family permits up 2.8 percent. These are solid positives for residential investment which, after six straight quarters of pulling GDP lower, may yet contribute positively to third-quarter GDP. But the weakness in multi-family units is a risk for residential investment with starts here down 5.1 percent on the year though permits, in what points to emerging strength and only temporary weakness for starts, up a very sharp 17.4 percent.

A negative in today’s report is decline in completions, down for single-family and multi-units in results that will limit immediate improvement for new home sales. But this report, especially the monthly gains for single-family data and the year-on-year gain for multi-unit permits, does point to the possibility that the housing sector, struggling to move higher as it has all year, may begin to contribute to economic growth.


The global collapse continues:

Highlights

After a strong August, industrial production fell back more sharply than expected in September with year-on-year rates especially betraying the report’s generally weakening trends. Pulled down by manufacturing, industrial production fell a monthly 0.4 percent in September and double the expected contraction. Manufacturing volumes fell 0.5 percent, nearly double the expected decrease and reflecting wide declines across readings including a 4.2 percent monthly drop for motor vehicles, significantly reflecting the GM strike, and a 0.7 percent decline for business equipment.

The report’s two smaller components were mixed with utilities rising 1.4 percent in September but mining falling 1.3 percent. Mining had been enjoying two years of exceptional strength in this report but has since faded. Year-on-year, mining volumes are up a moderate 2.6 percent with utilities up 1.2 percent.

The trouble for manufacturing, which is being held down by weakening demand for US exports, is framed convincingly by 0.9 percent year-on-year contraction in this report. Vehicle production is down 5.4 percent on the year and improvement may be slow based not only the risk of an extended GM strike but also on yesterday’s retail sales report where vehicles sales were a major negative. Business equipment is another negative, down 0.8 percent on the year which won’t be giving the hawks at the FOMC much strength in their arguments to limit further rate cuts. Weakness in business equipment, the result of falling business expectations, is a central concern, if not the central concern, for monetary policy makers.

GDP continues to decelerate:

The economy probably only grew 1.5% in Q3 amid consumer weakness, CNBC tracker shows

Retail sales, Business inventories

Weak income and employment growth tends to coincide with weak retail sales growth, as the global trade collapse continues:

Highlights

The consumer cooled but not enough to not knock back a still rising trend for retail sales which in September fell an unexpected 0.3 percent. All the breakdowns also came in well below expectations including a 0.1 percent dip when autos (one of September’s weaknesses) are excluded and no change when also excluding gasoline.

Perhaps the best gauge to this report is the control group, which is part of the GDP mix and which came in flat. Limiting the unwelcome message from September is a revision to the upside for August, up an additional 2 tents to 0.6 percent, and also a look at the total year-on-year rate which did ease 3 tenths in September to 4.1 percent that, next to August’s 4.4 percent, is still the second best rate since October last year.

Auto sales (in contrast to a rise in previously reported unit sales) fell 0.9 percent though this does follow a 1.9 percent jump in August. Year-on-year growth for autos did slow, down 1.4 percentage points yet to a still favorable 5.6 percent. Gasoline sales, held down by low prices, once again pulled down total sales, falling 0.7 percent in the month after August’s 1.3 percent drop.

Nonstore retailers (dominated by e-commerce) are also in the negative column in September, down a monthly 0.3 percent though year-on-year growth continues to easily top all categories at 12.9 percent. Building materials fell 1.0 percent in September while general merchandise fell 0.3 percent. One of the positive showings is by apparel stores at 1.3 percent and furniture stores at 0.6 percent. Restaurants posted a 0.2 percent monthly gain for very respectable yearly growth of 4.9 percent that, like yearly growth in auto sales, underscores the fundamental strength of the consumer.

Today’s report will limit expectations for the third-quarter contribution from consumer spending, which nevertheless remains favorable and the central underpinning for economic growth. For the Federal Reserve, consumer slowing could make policy more vulnerable to the slowdown underway in global demand and the US manufacturing sector, and in turn strengthen the arguments of the doves who are pushing for more rate cuts.

Highlights

Businesses are holding back inventory growth as sales growth stalls. Total inventories were unchanged in August against only a 0.2 percent rise in sales, a modest mismatch that isn’t enough to move the inventories-to-sales ratio which held unchanged at a lean and favorable 1.40.

Inventories relative to sales look stable right across components with retailers showing the only change and that’s downward, with this ratio a bit more lean at 1.44 versus 1.45 in July.

When it comes to production and employment, nimble inventory management helps smooth out disruptions from economic ups and downs, yet however positive this may be for general economic health a slowing inventory build does hold down GDP growth.

Annual sales growth is negative:


Inventories remain elevated:

Retail sales, Consumer Sentiment, Rails, Sea containers, Wholesale sales, Employment, Hours worked


Up a bit but still looking a lot lower than a few months ago:


“Deep in contraction”

Analyst Opinion of Container Movements

Simply looking at this month versus last month – there were only marginal changes to weak numbers. The year-over-year rate of growth improved for imports and marginally worsened for exports. Still, year-to-date growth for both imports and exports remain deep in contraction.

The three-month rolling averages for exports and imports are also in contraction.

Imports container counts give an indication of the U.S. economy’s state and the soft data continues to indicate a weak U.S. economy. Exports are saying the global economy is weak as well.

Container data is consistent with other transport data indicating a weak economy.


Contraction:

Japan exports, RV sales, Tariff delays

Japan Exports Fall for 8th Month

Exports from Japan dropped 1.6 percent from a year earlier to JPY 6.64 trillion in July 2019, the eighth straight month of decrease and compared to market expectations of 2.2 percent fall, amid weakening global demand and the US-China trade dispute.

An Economic Warning Sign: RV Sales Are Slipping

Elkhart, Ind., is flashing a warning sign that a recession could be just ahead.

Capital of the country’s recreational-vehicle industry, the northern Indiana city and the surrounding area are watched by economists and investors for early indications of waning consumer demand for luxury items, often the first sign of economic anxiety.

Shipments of recreational vehicles to dealers have fallen about 20% so far this year, after a 4.1% drop last year, according to data from the RV Industry Association. Multiyear drops in shipments have preceded the last three recessions.

Aides got Trump to delay tariffs by telling President it could ‘ruin Christmas’

(CNN)- President Donald Trump’s trade advisers were searching last week for a strategy to forestall his threatened tariffs on China, they struck upon a novel approach: appeal to his Christmas cheer.

Under pressure from retailers to prevent a move that would likely have caused prices of popular consumer goods to spike, the President’s team came to him during a meeting last week with a warning. Applying new tariffs on all Chinese imports, they cautioned, could effectively “ruin Christmas,” according to people familiar with the matter.
It was a tactic that worked: Trump announced the tariffs would be delayed until December 15.

Industrial production, Retail sales, Housing index, NY manufacturing, Trump comments

Tariffs doing their thing to the US economy:

Highlights

A jump in utility output couldn’t save industrial production in July which, pressured by contraction in both manufacturing and also mining, came in near the low end of Econoday’s consensus range with a 0.2 percent decline. Utilities, where production is affected by the weather and where results are often volatile, jumped 3.1 percent in the month following a 3.3 percent June decline. Outside of this component, however, positives in the July report are scarce.

Manufacturing production fell 0.4 percent in the month to miss the low end of the consensus range. Construction supplies fell 1.0 percent in the latest uneven indication for this sector while motor vehicles, where production had been on the rise, edged back 0.2 percent. Business equipment, an area of particular concern for the Federal Reserve, fell 0.4 percent in the month. Mining, which along with manufacturing and utilities is the third major component in the report, has been contributing strongly to total growth for the past couple of years but not in July as output fell 1.8 percent.

The weakness in this report was signaled by declines in hours worked in the July employment report, yet the results are more negative than expected and will boost arguments at the Federal Reserve for further interest rate cuts. The Fed is especially focused on manufacturing, a sector that is directly exposed to global slowing and global trade tensions and which is structurally considered to account for most of the domestic economy’s cyclical variation.


Strong report, subject to revision, and in any case on a year over year basis the gains are still working their way lower:

Highlights

Unexpected strength has not been an overstatement in recent retail sales reports including July’s where all major readings easily surpass Econoday’s consensus range. Total sales rose 0.7 percent, ex-auto up 1.0 percent, ex-auto ex-gas up 0.9 percent, and the control group up 1.0 percent.

Where to start? First the few weaknesses including auto sales which, as indicated by a dip in previously released unit sales, fell 0.6 percent in the month to extend an uneven run for this component. Sporting goods, a small category, also fell while health & personal care stores, a large category, slipped slightly.

Now let’s turn to acceleration and it’s led once again by non-stores, where monthly sales jumped 2.8 percent following gains of 1.9 and 2.3 percent in the two prior months. This component is dominated by e-commerce which is making increasingly greater gains at the expense of brick-and-mortar stores. Department stores have been one of the victims but not in July with a 1.2 percent sales jump. Electronics & appliance stores posted a 0.9 percent gain with clothing stores up 0.8 percent and food & beverage up 0.6 percent. Gasoline stations, benefiting from higher prices, had a strong month with a 1.8 percent gain. Building materials posted a small contribution.

But punctuating the strength and speaking to the underlying discretionary power of the consumer is yet another very strong gain for restaurants, up 1.1 percent following four prior monthly gains of 0.7, 1.1, and 0.7 percent.

The consumer held up second-quarter GDP posting robust and inflation-adjusted annual spending growth of 4.3 percent, a mark that would be difficult to match let alone exceed but that’s a possibility given the strong jump out of the gate for July retail sales.


Up a bit but still looking like it peaked about a year and a half ago:


Volatile but also still looks to be working its way lower:

The latest from our ‘shoot first and ask questions later’ President:

Israel bars Democrats Tlaib and Omar from visiting after Trump claims ‘they hate Israel’

Personal income and consumption, Home prices, Pending home sales, Oil capex, Euro area

Income and consumption is growing at lower but moderate pace, but has been decelerating since the tariffs started to bite and global trade began its collapse:

Highlights

The month-to-month breakdown of consumer spending shows slowing in what will offer support for those on the FOMC who want to cut interest rates this week. Despite the strength of June retail sales, total consumer spending in the month rose only 0.3 percent following gains of 0.5 percent in May and 0.6 percent in April. Spending on both goods and also services shows this similar pattern.

Monthly data on income and also core inflation are steady in the monthly sequences, at 0.4 percent for April through June on income and at 0.2 percent each month for core PCE inflation (ex-food ex-energy). The year-on-year rate for the core did tick 1 tenth higher in June to 1.6 percent in a gain that moves the curve in the right direction and incrementally toward the Fed’s 2 percent target but one that follows a 1 tenth downward revision to May which is now 1.5 percent.

Turning back to income, the wages & salaries component jumped 0.5 percent in June but follows very low monthly gains in May and April of 0.2 and 0.1 percent. Yet the consumer’s finances look solid with the savings rate up 1 tenth to 8.1 percent.

The Fed’s assessment of the consumer has to remain very favorable given the strength of income and spending though the slowing for the latter in June will give policy makers some cover for a rate cut. Providing the most cover, however, is core inflation which is under target and which suggests that an increase in demand would be sustainable. But there is a little gem for the hawks and that’s the monthly gain for the core which, at an unrounded 0.247 percent, just missed coming in at 0.3 percent.


This kind of weakness and deceleration is not a good sign for the economy:


Gone negative:

Looks like the price of oil hasn’t been high enough for capex to grow:

The BEA has released the underlying details for the Q2 initial GDP report.
The BEA reported that investment in non-residential structures decreased at a 10.6% annual pace in Q2.
Investment in petroleum and natural gas exploration decreased in Q2 compared to Q2, and was down 8% year-over-year, but has increased substantially over the last two years.

Trucking index, Tariffs, Singapore exports, Turkey retail sales

FTR Trucking Conditions Index weakens in May


The President is in no hurry because he narrowly views the some $5 billion/mo in tariff revenues as a profit for the US at China’s expense, totally insensitive to the global economic downturn this ‘tax hike’ has created:

Trade war to drag on as Trump says long way to go and China strikes hard-line tone

Retail sales, Industrial production, Housing index, Business inventories

Better than expected:

Highlights
Taking out a policy-insurance rate cut when the main driver of the economy is booming sounds a little counter-intuitive, in retail sales results that came in much stronger than expected in June. Total sales rose 0.4 percent in the month with ex-auto sales also up 0.4 percent — both of these hit the top end of Econoday’s consensus range. Easily surpassing the top end of the consensus range are two of the report’s key core readings with less auto & less gas and also the control group up very sharply at 0.7 percent gains on the month.

Strength abounds in this report with the isolated weak points led by gasoline stations, where price effects tied to lower oil prices pulled down sales by 2.8 percent, and also department stores, an ailing segment of the retail sector that seems to be devolving.

The most surprising strength in the report, at least for forecasters, is a 0.7 percent jump in auto sales that conflicts with what was a flat month for unit sales (a series, however, that is clouded with special factors). Not surprising is a another surge, this time 1.7 percent for a second month in a row, for nonretailers which continue to feed off of traditional retailers such as department stores.

A key strength, and one that underscores discretionary power, is yet another strong gain for restaurants, up 0.9 percent following prior gains of 1.0 percent, 0.7 percent, and 0.8 percent. This shows that consumers, flush with confidence and fully employed, are enjoying themselves.

The list of strength goes on with both furniture and building materials snapping back with 0.5 percent gains that point to strength for residential investment. Clothing stores saw sales rise 0.5 percent as did health & personal care stores.

The Federal Reserve may be looking across the oceans for reasons to justify a rate cut, but any justifications aren’t coming from the US consumer which makes up the vast bulk of GDP. And however much inflation may be flat, consumer spending is not to blame.

Not inflation adjusted and June subject to revision next month:


Worse than expected:


Manufacturing:


As expected, and still looking like it’s rolled over:

Highlights

Business inventories rose a slightly lower-than-expected 0.3 percent in May but follow a 0.5 percent rise in April in results that put the outlook for inventory contribution to second-quarter GDP at roughly flat. There are hints that inventory growth is exceeding underlying demand as 5.3 percent year-on-year growth for inventories is well above the 1.5 percent rise for business sales. Yet any imbalances aren’t increasing as the inventory-to-sales ratio in May held steady at 1.39.

Inventory remains high relative to sales: