PCE health care, Bank lending survey, Consumer credit

Best I can tell this is mainly about health care insurance premiums, which ‘count’ as personal consumption expenditures and have been adding support to GDP:

Inflation adjusted:
110701

Not inflation adjusted:
110702

Looks like the support is starting to fade:
110703

The ‘one time’ adjustment for Obamacare may have passed, along with it’s support
for GDP. And note the growth of employment was well below the growth in costs:
110704

110705
Bank credit tends to tighten up as the economy slows, which slows lending and makes matters worse.
The buzz word is ‘pro cyclical’:

On net, domestic survey respondents generally indicated that their lending standards for CRE loans of all types tightened during the third quarter.6 In particular, a moderate net fraction of banks reported tightening standards for loans secured by nonfarm nonresidential properties, whereas significant net fractions of banks reported tightening standards for construction and land development loans and loans secured by multifamily residential properties.

Read more at http://www.calculatedriskblog.com/#7PGBE67aLF27XSQ1.99
110706
These are as of August 1, and have moved higher since as per the above text:

110707

110708
Close to expectations, no sign of any kind of meaningful increase in consumer spending:

110709
Remember, for GDP to grow just as fast as last year, on average the pieces have to grow just as fast. This one is decelerating to the extent it represents sales it is therefore subtracting from growth:
110710

Payrolls, Tax receipts, Saudi price hikes

As per the chart, the deceleration of employment growth continues in what’s now been a very steady decline going on 2 years. And with employment growth decelerating at this rate it’s likely the unemployment rate will remain elevated indefinitely:

110401

Highlights

Solid payroll growth is not the whole story of the October employment report. Average hourly earnings are rising, up an outsized 0.4 percent in the month with the year-on-year rate, at 2.8 percent, suddenly near 3.0 percent and at its recovery peak. Nonfarm payroll growth is very respectable, up 161,000 for nonfarm payrolls with upward revisions adding a net total 44,000 to September (191,000) and August (156,000). The unemployment rate is down 1 tenth to 4.9 percent and, for some, is already signaling full employment for the labor market.

Government payrolls rose a moderate 19,000 in October, excluding which private payrolls came in at 142,000 vs September’s 188,000. Construction, adding 11,000, is a highlight after adding 23,000 in the prior month, and professional services along with temporary services extended their gains. Manufacturing once again posted a decline.

But negatives are scarce in this report, where strength is emphatically underscored by the unexpected acceleration in average hourly earnings which further includes an upward revision to September. Today’s report marks a solid opening to fourth-quarter data and will raise talk of a wage-inflation flashpoint and a rate hike for the December FOMC.

110402
Sound the alarm over this?

110403
This includes ‘supervisors’ and remains below levels of the prior recession:

110404

110405

They are price setters, not price takers:

Saudi Aramco Increases Oil Pricing to Asia on Rise in Demand

By Sam Welkin

Nov 3 (Bloomberg) — Saudi Aramco increases Dec. pricing for Arab Light to Asia by 90c/bbl to premium of 45c over regional benchmark, state-owned co. says in e-mailed statement.

  • Aramco raises Arab Light pricing to NW Europe by 70c/bbl, to Mediterranean region by 15c/bbl compared w/ benchmarks
  • Co. leaves pricing for U.S. sales of Extra Light, Arab Light, Medium grades unchanged for Dec.; cuts pricing for Arab Heavy to U.S. by 40c/bbl
  • NOTE: Saudis Said to Raise Arab Light Oil Pricing to Asia for December
  • Personal consumption, Swiss retail sales, Redbook retail sales, PMI manufacturing, ISM manufacturing, Construction spending

    Gotta like the headlines. The growth rate remains below where it was during the beginning of the last recession… That is, we could already be well into recession:

    110201
    Adjusted for inflation, also below prior recession levels:

    110202
    And it doesn’t seem like building $600 billion of reserves, buying US stocks, and a negative rate policy have done much for the Swiss consumer:

    110203
    Not even a hint of improvement here:

    110204
    As previously discussed, manufacturing seems to be leveling off at reduced and modest levels:

    110205

    110206

    Highlights

    ISM’s manufacturing sample reported no better than moderate conditions in October with the composite index at 51.9 which however is still 3 tenths better than Econoday’s consensus. But new orders are a disappointment, still showing monthly growth but, at 52.1 vs September’s 55.1, at a much slower rate. Backlog orders, at 45.5, are even softer, holding below 50 for a 4th month in a row to indicate contraction. A positive for orders is a steady though moderate rate of growth for new export orders, at 52.5 for a 1/2 point gain.

    Production did pick up speed in the month, up 1.6 points to 54.6, while employment moved from 49.7 and back over 50 for the first time since June, to 52.9. Input costs also point to steady demand, rising 1.5 points to 54.5.

    Yet this report tells a very different story from the manufacturing PMI released earlier this morning where readings, especially new orders, are accelerating sharply. Combining the two probably offers the most reliable indication on the factory sector, that is moderate and respectable growth going into year end.

    110207
    Construction continues to head south with no relief in sight.
    And watch for downward revisions to q3 and q4 GDP growth estimates:

    110208

    Highlights

    Construction spending remains weak but indications on housing do show limited improvement. Total construction spending fell 0.4 percent in September for a year-on-year decline of 0.2 percent. But residential spending rose 0.5 percent in the month with this year-on-year rate at plus 0.9 percent. The breakdown here though is mixed as the key single-family category could muster only a monthly rise of 0.1 percent. Multi-family construction is once again the strength, rising 2.0 percent in the month to extend an upward trend that reflects gains in current rental rates.

    The real weak area is in the non-residential side of the report where spending on private construction fell 1.0 percent in the month and with public construction down 1.1 percent for its poorest showing since March 2014. Nearly all components on the nonresidential side show monthly declines with commercial, down 2.4 percent, and Federal spending, down 1.9 percent, showing the most weakness.

    The construction sector, despite unusually low mortgage rates, has been struggling this year with the softness in single-family housing posing continued challenges for what is otherwise a strong new home market.

    110209

    Personal Income and Spending, Chicago PMI, Dallas Fed

    Personal income a bit below expectations, spending met expectations but last month revised down a bit. And the GDP report already had consumer spending way down and less than expected and we already know auto sales are falling behind last year’s totals:

    103101

    Highlights

    Personal income rose a solid but slightly lower-than-expected 0.3 percent in September with the wages & salaries component, which weakened in August, also at plus 0.3 percent. Consumer spending was especially solid in September, up an as-expected 0.5 percent and reflecting the month’s strength in vehicle sales.

    Inflation data are mixed to soft. The overall price index rose 0.2 percent with the year-on-year rate at plus 1.2 percent. This is the strongest yearly showing since November 2014 and is 2 tenths closer to the Federal Reserve’s 2 percent target.

    Yet the core rate, which excludes food & energy, failed to show much lift, up only 0.1 percent on the month with the year-on-year rate unchanged at 1.7 percent. This rate has been stuck between 1.6 and 1.7 percent all year though is up from 2015’s average of 1.4 percent.

    The consumer wasn’t putting September’s increase in income into savings as the savings rate edged 1 tenth lower to what is a still respectable 5.7 percent.

    Overall, the consumer ended the third quarter in respectable fashion, pointing to moderate economic momentum going into the fourth quarter.

    Income growth continues it’s deceleration that began with the collapse in oil capex:

    103102
    A setback here, as previously discussed was likely:

    103103

    Highlights

    The Chicago PMI has been bumpy all year and is once again for the October report, down 3.6 points at 50.6 to indicate abrupt month-to-month slowing in composite activity. New orders are part of the slowing as is production. Signs of strength come from employment, which is back into the expansion column, and from prices paid which show the most pressure since November 2014. Though uneven and mostly soft, this report points to continued expansion for the area’s economy. The Chicago PMI covers both the manufacturing and nonmanufacturing sectors.

    103104
    Still in contraction:

    103105

    United States Dallas Fed Manufacturing Index

    The Federal Reserve Bank of Dallas’ general business activity index for manufacturing in Texas rose to -1.5 in October 2016 from -3.7 in September, but below market expectations of 2. The capital expenditures index moved up to 8.7 (from 3.1 in September), reaching its highest reading in nearly two years. In contrast, the production index declined 10 points to 6.7, suggesting output rose but at a slower pace this month; and the capacity utilization and shipments indexes fell notably after spiking last month, coming in at 0.8 (13.5 in September) and 1.9 (20.1 in September), respectively. The employment index came in at 0.2 (2.3 in September), suggesting little change in headcounts, and the hours worked index fell into negative territory (-1.8 from 3.7 in September). Also, the new orders declined to -3.5 from -2.9. Meanwhile, expectations regarding future business conditions improved again with the index of future general business activity posting a fifth positive reading in a row.

    Not looking like any meaningful improvement is developing:

    103106

    US balance of trade, New home sales, PMI health care premiums, ECB statement, German consumer morale

    A bit fewer than expected and prior month revised down bringing it more in line with permits:

    102607
    A nice uptick here, but as per the chart too soon to say the downtrend has reversed. And notice, again, how employment is faltering as has been the case in most of the surveys:

    102608

    Highlights

    Markit Economics’ U.S. samples are reporting a sharp upturn in business this month, first with Monday’s manufacturing report and now with the service flash where the headline index is up nearly 3 points to 54.8 for the strongest rate of composite growth this year. New orders are at an 11-month high as is business activity, and year-ahead expectations are at their best level since August last year. The rise in demand is being reflected in inflation readings with input costs moving up from a nearly 2-year low and with selling prices also moving higher. Not showing much life, at least yet, is employment where job creation did improve but still remains near a 3-1/2 year low. The report attributes this month’s strength to rising hopes for improvement in the domestic economy. The sharp gains for Markit’s samples are a surprise but are still only anecdotal indications. Definitive data on October will be posted next week with the month’s unit auto sales and of course the monthly employment report.

    102609
    August revised higher which lowers GDP estimates, Sept higher than expected which increases estimates. I suspect Sept (like August) will be revised lower next month when October is released. And note the highlighted details that don’t bode well for domestic demand:

    102610

    Highlights

    In a positive for Friday’s third-quarter GDP report, the nation’s trade gap in goods narrowed sharply in September, to $56.1 billion vs a revised $59.2 billion in August. Exports in September rose a solid 0.9 percent led by the largest component, capital goods, which rose 3.8 percent in what is a positive indication for global business investment. Exports of consumer goods also rose, up 4.4 percent, with industrial supplies up 2.3 percent. Also helping the deficit is a 1.1 percent decline in imports where most components fell with the exceptions of autos, up 4.3 percent, and other goods, up 0.8 percent. In a negative indication of retail expectations for the holidays, imports of consumer goods fell 1.8 percent following a 0.6 percent decline in August. And in a negative indication for domestic business investment, imports of capital goods fell 3.6 percent. Also released this morning are advance data on September inventories in the wholesale and retail sectors, up 0.2 percent for the former and up 0.3 percent for the latter.

    This will be counted as increased consumption, but will take away from other consumption:

    U.S. government says benchmark 2017 Healthcare.gov premiums up 25 percent

    By Caroline Humer

    Oct 24 (Reuters) — The average premium for benchmark 2017 Obamacare insurance plans sold on Healthcare.gov rose 25 percent compared with 2016. The average monthly premium for the benchmark plan is rising to $302 from $242 in 2016, the Department of Health and Human Services said. The government provides income-based subsidies to about 85 percent of people enrolled, and those credits will increase with the higher premiums. It said 72 percent of consumers on HealthCare.gov will find plans with a premium of less than $75 per month.

    If anything, it’s the weak euro that’s added some support to GDP, but not to consumption:

    Draghi hits back at critics of QE and negative rates

    By Claire Jones

    Oct 25 (FT) — “We have every reason to believe that, with the impetus provided by our recent measures, monetary policy is working as expected: by boosting consumption and investment and creating jobs, which is always socially progressive,” ECB president Mario Draghi said. “I find it hard to reach the conclusion that, over a longer timeframe, the outcome of our policies has been — or will be — to redistribute wealth and income in an unfair or unequal way,” the ECB president said. “That is certainly not true across countries, and there is not much to suggest it is true within countries either.”

    102611

    Germany Inc. Sits on $500 Billion in Cash Amid Weak Outlook

    By Nina Adam

    Oct 25 (WSJ) — Germany’s nonfinancial businesses have saved more than they have invested for the past seven years, piling up about €455 billion ($500.4 billion) in cash and deposits, German central bank data show. Of 11 companies in the DAX-30 stock index that disclosed their investment plans, five said they plan no increase in capital expenditure this year or next. Five others said they plan increases, but mostly outside Germany. Volkswagen said it was canceling or delaying all investment projects that it doesn’t consider “core.”

    Retail sales, Atlanta Fed, Consumer sentiment, Business inventories, Unemployment claims, Freight transportation services

    All numbers as expected. Notice the use of the word ‘solid’ for all the reports? And no one talking about year over year, which eliminates much of the seasonal factors and month to month volatility. Nor do they mention that these numbers are not adjusted for inflation, which pushes the year over year numbers down to stall speed. See charts below:

    101401

    Highlights

    Retail sales proved solid in September hitting the Econoday consensus across the board: total up 0.6 percent, ex-auto up 0.5 percent, ex-auto ex-gas up 0.3 percent. Auto sales as expected are the highlight of the report, up 1.1 percent to reverse the prior month’s 0.3 percent decline. Auto sales, a discretionary category, have been solid this year though down from last year’s peak. Restaurants, another discretionary category, are also strong, up 0.8 percent to add to August’s 0.7 percent gain.

    Other positives include two related to housing, furniture which rose 1.0 percent and building materials & garden equipment, up 1.4 percent. This latter reading will give a boost to the residential investment component of the third-quarter GDP report.

    This whole report in fact will give a lift to GDP, providing a quarter-end pop to consumer spending which was soft in the quarter’s first two months. Strength in retail sales ultimately reflects strength in the labor market and today’s report will further build expectations for an FOMC rate hike at the December meeting.

    101402
    How ‘solid’ do these look?

    Inflation adjusted:

    101403
    Not adjusted for inflation doesn’t look good either:

    101404
    The Atlanta Fed lowered their q3 estimates further on today’s news:

    101405
    Looks like last month’s move higher that lifted hopes has more than reversed to instead follow the down trend of the last several months:

    101406
    Inventories remain elevated and are keeping a lid on output:

    101407

    Highlights

    Inventories continue to edge incrementally higher, up 0.2 percent in August and in line with a 0.2 percent rise in sales to keep the inventory-to-sales ratio unchanged for a third month at a lean 1.39. Inventories at wholesalers fell 0.2 percent in August while inventories at manufacturers rose 0.2 percent. Inventories at retailers, boosted by swelling at auto dealers, rose a sharp 0.6 percent in a build, however, that looks manageable given this morning’s solid retail sales report for September, one that is headed by strength in vehicle sales.

    An inventory correction to the 1.30 level isn’t out of the question:

    101408
    Wondering when they begin to suspect this is more about being made a lot harder to get, and less about labor market conditions:

    101409

    Highlights

    Unemployment claims remain at or near historic lows, indicating a lack of layoffs and quick turnaround for those who do lose their jobs. Initial claims came in near the low end of expectations in the October 8 week, at 246,000 with the 4-week average at 249,250. Both of these averages are down roughly 10,000 from a month-ago, comparisons that offer early indications of strength for the October employment report. Continuing claims are trending roughly 100,000 below a month ago, at 2.046 million and a 16,000 decline in the latest data which are for the October 1 week. Hurricane Matthew had only limited impact on initial claims with only one state in the affected area, Virginia, having to be estimated. Louisiana was also estimated in this report. Records of note in this report is a 43-year low for the weekly level of initial claims and an 8th straight decline for the 4-week average which is also at a 43-year low.

    Looks like the move up was only a blip, but too soon to tell:

    101410

    Jobs, Wholesalers sales and inventories, Atlanta Fed GDP forecast

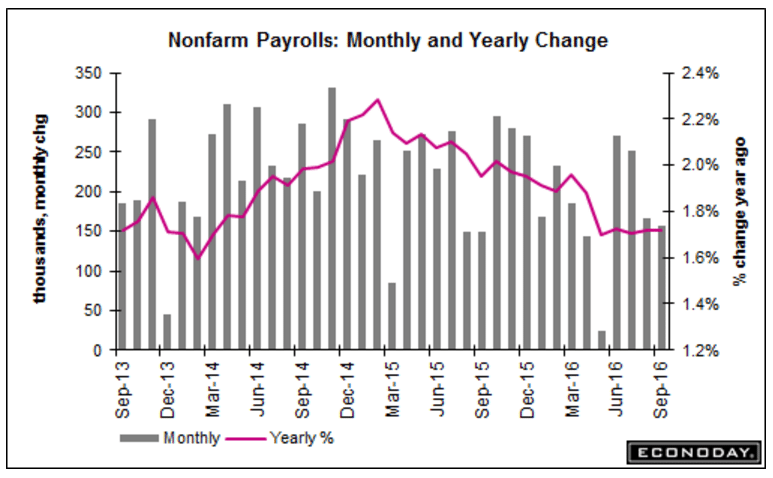
    Less than expected, July/August total revised down, earnings gain less than expected. Yes, unemployment was up because the labor force increased, but arguably it was functionally that large in the months before, etc, which means, functionally, unemployment had been that much higher all along, etc. etc. and all to my suspicions that the drop in the participation rate might be close to entirely cyclical, meaning the ‘slack’ might be equiv. to a headline unemployment rate well north of 7%, and the U6 rate well north of 12%. Also recall that the birth/death’ model that estimates jobs from new business formations tends to overstate employment growth when employment growth is declining, so don’t be surprised by more downward revisions:
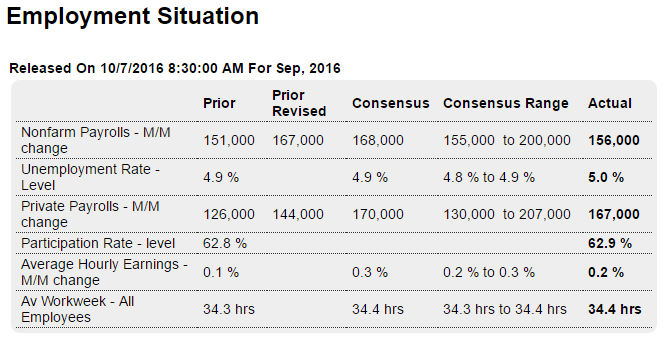
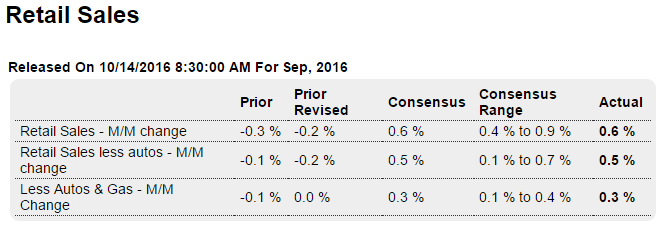
    100701

    Highlights

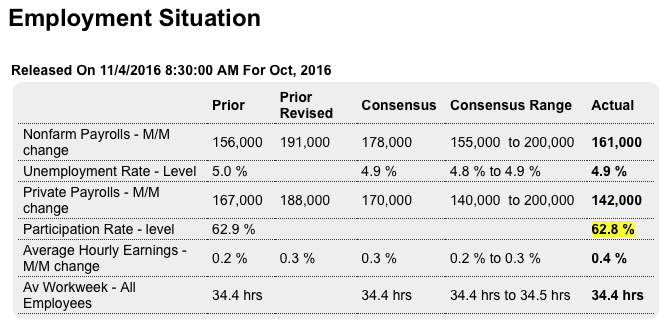
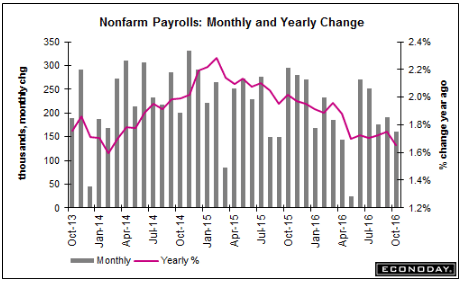
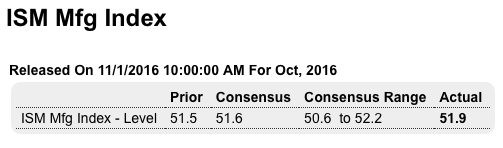
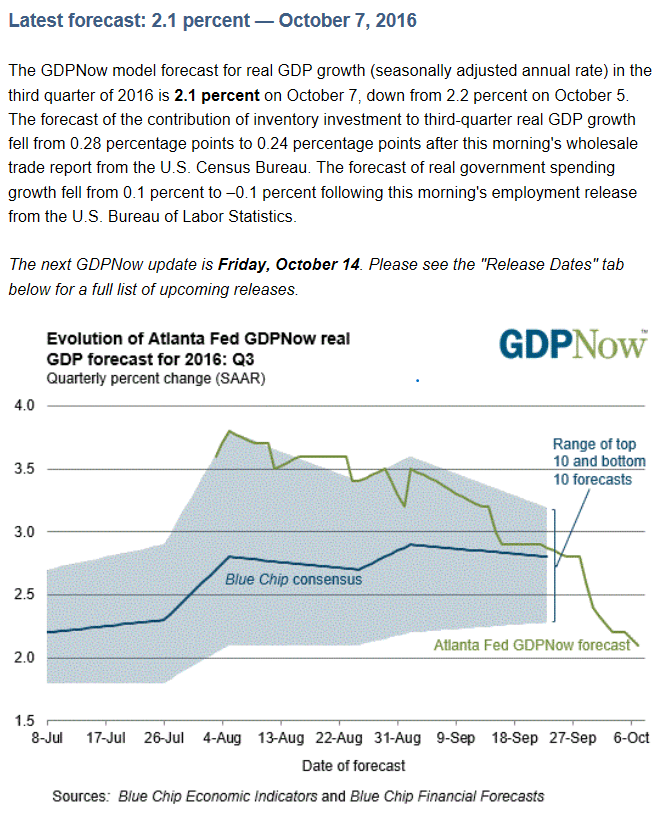
    The September employment report is not that strong and the sigh of relief you hear is coming from the Fed which won’t be faced with a pre-election rate hike. Non-farm payrolls rose 156,000, which is at the low end of expectations, while average hourly earnings don’t look that inflationary, at least not on a monthly basis which is up only 0.2 percent and again at the low end of expectations.

    But there are definitely positives including a rise in the labor participation rate, up 1 tenth to 62.9 percent, which gave a deceptive lift to the unemployment rate that is 1 tenth higher at 5.0 percent. The increasing inclusion of discouraged workers is one of the Fed’s policy objectives and the participation rate points to improvement. Another positive is a rise in the workweek, up to 34.4 hours from 34.3 hours with the manufacturing week also slightly higher in what is a positive indication for September industrial production.

    Manufacturing employment, however, is one of the weak spots in the report, down 13,000 following August’s 16,000 decline. Government payrolls are also a negative, down 11,000 but following a long string of gains. Otherwise the industry breakdown offers mostly good news including a gain for construction, up 23,000 following prior weakness, a 22,000 gain for retail which extends a run of similar gains, and especially a 67,000 rise in professional & business services that includes an outsized gain of 23,000 in temporary help services. This last detail confirms other evidence that employers are having a hard time filling positions.

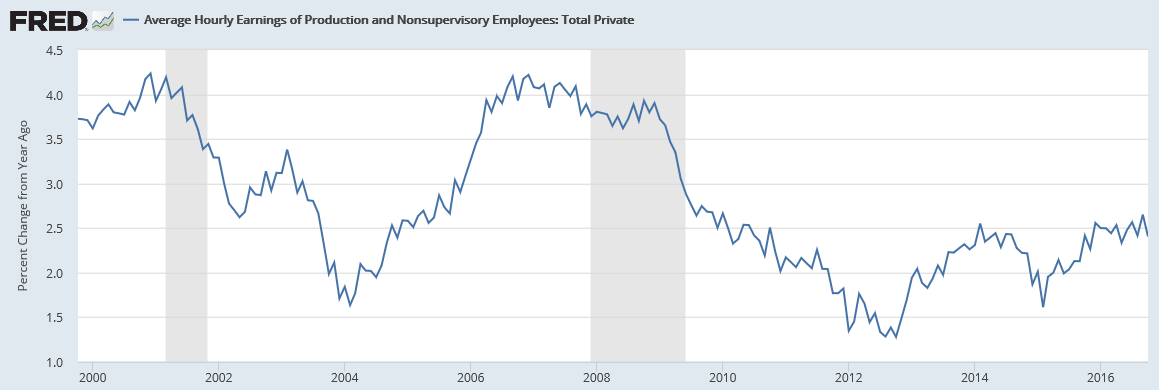
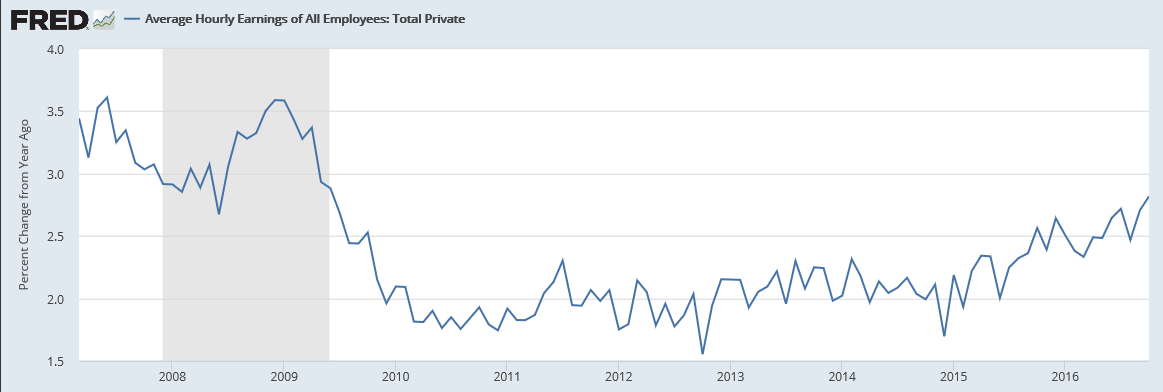
    And there is another positive, and that is movement higher in the year-on-year rate for average hourly earnings, up 2 tenths to 2.6 percent which is still, however, 1 tenth under where it was in July. And with an election coming around, the positives are tame enough. November may be out for a rate hike but today’s report will build expectations, at least for now, for a rate hike at the December FOMC.

    100702
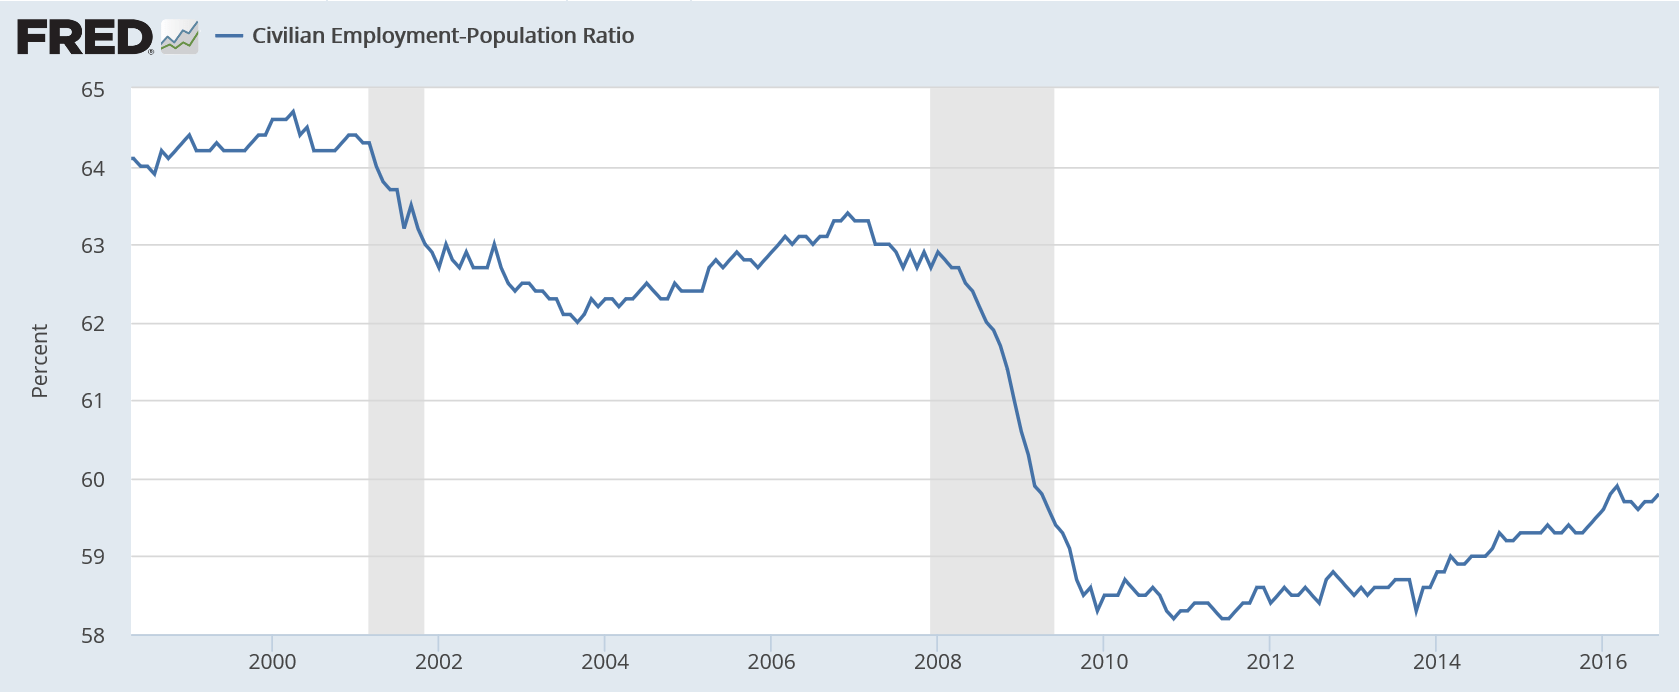
    Employment growth not much ahead of population growth, with a long way to go to catch up to prior levels if in fact the drop was largely cyclical:
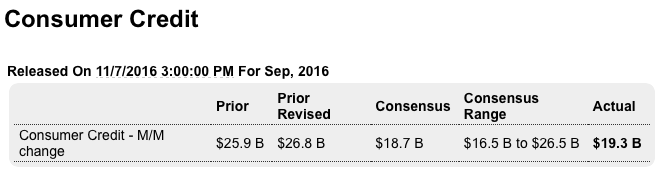
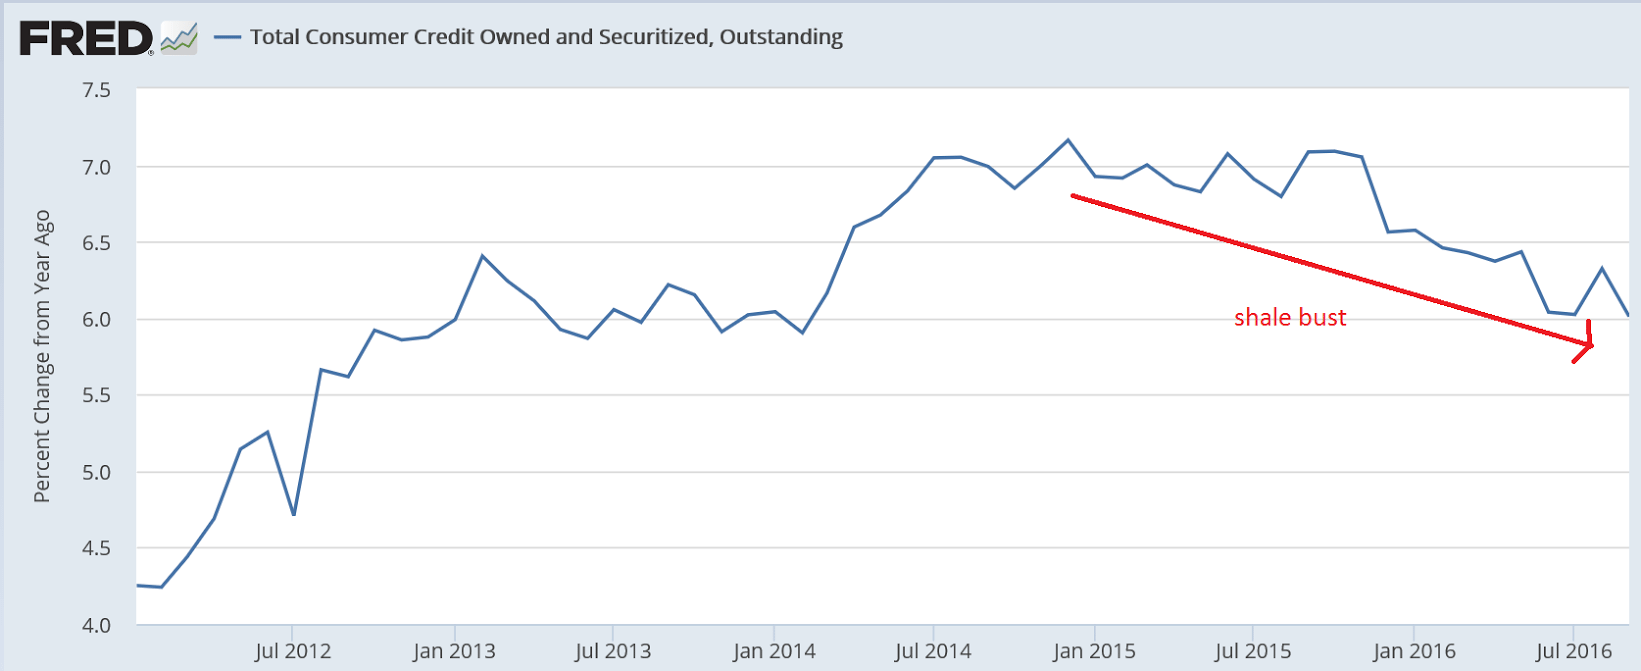
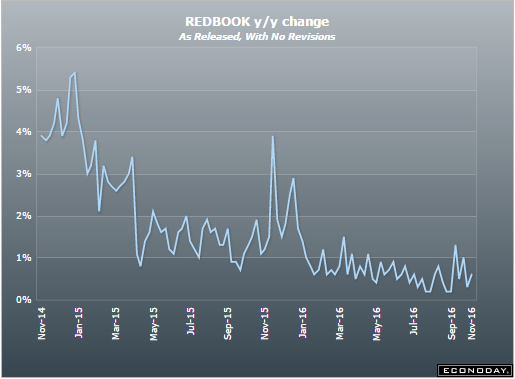
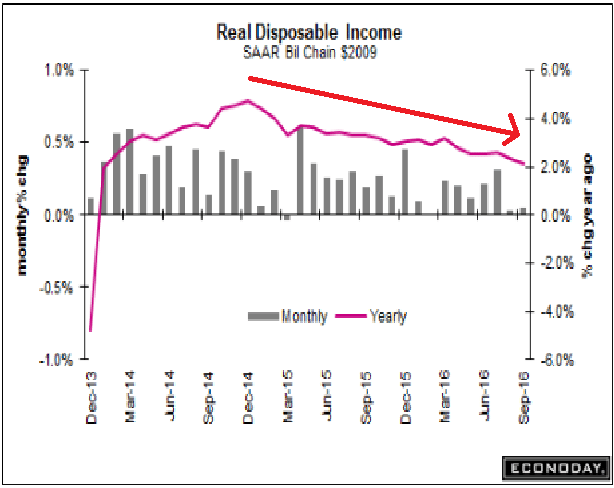
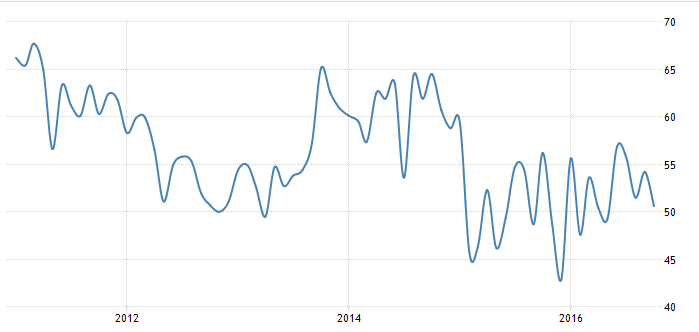
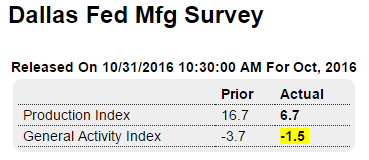
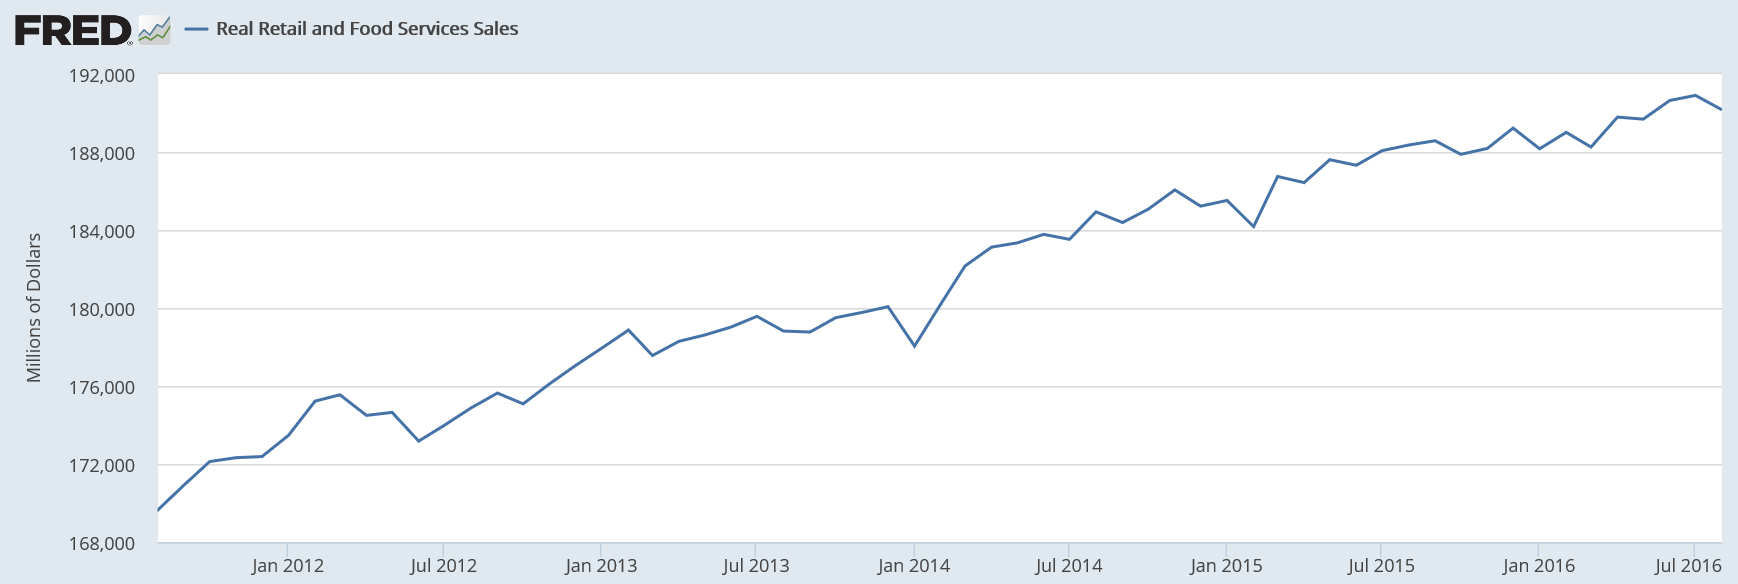
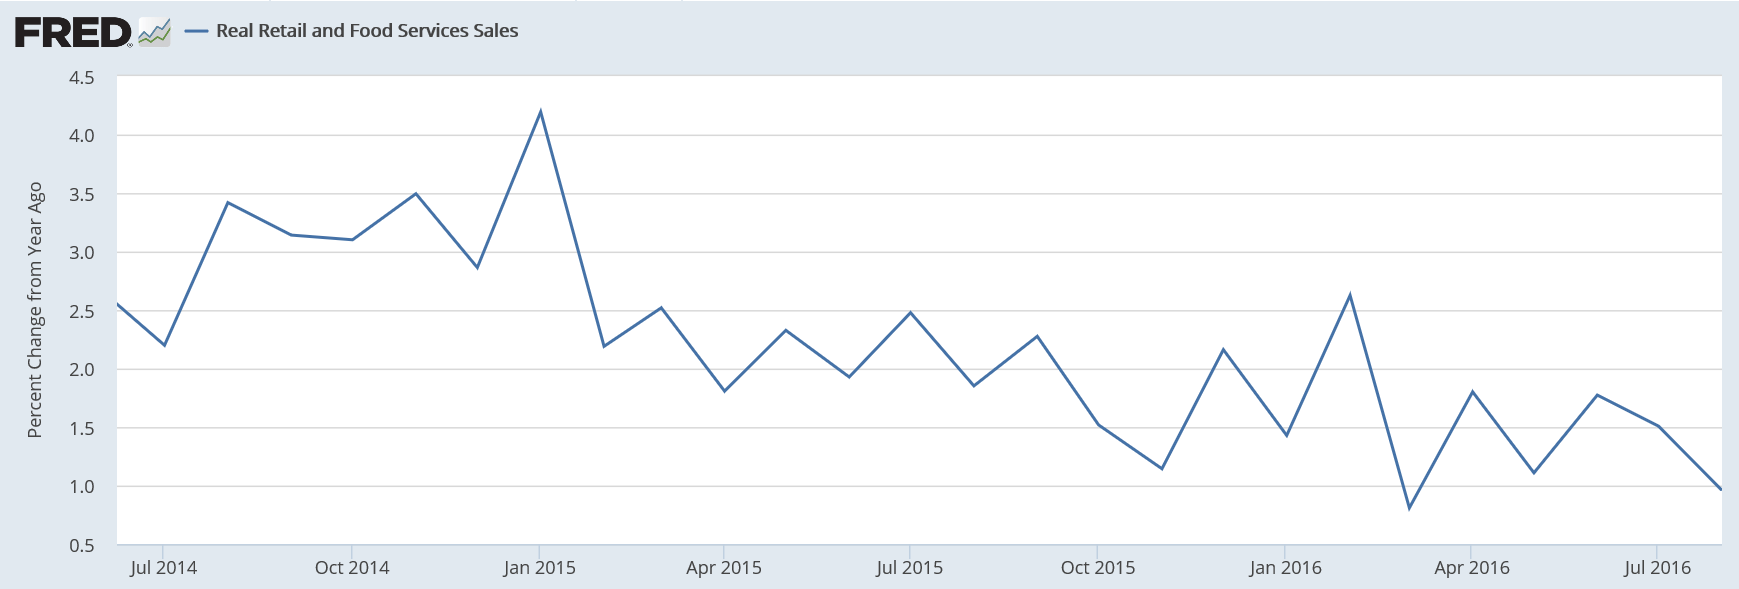
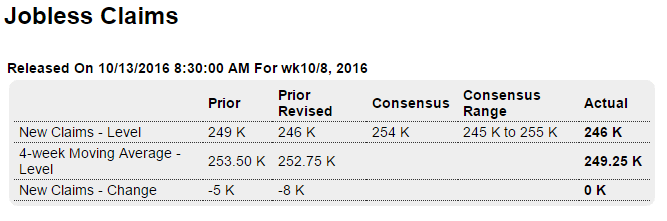
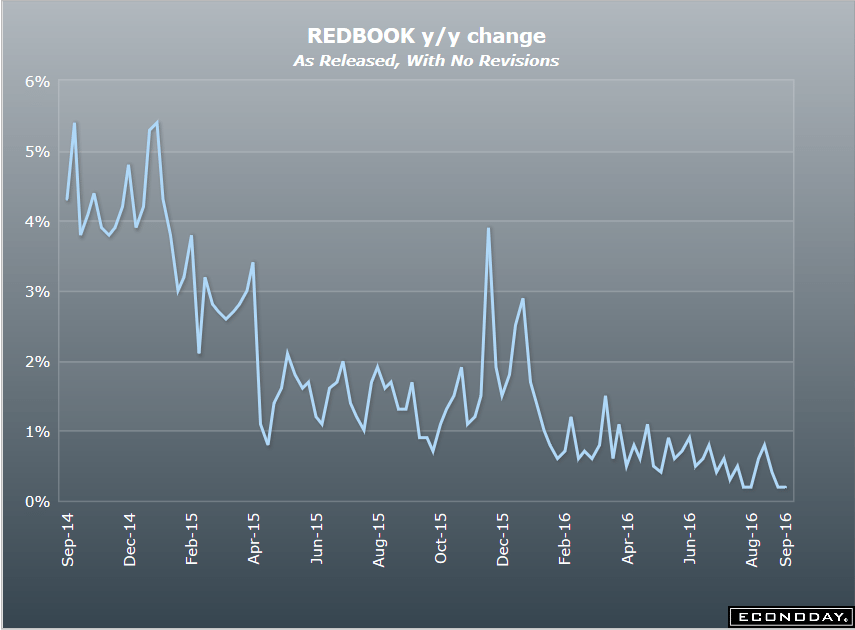
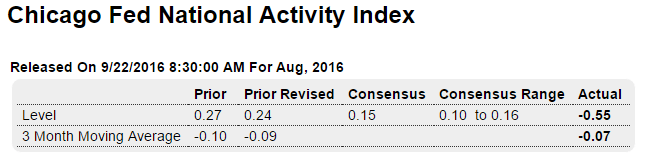
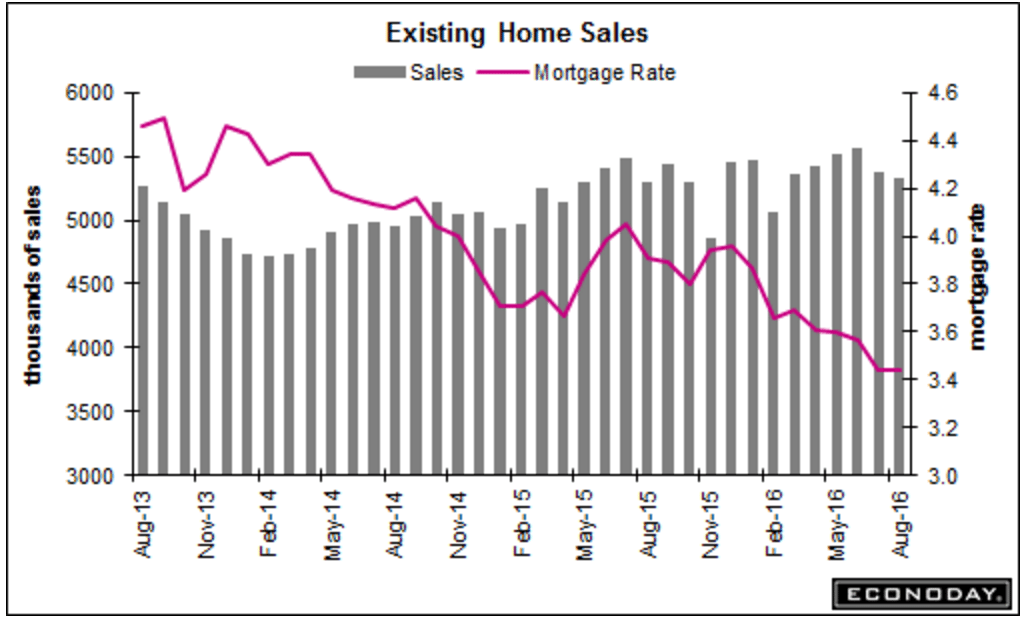
    100703
    Down again:

    100704

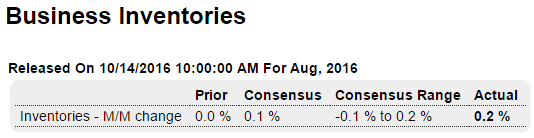
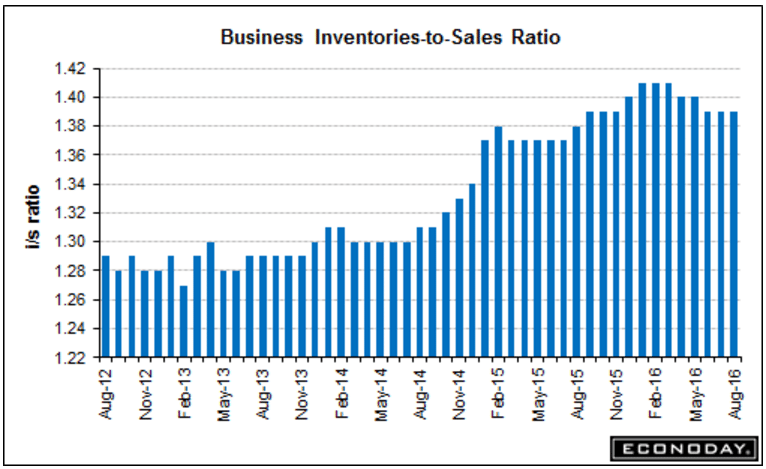
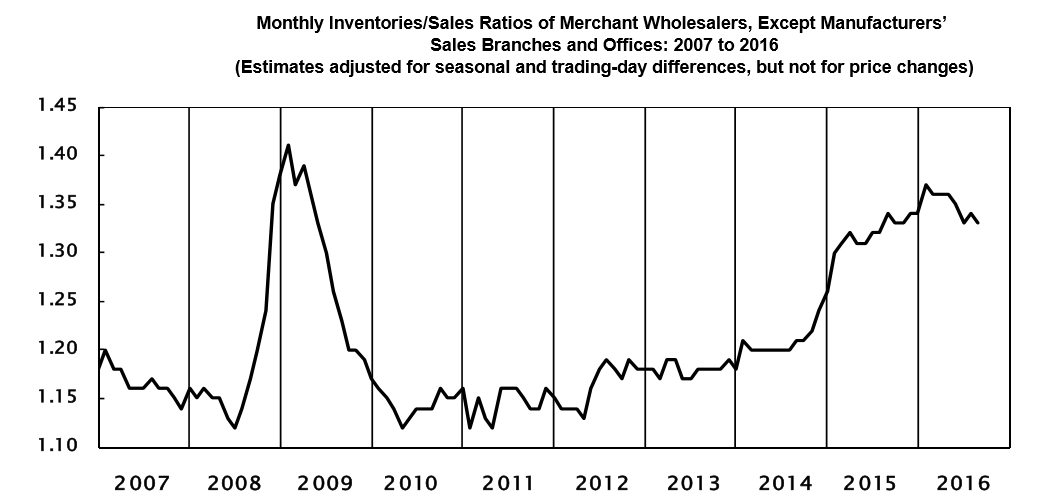
    So it looks like August sales were up a bit but July sales were revised down. And inventories continued to decline, contrary to mainstream forecasts, as the inventory to sales ratio came down .1 but remained elevated:

    MONTHLY WHOLESALE TRADE: SALES AND INVENTORIES August 2016

    Sales.

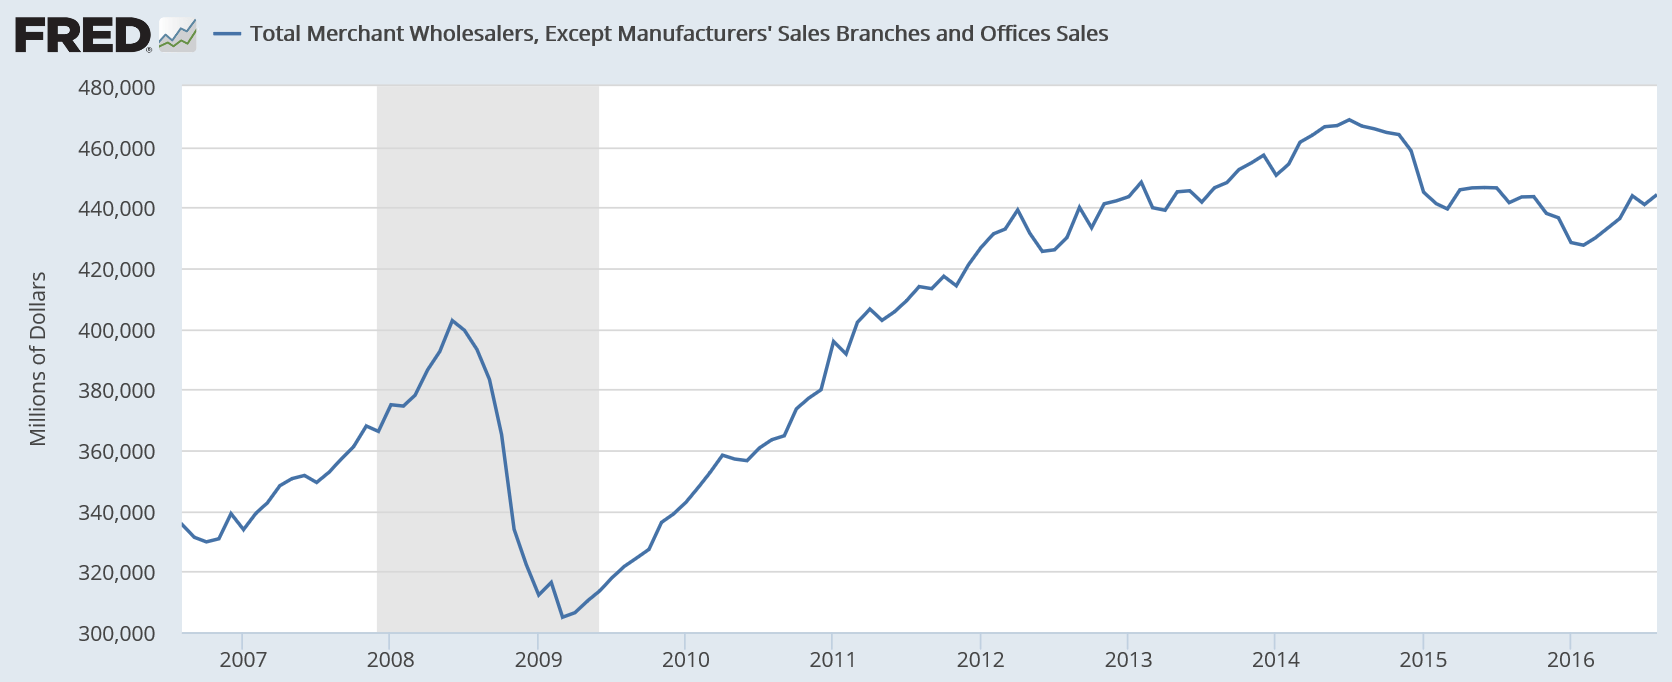
    The U.S. Census Bureau announced today that August 2016 sales of merchant wholesalers, except manufacturers’ sales branches and offices, after adjustment for seasonal variations and trading-day differences but not for price changes, were $444.3 billion, up 0.7 percent (+/-0.5%) from the revised July level and were up 0.6 percent (+/-1.2%)* from the August 2015 level.

    The June 2016 to July 2016 percent change was revised from the preliminary estimate of down 0.4 percent (+/-0.4%)* to down 0.6 percent (+/-0.4%).

    August sales of durable goods were down 0.5 percent (+/-0.7%)* from last month, but were up 0.7 percent (+/-1.8%)* from a year ago.

    Sales of machinery, equipment, and supplies were down 2.7 percent from July.

    Sales of nondurable goods were up 2.0 percent (+/-0.7%) from July and were up 0.5 percent (+/-1.8%)* from last August.

    Sales of farm product raw materials were up 6.7 percent from last month and sales of beer, wine, and distilled alcoholic beverages were up 2.2 percent.

    Inventories.

    Total inventories of merchant wholesalers, except manufacturers’ sales branches and offices, after adjustment for seasonal variations but not for price changes, were $589.1 billion at the end of August, down 0.2 percent (+/-0.4%)* from the revised July level.

    Total inventories are down 0.1 percent (+/-1.8%)* from the revised August 2015 level.

    The July 2016 to August 2016 percent change was revised from the advance estimate of down 0.1 percent (+/-0.4%)* to down 0.2 percent (+/-0.4%)*.

    August inventories of durable goods were up 0.2 percent (+/-0.4%)* from last month, but were down 1.9 percent (+/-1.8%) from a year ago. Inventories of computer and computer peripheral equipment and software were up 1.9 percent from last month. Inventories of nondurable goods were down 0.7 percent (+/-0.5%) from July, but were up 2.8 percent (+/-3.0%)* from last August. Inventories of farm product raw materials were down 7.8 percent from last month and inventories of apparel, piece goods, and notions were down 2.1 percent.

    Inventories/Sales Ratio. The August inventories/sales ratio for merchant wholesalers, except manufacturers’ sales branches and offices, based on seasonally adjusted data, was 1.33. The August 2015 ratio was 1.34.

    100705
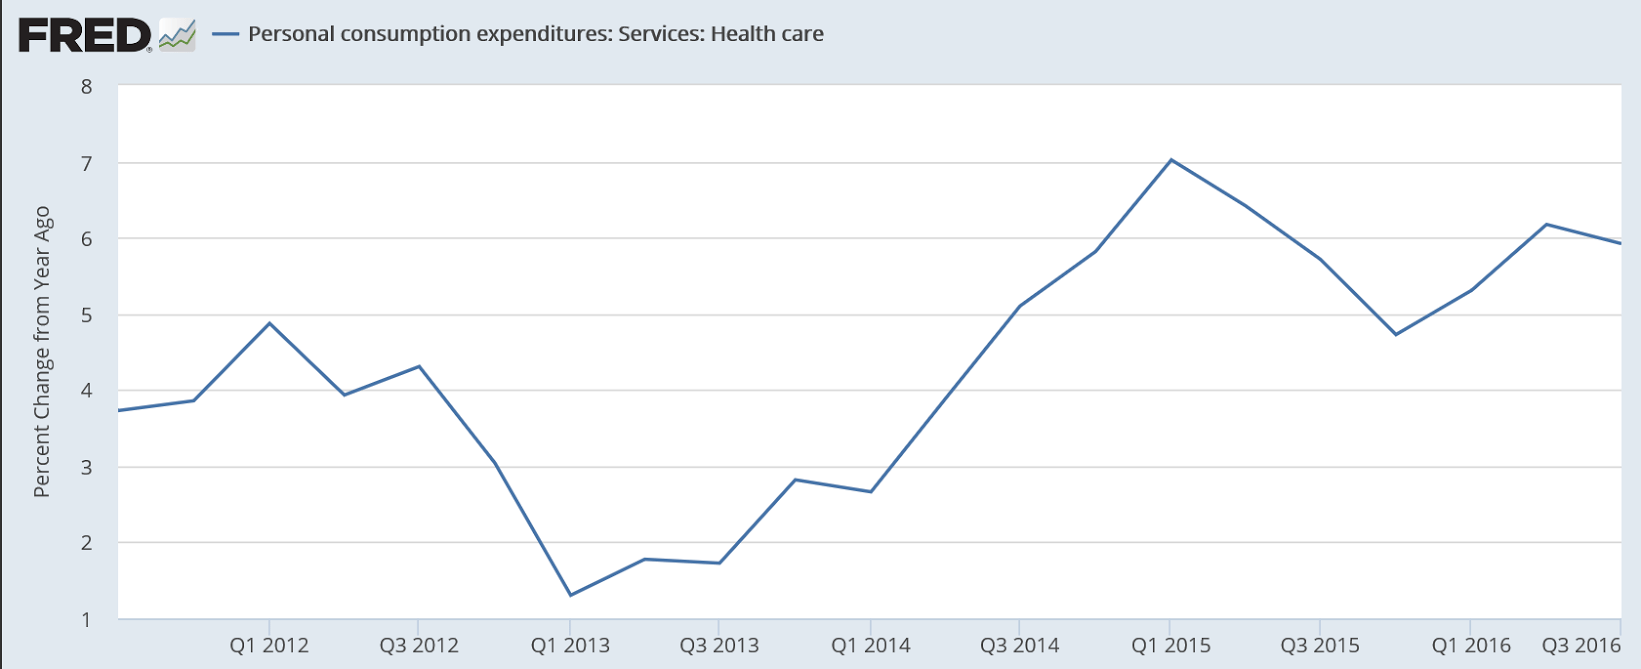
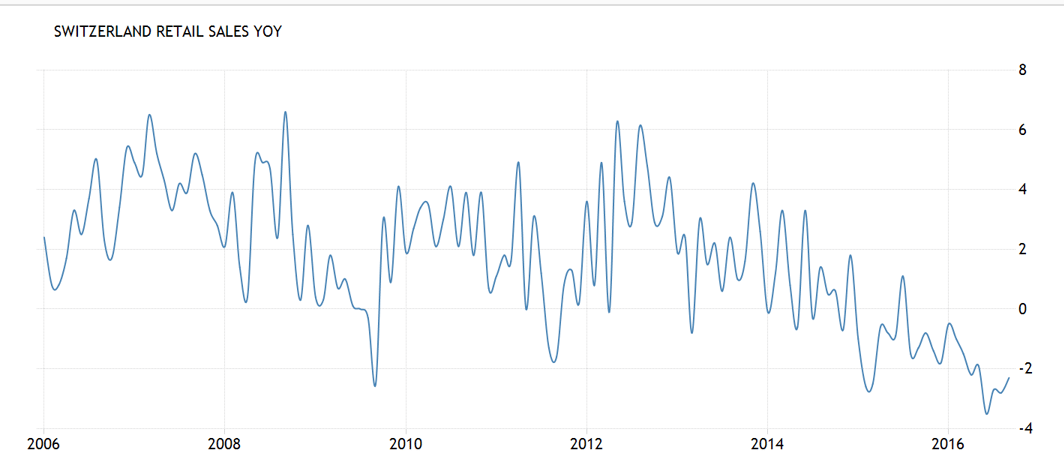
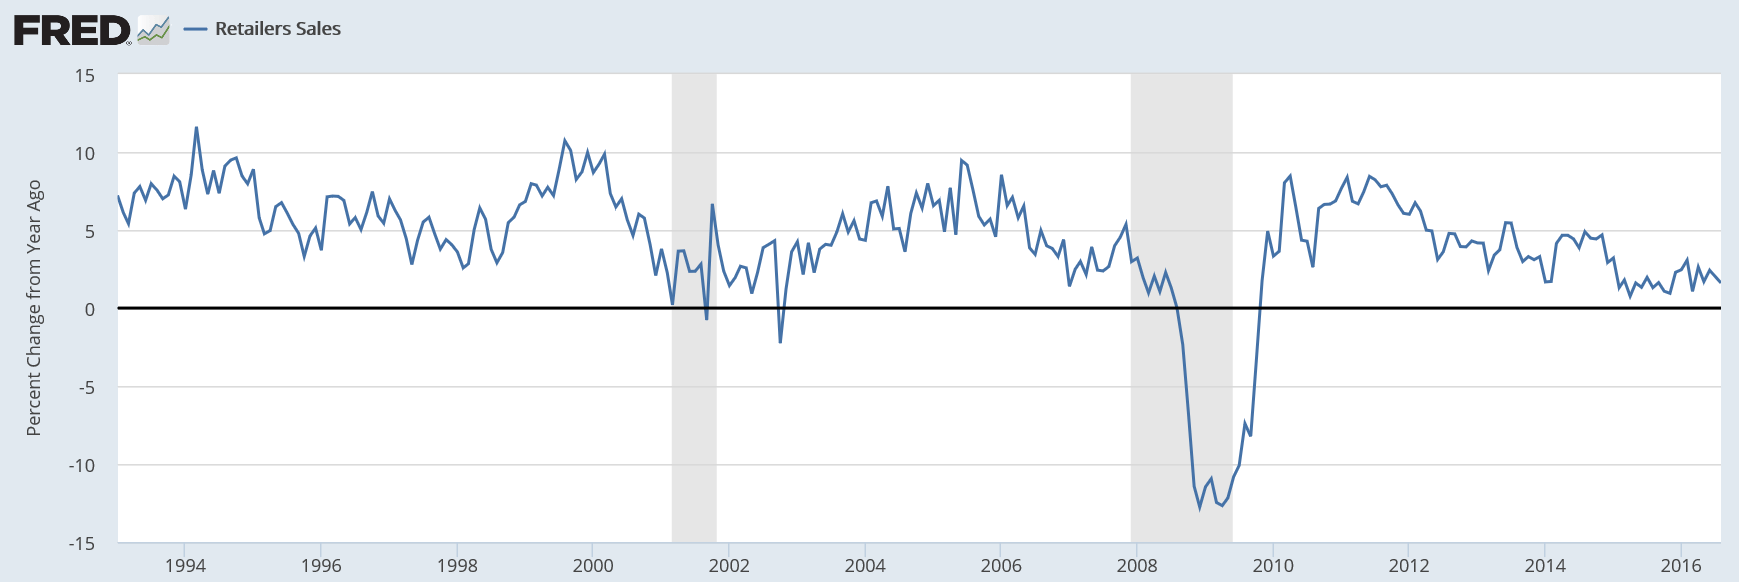
    Sales down about 11.5% in July then up about 8.5 in August, so the ‘average’ for the last two months in this volatile series is looking lower vs last year:

    100706
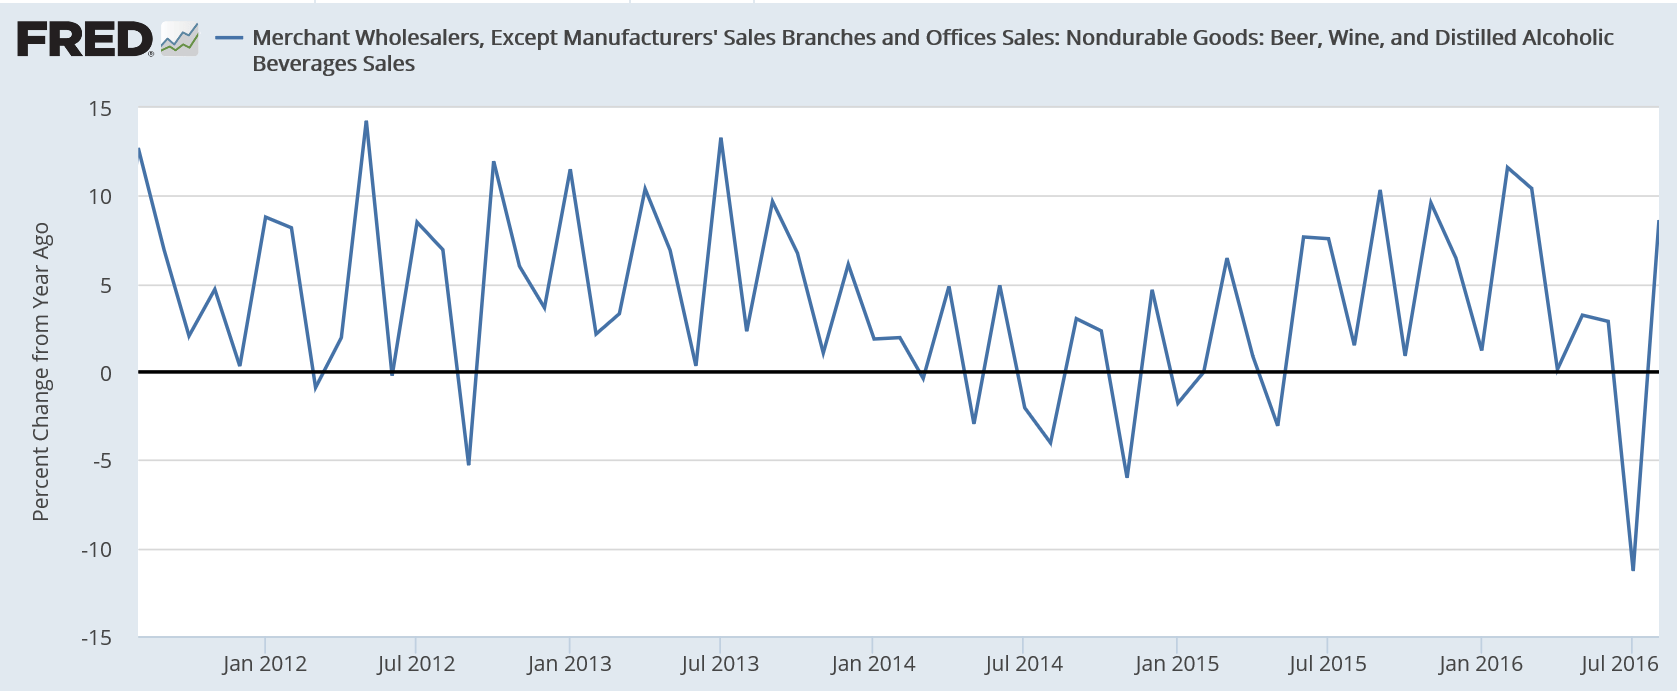
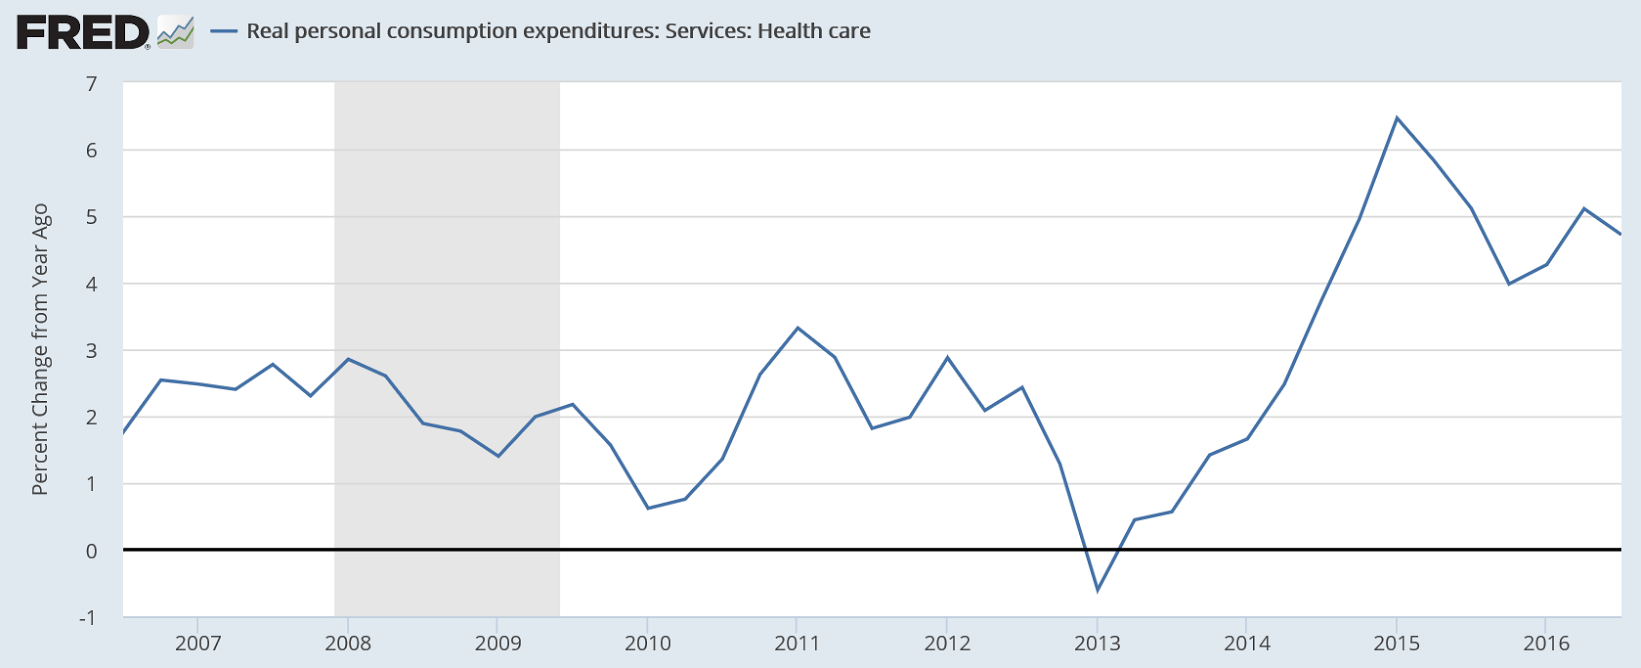
    This is just sales, not adjusted for inflation:

    100707
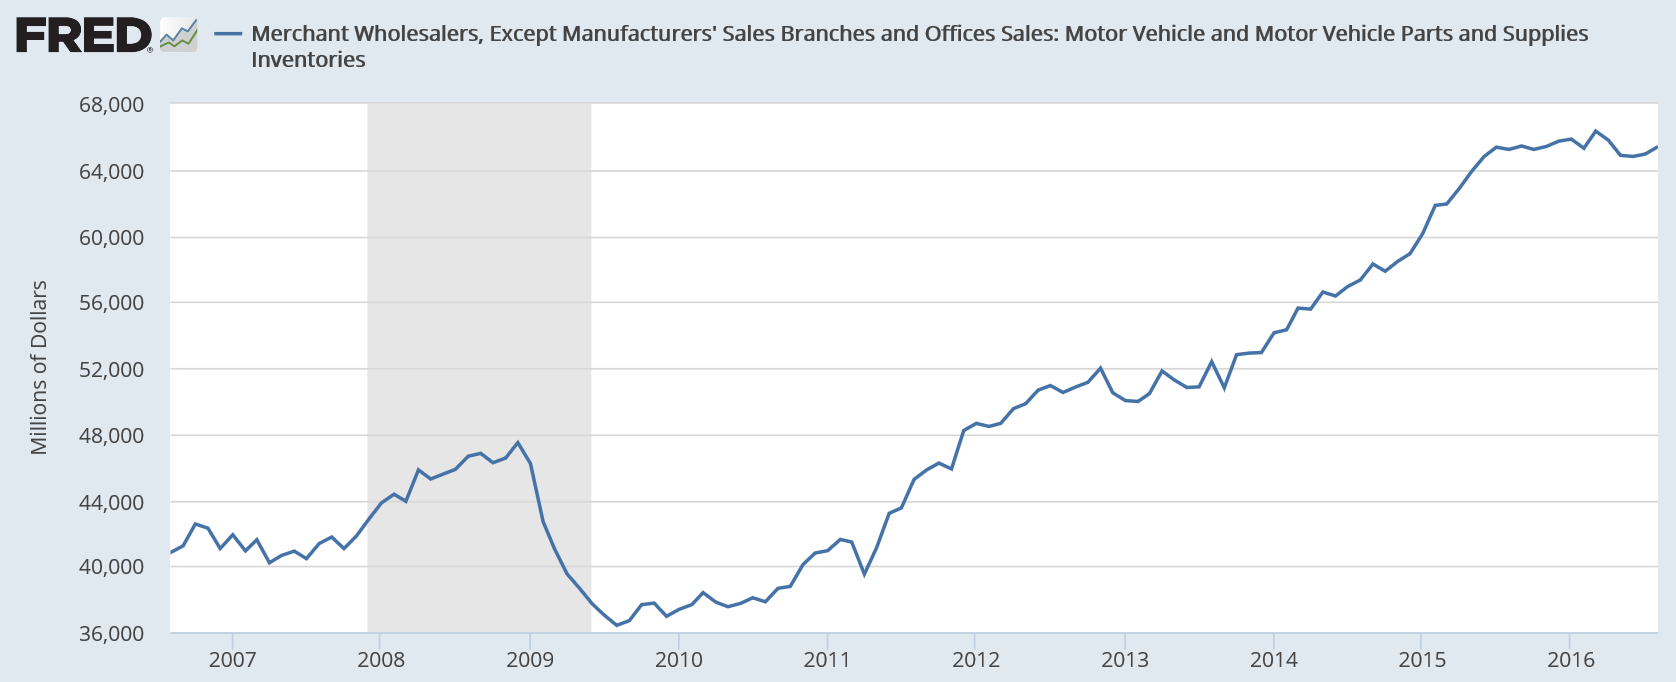
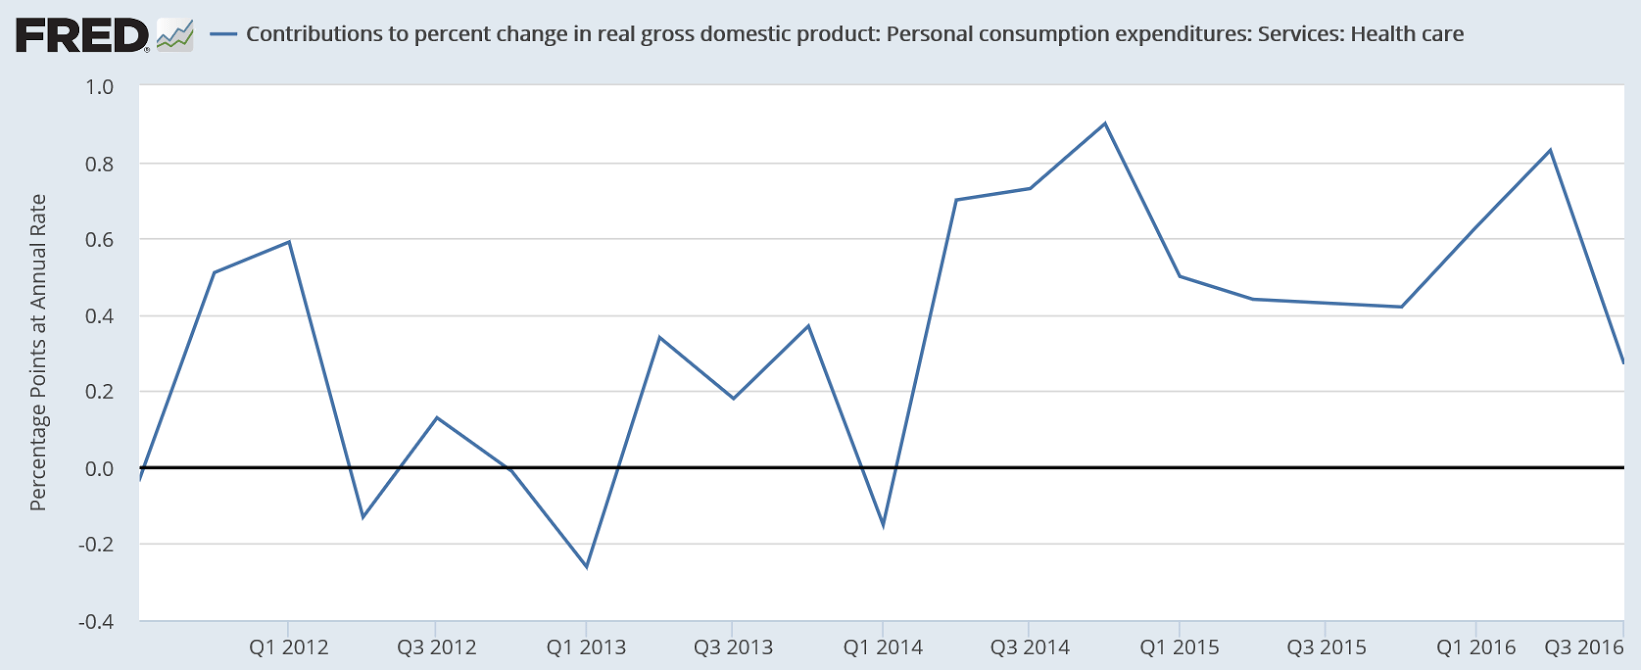
    Auto related inventories are no longer adding to GDP growth:

    100708

    Personal income and spending, ISM Chicago, Consumer sentiment, Atlanta Fed GDP forecast

    The consumer isn’t ‘coming back’ until after deficit spending, public or private, increases to offset unspent income, and ‘putting money into savings’ (below) is better described as ‘increasing borrowing less’. Also, consumption spending includes health care premiums and utility bills, and when they go up it tends to later take away from spending on other things:
    93001

    Highlights

    August was a soft month for the consumer, both for income and especially for spending. Income rose only 0.2 percent in the month as wages & salaries, which had been on a 4-month surge, could inch only 1 tenth higher in August. Consumer spending, which had also been on a 4-month winning streak, came in unchanged as durable goods declined, largely reflecting monthly weakness in vehicle sales, as did non-durable goods, in part reflecting low fuel prices. Service spending advanced, at plus 0.3 percent, but at a slower rate than prior months. Despite the weakness in income, the consumer put money into savings which are at a 5.7 percent rate for a 1 tenth gain and a special factor that held down spending.

    Inflation readings do show more life with the PCE price index up 0.1 percent and the core up 0.2 percent, both 1 tenth better than the prior month. Year-on-year, the overall measure rose 2 tenths to 1.0 percent with the core up 1 tenth to 1.7 percent and inching toward the Fed’s 2 percent goal.

    For policy makers, what strength there is in prices is probably offset by the softness in income and spending. But the results of this report are no surprise, ultimately reflecting what was only a moderate gain for payrolls in August.

    93002
    The shale boom reversed the slide into recession, the shale bust reversed the shale boom and it’s back down again:

    93003
    Both up a bit more than expected:

    93004

    93005
    Down again, for reasons previously discussed, likely more to come for same reasons:

    93006

    State tax receipts, Redbook retail sales, Case-Shiller house prices, PMI services, Richmond Fed manufacturing, consumer confidence

    This too has followed the shale boom/bust cycle and is headed lower:

    92701
    No recovery here:

    92702
    This looks back over the last three months and seems to be decelerating from already modest levels:

    92703

    92704
    Up a bit but still low:

    92705
    The flash Markit US Services PMI came in at 51.9 in September of 2016 from 51 in August, reaching the highest figure in five months and above market expectations of 51.1. Activity picked up for the first time in three months due to ongoing new business growth while new orders, employment and inflationary pressures eased.
    92706
    Still contracting:

    92707
    Here some good news! But as per the chart something changed after the collapse in oil capex? Maybe because confidence is one man, one vote, not one dollar, one vote?
    92709

    92708

    Fed comments, Chicago Fed, Existing home sales

    So growth and employment prospects are lower than those of their prior meeting, when they didn’t raise rates. And their forecasts continue to decelerate:

    Fed Trims Interest-Rate, Growth Forecasts

    By Michael S. Derby

    Sept 21 (WSJ) — Federal Reserve officials cut their growth forecast for this year to 1.8%, from 2.0% in June, and held steady their view for next year at 2.0%. Notably, they lowered their long-run view on the economy’s growth rate to 1.8% from 2%. In their forecasts, central bankers’ median projection for the jobless rate this year rose slightly to 4.8%, versus 4.7% in June. For 2017 officials see the jobless rate, now at 4.9%, coming in at 4.6%. The long run jobless rate is still seen at 4.8%. For this year they project the personal-consumption expenditures price index to come in at 1.3%, from June’s 1.4%, with 2017 inflation at 1.9%. Inflation will go back to desired 2% levels in 2018.

    92201
    Seems the Fed is still doesn’t understand that it’s always an unspent income story.

    Fed chief Yellen’s news conference after FOMC meeting

    By Andrea Ricci

    Sept 21 (Reuters) — “Investment spending really has been quite weak for some time and we are really not certain exactly what is causing that. Part of it of course has been the huge contraction in drilling activity associated with falling oil prices, but the weakness in investment spending extends beyond that sector and I’m not certain of exactly what explains that … I’m not aware of evidence that suggests that it’s political uncertainty.” “Since monetary policy is only modestly accommodative, there appears little risk of falling behind the curve in the near future, and gradual increases in the federal funds rate will likely be sufficient to get to a neutral policy stance over the next few years.

    3 month average remains in negative territory:

    92202

    Highlights

    August was a soft month for the bulk of the economy, a monthly dip that is now confirmed by the national activity index which fell to minus 0.55 from July’s revised plus 0.24. All four main components posted monthly declines and all four are in the negative column. Production-related indicators, after a brief pop higher into the plus column in July, pulled the index down 0.33 in the month. The decline here largely reflects broad weakness in the August production industrial report. Employment-related indicators came in at minus 0.09 followed by personal consumption & housing, at minus 0.08, and sales, orders & inventories at minus 0.05. What indications we have for September are limited but do include this morning’s dip in jobless claims which is a positive indication for the month’s employment component.

    Another disappointment for the hawks:

    92203

    Highlights

    Prices are soft and resales aren’t coming into the market. Existing home sales fell a monthly 0.9 percent in August to a 5.33 million annualized rate, roughly the same rate where it was a year ago at 5.29 million for a thin 0.8 percent gain. And the single-family component isn’t showing much life, down 2.3 percent in the month and up only 0.6 percent on the year. Saving the August report are condos which jumped 10.5 percent in the month to a 630,000 rate for a year-on-year gain of 1.6 percent.

    Supply is very thin and is holding down sales. Supply on a monthly basis is at 4.6 months with 3.3 percent fewer existing homes for sale, at 2.04 million from July’s 2.11 million. Prices aren’t offering great incentives for possible sellers, with the median down 1.3 percent in the month to $240,200 for a year-on-year rate of 5.1 percent which, however, is still respectable in a low wage growth economy.

    There hasn’t been a lot of action this year in the resale market though the new home market is definitely showing life and, by itself, is likely to make housing a modest positive for the 2016 economy. In a final note, regional sales data are evenly balanced in today’s report, ranging from no year-on-year change for the Northeast to only a 0.9 percent gain for the South.

    92204