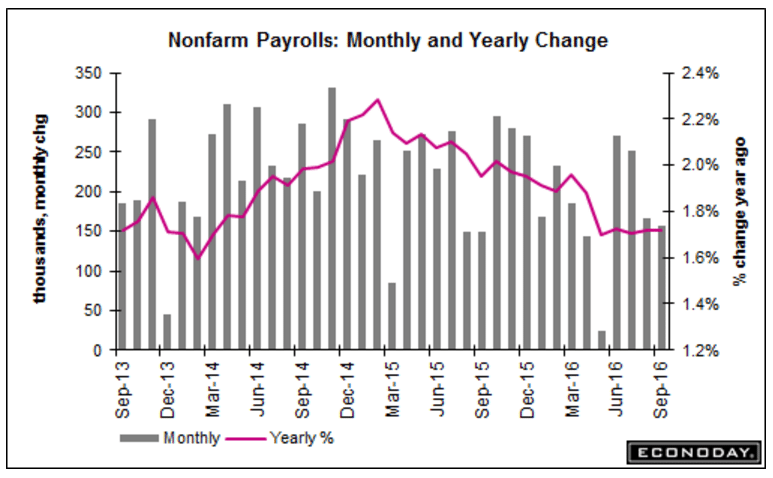
Less than expected, July/August total revised down, earnings gain less than expected. Yes, unemployment was up because the labor force increased, but arguably it was functionally that large in the months before, etc, which means, functionally, unemployment had been that much higher all along, etc. etc. and all to my suspicions that the drop in the participation rate might be close to entirely cyclical, meaning the ‘slack’ might be equiv. to a headline unemployment rate well north of 7%, and the U6 rate well north of 12%. Also recall that the birth/death’ model that estimates jobs from new business formations tends to overstate employment growth when employment growth is declining, so don’t be surprised by more downward revisions:
Highlights
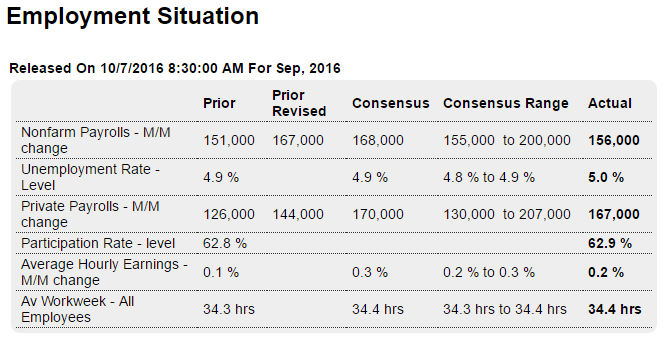
The September employment report is not that strong and the sigh of relief you hear is coming from the Fed which won’t be faced with a pre-election rate hike. Non-farm payrolls rose 156,000, which is at the low end of expectations, while average hourly earnings don’t look that inflationary, at least not on a monthly basis which is up only 0.2 percent and again at the low end of expectations.
But there are definitely positives including a rise in the labor participation rate, up 1 tenth to 62.9 percent, which gave a deceptive lift to the unemployment rate that is 1 tenth higher at 5.0 percent. The increasing inclusion of discouraged workers is one of the Fed’s policy objectives and the participation rate points to improvement. Another positive is a rise in the workweek, up to 34.4 hours from 34.3 hours with the manufacturing week also slightly higher in what is a positive indication for September industrial production.
Manufacturing employment, however, is one of the weak spots in the report, down 13,000 following August’s 16,000 decline. Government payrolls are also a negative, down 11,000 but following a long string of gains. Otherwise the industry breakdown offers mostly good news including a gain for construction, up 23,000 following prior weakness, a 22,000 gain for retail which extends a run of similar gains, and especially a 67,000 rise in professional & business services that includes an outsized gain of 23,000 in temporary help services. This last detail confirms other evidence that employers are having a hard time filling positions.
And there is another positive, and that is movement higher in the year-on-year rate for average hourly earnings, up 2 tenths to 2.6 percent which is still, however, 1 tenth under where it was in July. And with an election coming around, the positives are tame enough. November may be out for a rate hike but today’s report will build expectations, at least for now, for a rate hike at the December FOMC.
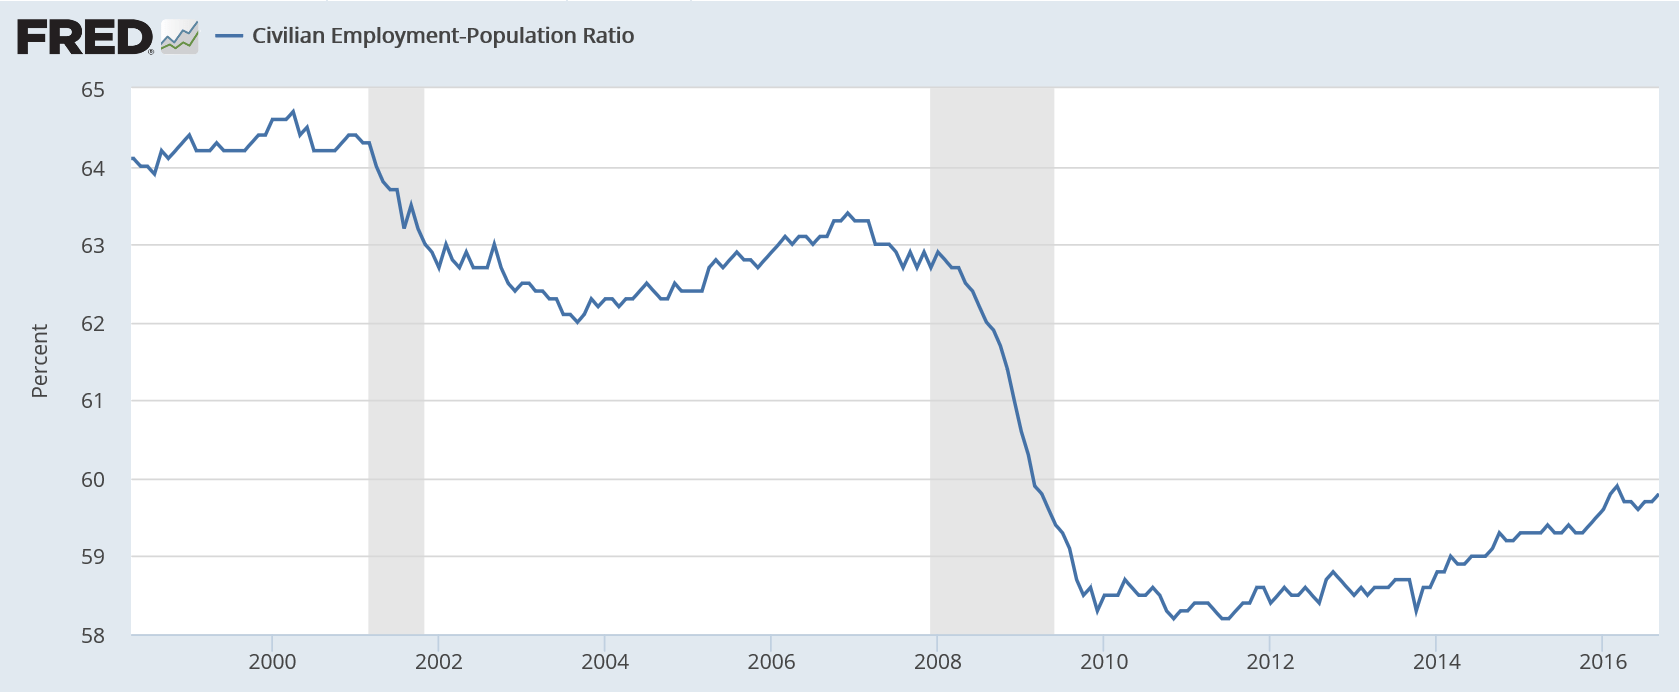
Employment growth not much ahead of population growth, with a long way to go to catch up to prior levels if in fact the drop was largely cyclical:
Down again:
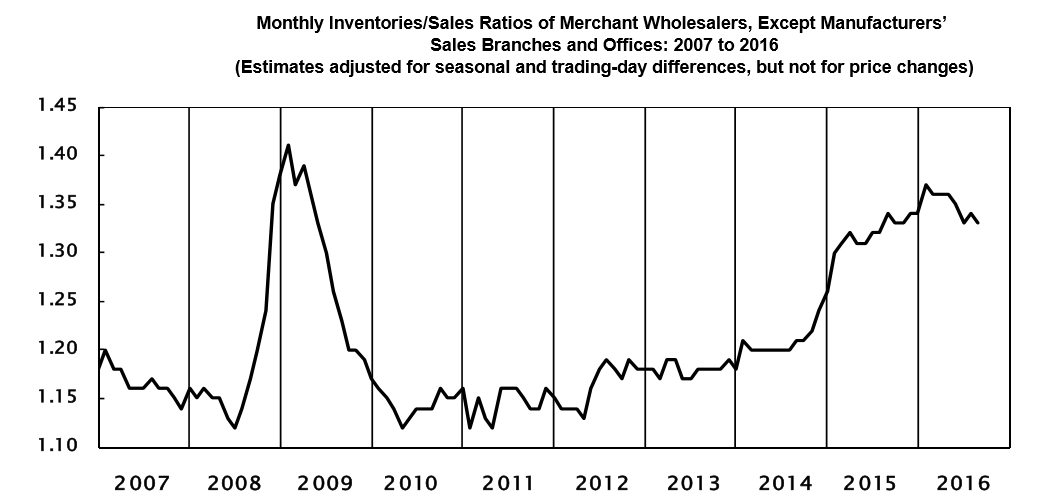
So it looks like August sales were up a bit but July sales were revised down. And inventories continued to decline, contrary to mainstream forecasts, as the inventory to sales ratio came down .1 but remained elevated:
MONTHLY WHOLESALE TRADE: SALES AND INVENTORIES August 2016
Sales.
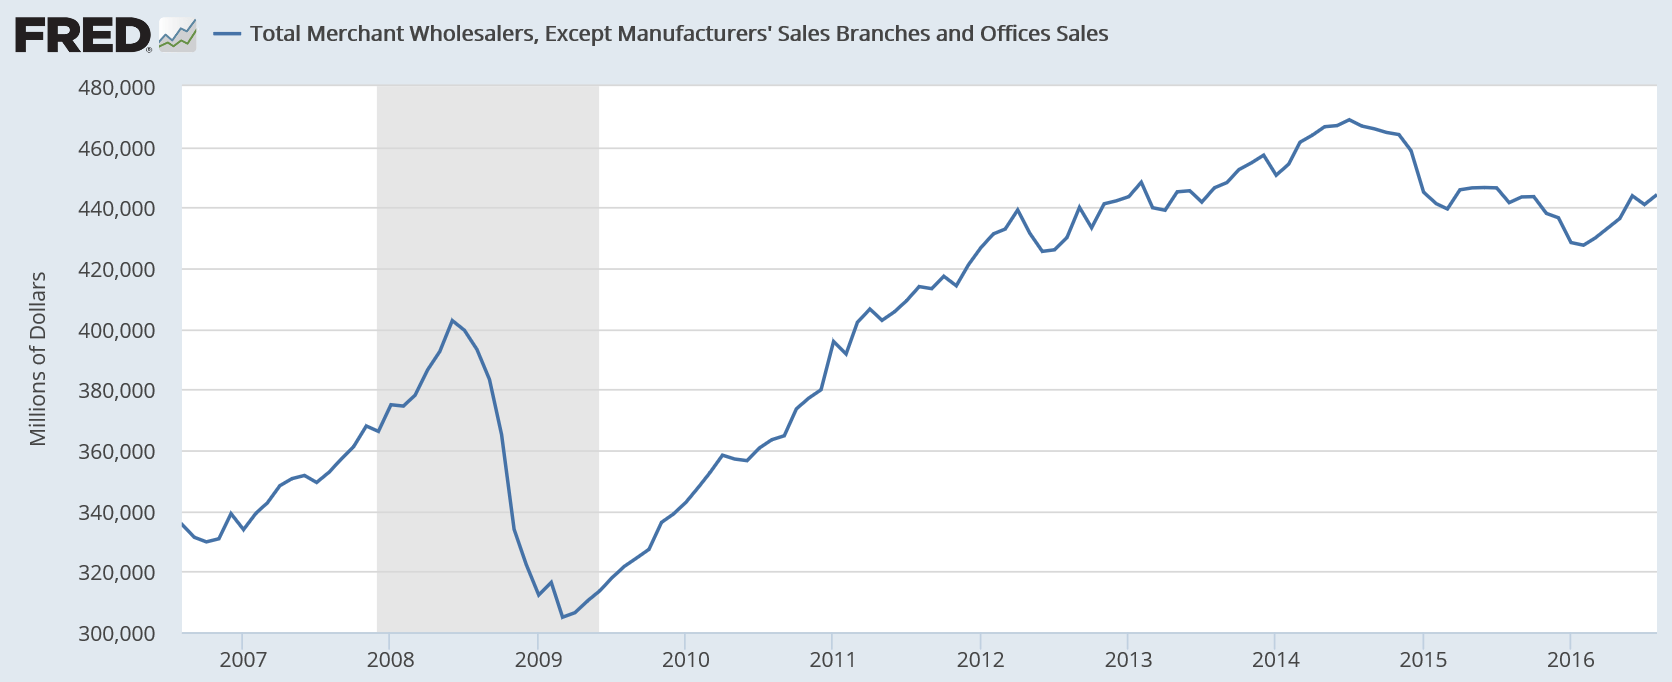
The U.S. Census Bureau announced today that August 2016 sales of merchant wholesalers, except manufacturers’ sales branches and offices, after adjustment for seasonal variations and trading-day differences but not for price changes, were $444.3 billion, up 0.7 percent (+/-0.5%) from the revised July level and were up 0.6 percent (+/-1.2%)* from the August 2015 level.
The June 2016 to July 2016 percent change was revised from the preliminary estimate of down 0.4 percent (+/-0.4%)* to down 0.6 percent (+/-0.4%).
August sales of durable goods were down 0.5 percent (+/-0.7%)* from last month, but were up 0.7 percent (+/-1.8%)* from a year ago.
Sales of machinery, equipment, and supplies were down 2.7 percent from July.
Sales of nondurable goods were up 2.0 percent (+/-0.7%) from July and were up 0.5 percent (+/-1.8%)* from last August.
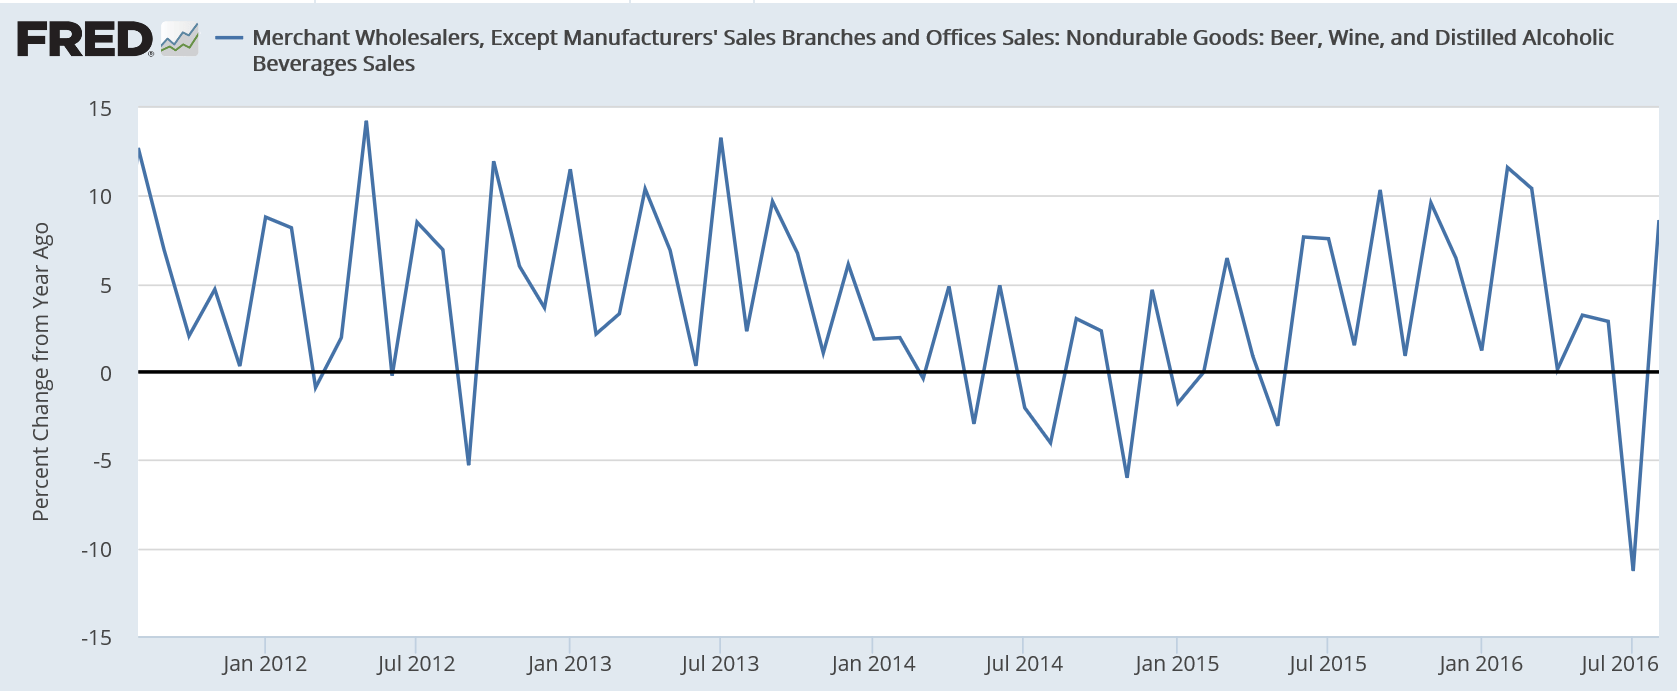
Sales of farm product raw materials were up 6.7 percent from last month and sales of beer, wine, and distilled alcoholic beverages were up 2.2 percent.
Inventories.
Total inventories of merchant wholesalers, except manufacturers’ sales branches and offices, after adjustment for seasonal variations but not for price changes, were $589.1 billion at the end of August, down 0.2 percent (+/-0.4%)* from the revised July level.
Total inventories are down 0.1 percent (+/-1.8%)* from the revised August 2015 level.
The July 2016 to August 2016 percent change was revised from the advance estimate of down 0.1 percent (+/-0.4%)* to down 0.2 percent (+/-0.4%)*.
August inventories of durable goods were up 0.2 percent (+/-0.4%)* from last month, but were down 1.9 percent (+/-1.8%) from a year ago. Inventories of computer and computer peripheral equipment and software were up 1.9 percent from last month. Inventories of nondurable goods were down 0.7 percent (+/-0.5%) from July, but were up 2.8 percent (+/-3.0%)* from last August. Inventories of farm product raw materials were down 7.8 percent from last month and inventories of apparel, piece goods, and notions were down 2.1 percent.
Inventories/Sales Ratio. The August inventories/sales ratio for merchant wholesalers, except manufacturers’ sales branches and offices, based on seasonally adjusted data, was 1.33. The August 2015 ratio was 1.34.
Sales down about 11.5% in July then up about 8.5 in August, so the ‘average’ for the last two months in this volatile series is looking lower vs last year:
This is just sales, not adjusted for inflation:
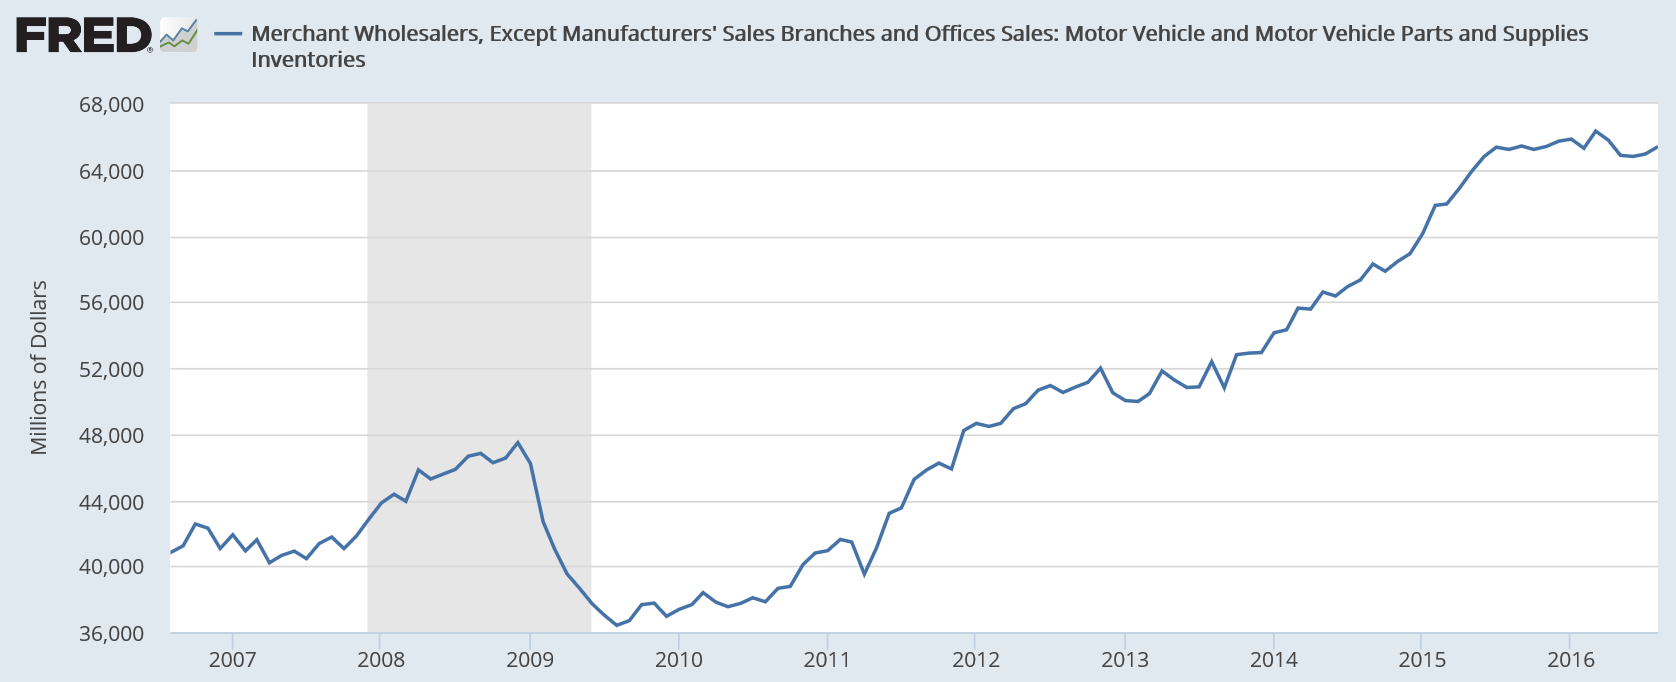
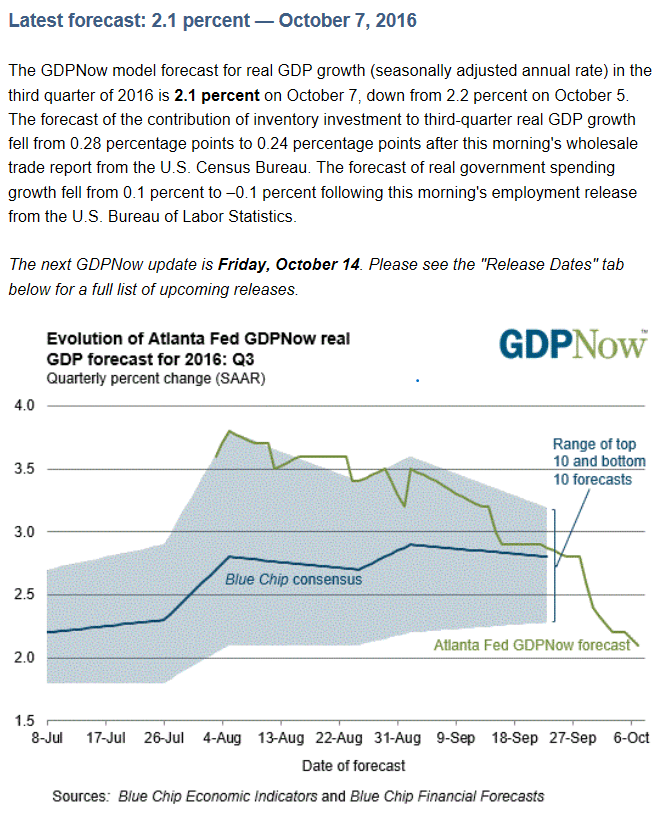
Auto related inventories are no longer adding to GDP growth:
