Total vehicle sales year over year showed some post winter bounce.
The narrative was that March started off slow but picked up due to large incentives for the last week.
We’ll see if it all holds up for April.
Full size image
Full size image
Full size image
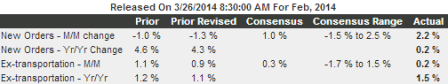
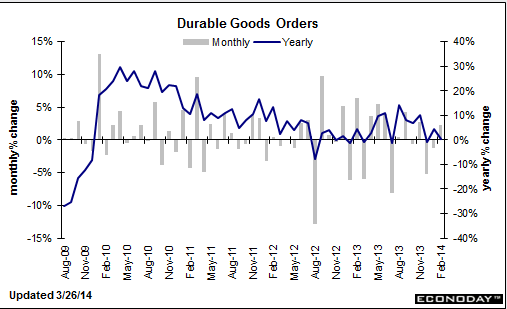
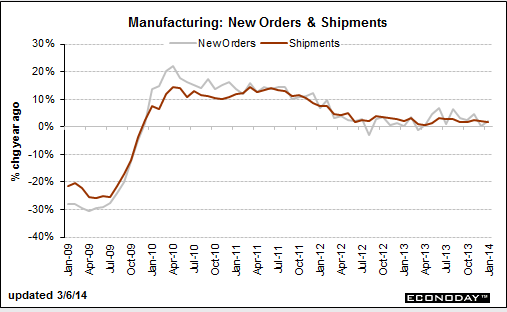
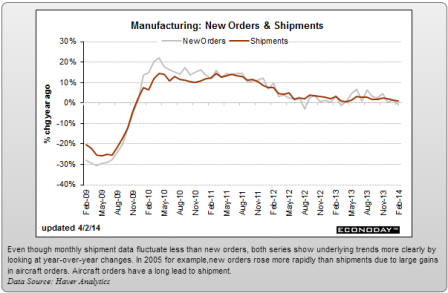
Factory orders ‘bounced’ from large declines but not yet enough to ‘make up’ for the declines.
And regarding capital goods, as with construction measures, I remain concerned that what looked like a year end spike was tax driven and ‘borrowed’ from this year.
Highlights
Factory orders bounced back strongly in February, up 1.6 percent to edge above the high end of the Econoday consensus. The month got a major lift from a 13.4 percent upswing in commercial aircraft orders. A 3.0 percent gain in motor vehicle orders also helped the total. But the total excluding transportation orders, which is a closely tracked reading, is also healthy, up 0.7 percent following 0.1 percent declines in the prior two months.
There is, however, a negative in the February numbers and that’s a sizable 1.4 percent decline in nondefense capital goods orders excluding aircraft. This is considered a core reading on the outlook for business investment. February’s decline more than reverses a 0.8 percent rise in January. Orders for this reading were especially weak in December, at minus 1.6 percent.
Other data include a weather-related bounce in shipments, to plus 0.9 percent following January’s 0.7 percent decline. Inventories rose 0.7 percent, in line with shipments and keeping the factory sector’s inventory-to-shipment ratio unchanged at 1.30. Unfilled orders are a positive, up 0.3 percent.
This report is mostly positive if it weren’t the decline underway in core capital goods orders, a decline that points to weakness in the business outlook. Early indications on the manufacturing for March have also been mostly positive, with the exception of yesterday’s slowing in the ISM employment index.

Full size image
Full size image
Full size image
Full size image
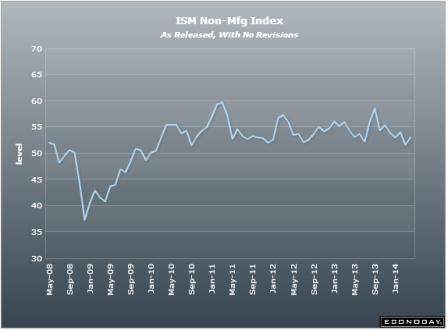
Highlights
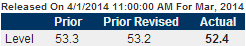
Global manufacturing has softened in recent months. At 52.4 in March, down from 53.2 in February, the J.P.Morgan Global Manufacturing PMI fell to a five-month low, but remained above its average for the current 16-month sequence of expansion.
Global manufacturing production increased for the seventeenth consecutive month in March. However, the rate of expansion eased to a five-month low, mainly on the back of a slowdown in Asia. Growth of total new orders also eased slightly, despite improved inflows of new export business.
Full size image
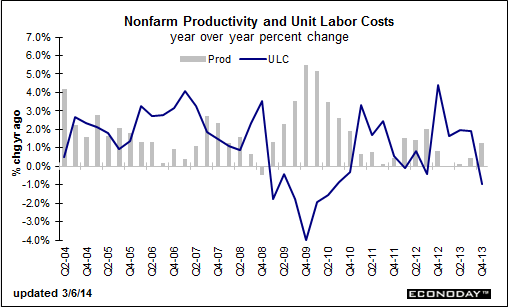
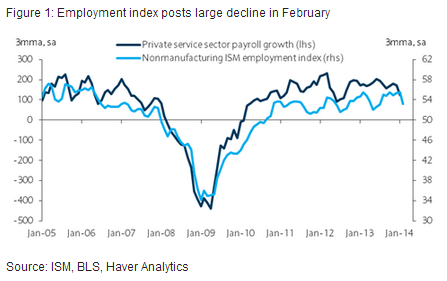
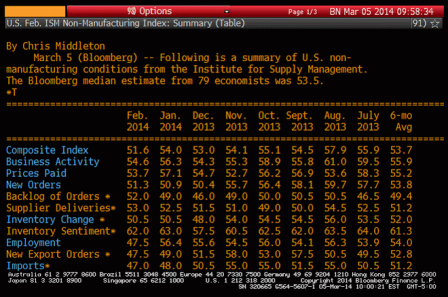
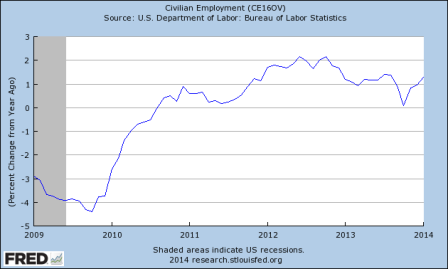
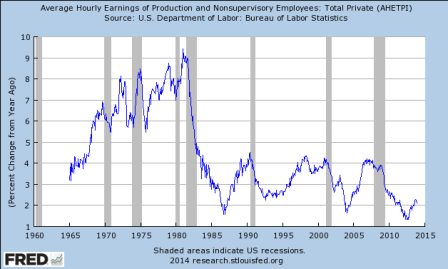
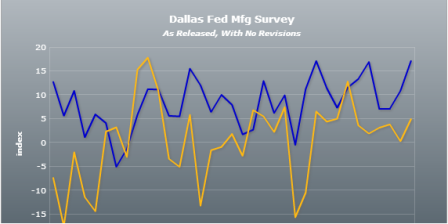
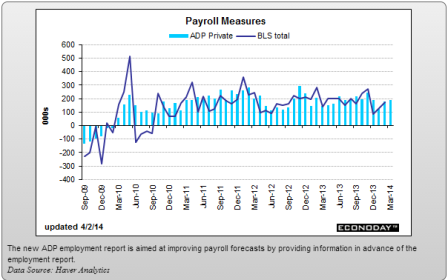
Employment, generally a lagging indicator, was up some, but the chart still seems ‘uninspiring’ at best:
Full size image
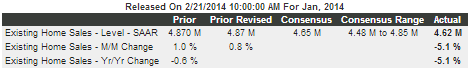
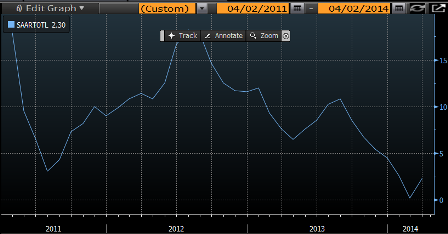
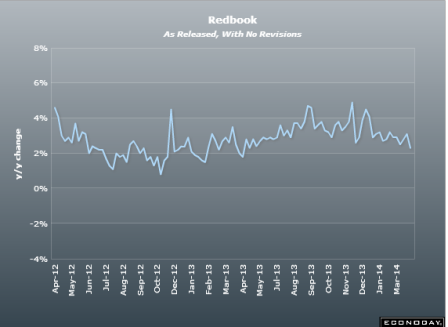
Not to give this all that much weight, and they are limited surveys with Easter distortions as well, but the year over year lines aren’t showing any rebound yet:
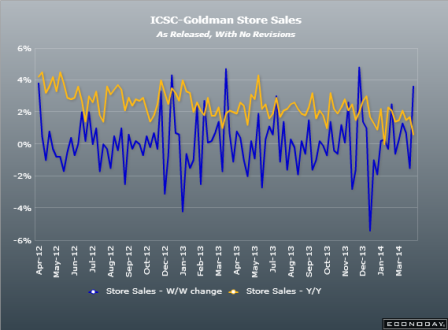
Full size image
Full size image
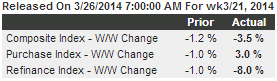
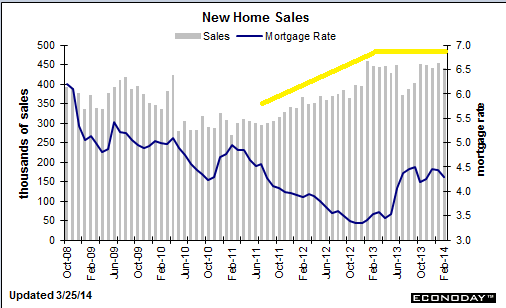
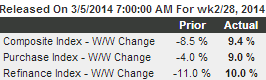
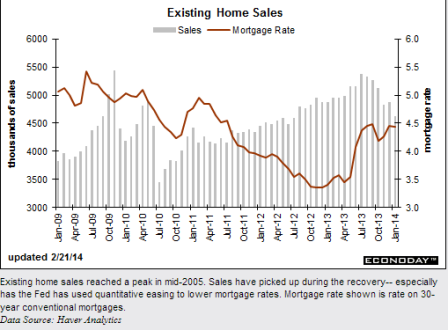
Purchase Mortgage applications up 1% for the week but down 19% vs last year.
What I’m saying is that Jan and Fed were weather depressed. And with the federal deficit now running maybe below 3% of GDP, down several % from last year, some pro active and some from the auto stabilizers, my concern is that the underlying support for a bounce is no longer there and the rate of growth continues to decelerate. Yes, lending is up some, but it could be the financing of utility bills and inventory/reduced cash flow growth, which takes away from future sales.