ADP up 238,000

Promising, but +48,000 construction jobs seems suspect?

Shopping and car sales peaked during that period as well.

The ADP national employment report is computed from a subset of ADP records that represent approximately 400,000 U.S. business clients and approximately 23 million U.S. employees working in all private industrial sectors. The data are collected for pay periods that can be interpolated to include the week of the 12th of each month

last comment of the year on fiscal drag

Back in November my forecast for 2013 was 4%, which at the time was by far the highest around. The govt was spending more than its income by about 6% of GDP, which was about $900 billion if I recall correctly. But then it cut back, first with the year end FICA hike along with other expiring tax cuts, and then with the sequesters that began in April.

Consequently, the govt spent only about $680 billion more than its income, which lowered growth by maybe 2%. And today mainstream economists are saying much the same- growth would have been maybe 2% higher without the ‘fiscal drag’ of the tax hikes and spending cuts.

So far our narratives are the same.

But here’s where they begin to differ.

They say the GDP/private sector would have grown by 4% if the fiscal drag hadn’t taken away 2%, and so without the govt again taking away 2%, the private sector will resume its ‘underlying’ 4% rate of growth.

I say the GDP/private sector would have grown by 4% that included the 6%/$900 billion net spending contribution by govt, if govt hadn’t cut back that contribution to $600 billion.

That is, they say the govt ‘took away’ from the ‘underlying’ 4% growth rate, and I say the govt ‘failed to add’ to the ‘underlying’ 2% growth rate that still included a 4% contribution by net govt spending.

And, in fact, I say that if the govt had cut its deficit another 4% to 0, GDP growth might have been -2% (multipliers aside for purposes of this discussion), which is the actual ‘underlying’ private sector growth rate. And that’s due to the ‘unspent income’ of some agents not being sufficiently offset by other agents ‘spending more than their income’.

Furthermore, I say that unless the ‘borrowing to spend’ of the ‘non govt’ sectors steps up to the plate to ‘replace’ the reduced govt contribution, the output won’t get sold, as evidenced by unsold inventory and declining sales in general, throwing GDP growth into reverse, etc.

So because we have different narratives, we read the same data differently.

They see the 1.7% Q3 inventory build as anticipation of future sales, while I see it as evidence of a lack of demand.

They see the Chicago PMI’s large spike followed by 2 months of decline as a strong 3 month period, while I see it as a sharp fall off after the inventory build.

They see the fall off in mortgage purchase apps as a temporary pause, while I see it as a disturbing fall off in the critical ‘borrowing to spend’ growth maths.

They see October’s shut down limited 15.2 million rate of car sales followed by November’s spike to 16.4 million as a return of growth, while I see the two month average a sign that growth has flattened in this critical ‘borrowing to spend’ dynamic.

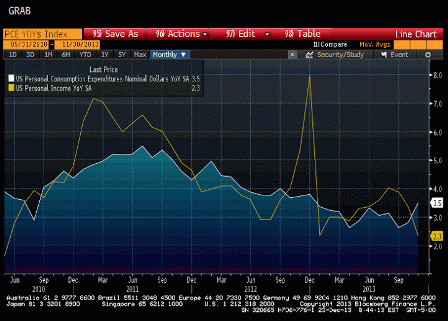
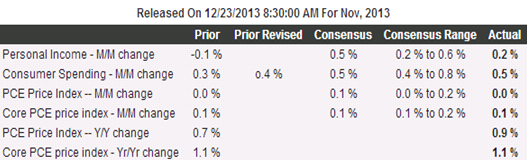
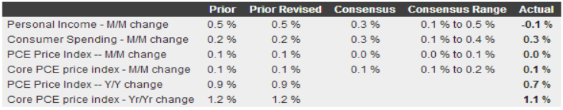
And likewise with the weakness in the Pending Home Sales, Credit Manager’s Index, Architectural billings, down then up durable goods releases, new home sales, the slowing rate of growth of corporate profits, personal income, etc. etc.

And they see positive survey responses as signs of improvement, while I see them as signs they all believe the mainstream forecasts.

;)

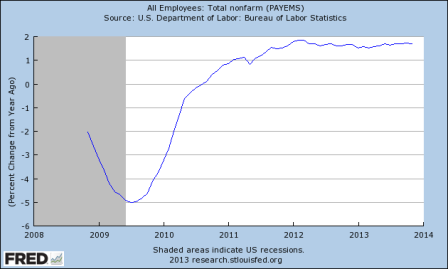
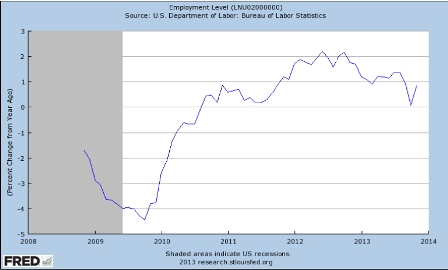
And not to forget they see the increase in jobs as evidence of solid growth given the rapidly growing % of sloths, and I see it flat as a % of the population.

;)

Happy New Year/ La Shona Tova to all!!!

Another look at Q3 GDP

Third-Quarter Growth in U.S. Revised Higher on Services

By Victoria Stilwell

Decmeber 20 (Bloomberg) — The economy expanded in the third quarter at the fastest rate in almost two years as Americans stepped up spending on services such as health care and companies invested more in software.

Jump in healthcare??? And the software gain was the new ‘intellectual’ category.

Gross domestic product climbed at a revised 4.1 percent annualized rate, the strongest since the final three months of 2011 and up from a previous estimate of 3.6 percent, Commerce Department data showed today in Washington. The gain exceeded the most optimistic projection in a Bloomberg survey.

Inventories accounted for a third of the increase in GDP in the third quarter, showing companies were confident about the prospects for demand. Stronger retail sales in October and November underscore the Federal Reserves view that the worlds largest economy is improving.

Right, a boom in unsold inventories. Especially cars, where the inventory was on the high side even for the November spike in sales to 16.4 million (annual rate) from a shutdown depressed 15.2 million for October. And it looks like December total vehicle sales are back down below the two month average, which means the inventory to sales ratio is even worse. No surprise Jan auto production cutbacks have already been announced.

You have equity markets supporting household net worth, rising home values and also payroll gains and falling unemployment, so we do really look for consumption to start picking up, said Robert Rosener, associate economist at Credit Agricole CIB in New York, whose forecast for growth of 3.8 percent was the highest in the Bloomberg survey. This is a very good sign for momentum going into the fourth quarter.

The median forecast of 72 economists surveyed by Bloomberg projected a 3.6 percent gain in GDP, the value of all goods and services produced in the U.S. Forecasts ranged from 3.3 percent to 3.8 percent. Stocks rose after the figures, with the Standard & Poors 500 Index advancing 0.6 percent to 1,820.78 at 11:46 a.m. in New York.

Services Spending

Consumer purchases, which account for almost 70 percent of the economy, increased 2 percent, more than the previously reported 1.4 percent, the revised data showed.

Better but still weak year over year, and, again, healthcare spending of some sort accounted for much of the upward revision.

Spending on services contributed 0.32 percentage point to third-quarter growth, up from a previously reported 0.02 percentage point. In addition to the pickup in outlays for health care, Americans spent more on recreational services.

Outlays for non-durable goods climbed at a 2.9 percent rate in the third quarter, led by more spending on gasoline.

Inventories increased at a $115.7 billion annualized pace in the third quarter, the most in three years, after a previously reported $116.5 billion annualized rate. In the second quarter, they rose at a $56.6 billion pace.

Stockpiles added 1.67 percentage points to GDP last quarter, little changed from the 1.68 percentage-point contribution in the previous reading.

More Optimistic

While economists grew more optimistic about demand in the fourth quarter, GDP will nonetheless be restrained as the pace of inventory growth cools.

JPMorgan Chase & Co. economists project the economy will grow 2 percent from October through December, up from the 1.5 percent rate they had penciled in prior to the Commerce Departments Dec. 12 retail sales report. Barclays Plc has raised its fourth-quarter tracking estimate to 2.3 percent from 2 percent before the retail figures.

Domestic final sales, which exclude inventories, increased 2.5 percent in the third quarter compared with a previously reported 1.9 percent increase.

Corporate spending on equipment rose 0.2 percent, compared with a previous reading of no change. Business investment in intellectual property was revised up to a 5.8 percent increase from 1.7 percent, reflecting more spending on software.

Further investment will depend on how much confidence companies have that the economy will accelerate.

Capital Spending

Honeywell International Inc., whose products range from cockpit controls to thermostats, expects capital expenditures in the range of $1.2 billion or more in 2014, up about 30 percent from this year.

Were very disciplined in terms of cap-ex, Chief Financial Officer David Anderson said on the companys 2014 guidance call on Dec. 17, referring to capital expenditures. We really have to see the whites of the eyes of the economic return characteristics to really commit.

Economic indicators are pointing to just a continued resilience, not exuberance, but resilience and expansion in the U.S. economy, Anderson added.

Todays report also included corporate profits. Before-tax earnings rose at a 1.9 percent rate after climbing at a 3.3 percent pace in the prior period. They increased 5.7 percent from the same time last year.

Profit growth continues to slow, even with the higher GDP.

Residential real estate is underpinning the economy, as rising prices boost household wealth and growing demand helps the industry overcome rising mortgage rates.

Home Construction

Home construction increased at a 10.3 percent annualized rate in the third quarter. While slower than the 13 percent pace previously reported, the figure primarily reflected revisions to brokers commissions and other ownership transfer costs, todays report showed.

Data from the Commerce Department this week showed that housing starts jumped 22.7 percent to a 1.09 million annualized rate, the most since February 2008, while permits for future projects also held near a five-year high, indicating that the pickup will be sustained into next year.

Slower growth in home construction and most homebuilders reporting flattish sales, especially after mortgage rates went up, and mortgage purchase apps continue to be down about 10% from last year as well. Let me suggest that 22% jump of the initial release of November housing starts seems suspect as there are no reports of a leap higher in home sales or construction from the housing companies or mortgage originators. And permits were in fact down.

Other signs show that fiscal drag, which weighed on growth during 2013, will start to ease. U.S. lawmakers this week passed the first bipartisan federal budget produced by a divided Congress in 27 years, easing $63 billion in automatic spending cuts and averting another government shutdown.

Yes, it could have been worse, but a variety of tax cuts do expire at year end, as do extended unemployment benefits. But the bottom line is the federal deficit (the ‘allowance’ the economy gets from Uncle Sam) is likely to fall to under $500 billion in 2014, after falling from just under $1 trillion in 2012 to just over 600 billion in 2013. And worse, the automatic stabilizers are extremely aggressive this time around, where 2% growth cuts the deficit maybe by as much as 4% growth cut it in past cycles.

Government outlays increased 0.4 percent in the third quarter, led by a 1.7 percent gain in state and local spending that was the same as the previous reading. Federal spending decreased 1.5 percent.

They fail to mention that state and local tax receipts also rose, so overall the closing of the state and local budget deficits from the recession means there is less fiscal support from the states.

Tighter fiscal policy has made stimulating the U.S. economy even more of an uphill battle for the Fed. The central bank this week announced it would scale back its bond-purchase program by $10 billion, to $75 billion a month, after seeing an improved outlook for the labor market.

This has been done in the face of a very tight, unusually tight fiscal policy for a recovery period, Chairman Ben S. Bernanke said Dec. 18 during a press conference at the conclusion of a meeting of the Federal Open Market Committee.

I’m hoping for a good economy as well, but with housing and cars- the main engines of domestic credit growth- coming off the boil, and Uncle Sam’s allowance payments to the economy (deficit spending) down to less than $50 billion/mo (3% of GDP%) and falling from closer to $80 billion/mo not long ago, seems to me the jury is still out.

A few of last week’s charts:

Personal Income and Consumption, Employment reports and productivity


Full size image

Highlights
November was an uncertain month for the consumer in terms of sentiment. But in terms of hard numbers, it was a good month. Personal income rebounded 0.2 percent, following a 0.1 percent dip in October. But the important wages and salaries component improved to a 0.4 percent gain in November after rising 0.1 percent the month before.

Spending also accelerated a bit, jumping 0.5 percent after a 0.4 percent boost in October. No surprise, the latest gain was led by durables (largely motor vehicles) up 1.9 percent, following a 1.0 percent increase in October. Nondurable declined 0.4 percent after a 0.4 percent decrease in October. Lower gasoline prices likely played a role in November. Services jumped 0.6 in November, following a 0.3 percent rise the prior month.

Employment and Productivity

The Non Farm Payroll chart shows employment growth of about 1.7%. The Household survey has been indicating less than 1%.

And while the Payroll chart is arguably the far more reliable indicator because it’s far larger with about 145,000 businesses reporting, vs a survey of 60,000 households, and is actual reports vs survey questions. Also, the household survey is just about how many people are working, while the payroll survey is the number of jobs, even if one person is holding down more than one job.

But with year over year real GDP growth of about 2%, the Payroll report is implying near 0 productivity increases, while the household survey is implying and overall productivity gain of over 1%.


Full size image


Full size image

expiring benefits and job related data

Lots of talk on how the expiring unemployment benefits will alter January jobs numbers.

Size of labor force?
Participation rate?
Will they suddenly accept low paying service sector jobs?
Go on disability?
Etc. etc.

In theory total jobs should be about the same, as this type of thing for all practical purposes doesn’t cause anyone to increase head count. It can, however, put downward pressure on labor should these people ‘substitute’ for whoever would have been hired otherwise, but a lower rate of pay.

Time will tell. But in any case, it’s a cut in govt spending that thereby gradually results in fewer jobs than otherwise:

Extended Unemployment Aid Likely to End (WSJ) A financial lifeline for people who have exhausted their state unemployment benefits is on the verge of coming to an end, after Republicans and Democrats clashed in budget talks over how to cover the cost of extending emergency benefits that have aided workers since the financial crisis. The program, which provides aid for the long-term unemployed, was left out of a budget deal announced by Republican and Democratic negotiators Tuesday night. Democrats and the White House sought an extension of the plan, but the $25 billion cost have reduced the chance it will be continued. Top Democrats in both the House and Senate acknowledged the benefits would expire at the end of the year. The White House estimates that 1.3 million people will lose emergency federal jobless assistance on Dec. 28, with another 1.9 million people losing the aid in the first half of 2014.

Fed paper hikes NAIRU

As previously discussed, this happens with every down cycle, and is disproven every time demand picks up.

Meanwhile, real wages continue to under perform and remain disgraceful

This new Fed paper says that everyone who left the labor force since early 2012 is not coming back. In other words, the labor market is tighter than the Fed thinks and the NAIRU is higher which is why wages are rising, see also chart below:

Excerpts:
“The decline in the participation rate since the first quarter of 2012 is entirely accounted for by … retirement.”

“…a plausible conjecture is that the 2008 financial crisis and associated losses of wealth might have had the effect of delaying their retirement age, while the subsequent recovery of financial wealth has allowed more of them to retire in the last few years.”


Fed: “On the Causes of Declines in the Labor Force Participation Rate”


In the attached GEP from earlier this year we also found that most of the decline in the participation rate is driven by longer-term, structural factors, such as demographics.

Happy to discuss, let us know.


Full size image

Employment and personal income

Employment continues to grow at the pace we’ve seen for the last couple of years at a pace that’s perhaps a bit ahead of population growth (chart).

The question is whether this is sufficient for the Fed to taper, which I’d say is anyone’s guess right now.

The FOMC clearly doesn’t like QE, but at the same time seems to me they will shy away from doing anything that might cause further increases in mortgage rates?

And for those who believe QE ‘works’ to sustain growth (or, as some believe, bring it back from the future), they have to be very concerned that with all the QE they’ve done this is all we have to show for it, wondering how bad it would have been without the QE, or what might happen if they back off.

October personal Income also was released at 8:30am and was weaker than expected, with the govt. shutdown likely a factor, so, as it’s been for a while, it’s a matter of waiting for cleaner data.

Inflation indicators continued weak as well, further complicating the tapering debate:

Personal Income and Outlays:

Highlights:
Overall consumer spending picked up a bit as expected at the beginning of the fourth quarter but not by much, to plus 0.3 percent in October vs plus 0.2 percent in September. Strength was in durable goods reflecting strong auto sales. Smaller gains were posted for nondurable goods and services.

The income side of the report is especially soft, at minus 0.1 percent following two very strong months at plus 0.5 percent. The decline is the first since January and may be related to the impact of the government shutdown on private wages. Wages & salaries are especially soft, up only 0.1 percent following gains of 0.4 and 0.6 percent in the two prior months.

Inflation readings are very soft with the price index unchanged and the core index up only 0.1 percent. The year-on-year rate for the price index is only plus 0.7 percent with the core year-on-year rate at plus 1.1 percent, both declining in the month and both well below the Fed’s goal of 2 percent.

PCE Deflator Graph
Personal Income Y/Y Graph