New home sales, Existing home sales, Sea containers, Wage tracker chart

Heading lower from already depressed levels:

Highlights

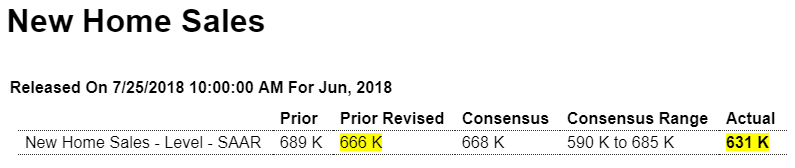
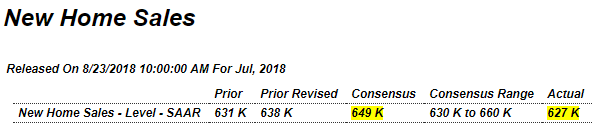
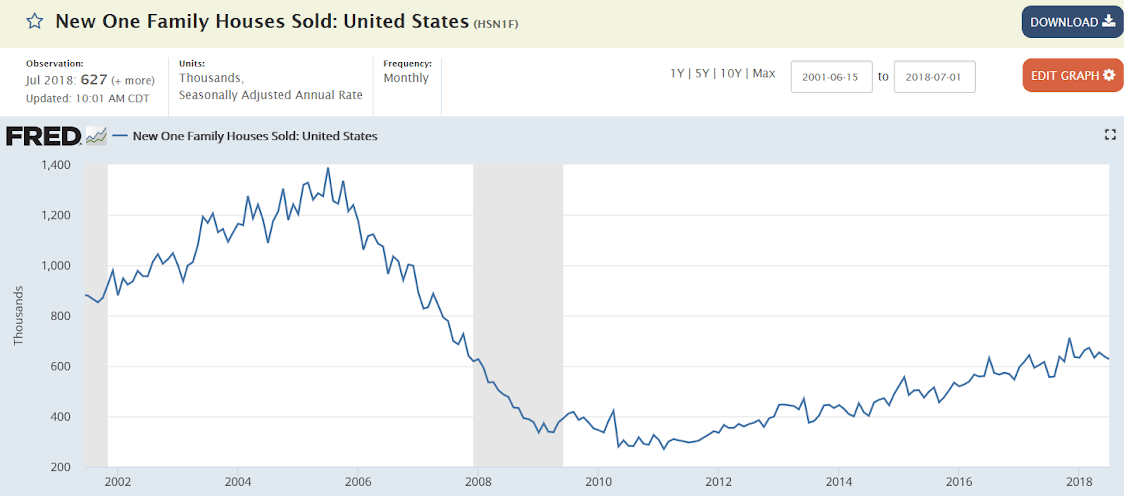
The headline shows a decline but the message from the July new home sales report is nevertheless mostly positive. New home sales slipped 1.7 percent in the month to a 627,000 annualized rate that misses Econoday’s consensus by 22,000 and the Econoday’s low estimate by 3,000. Revisions are neutral with June revised 7,000 higher to 638,000 but with May revised 12,000 lower to 654,000.

Now the good news. Supply moved into the market, up 2.0 percent to 309,000 new homes for sale which is the best showing since 2009. More homes for sale gives buyers more choices in what will be a likely positive for sales in the coming months. Relative to sales, supply is at 5.9 months vs 5.7 and 5.5 in the two prior months.

Another positive is a rise in prices, up a sharp 6.0 percent on the month to a median $328,700 for what is still, however, a modest 1.8 percent year-on-year increase.

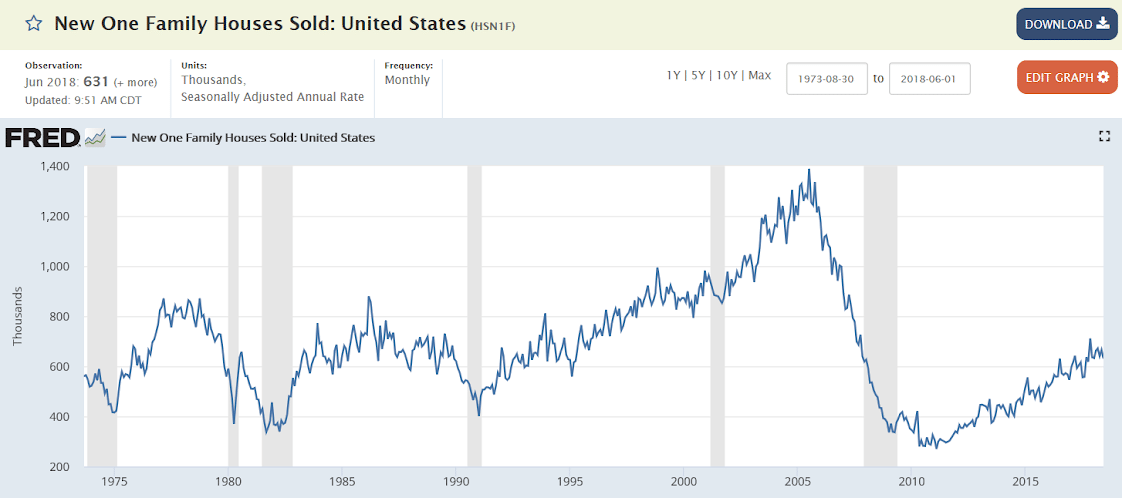
Regional data show both the West and Midwest posting strong monthly gains with yearly rates at 18.5 percent and 18.2 percent respectively. The yearly rate for the South is at 17.2 percent with, however, the Northeast, which is by far the smallest region for new housing, down nearly 50 percent.

The overall year-on-year rate of growth is at 12.8 percent which if sustained would point to a badly needed uplift for the housing sector in general going into the second-half of what has been a very subdued 2018.

Highlights

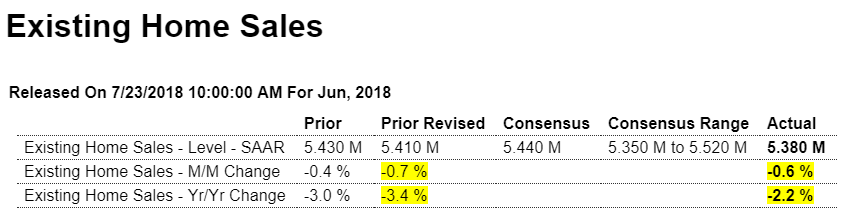
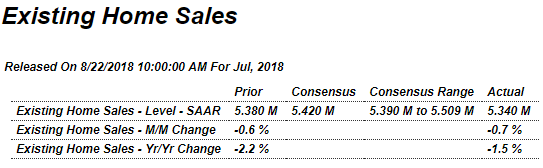
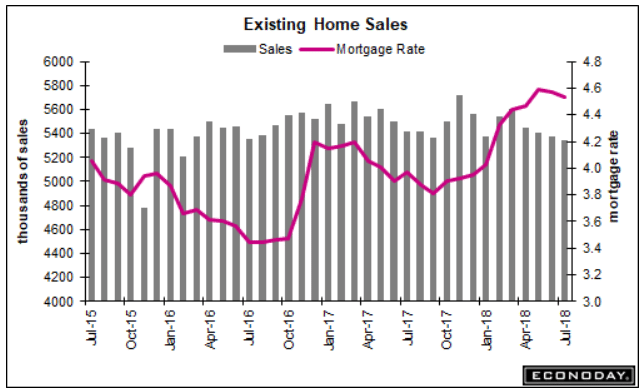
Housing is the one sector of the economy not showing any life. Existing home sales managed only a 5.340 million annualized rate in July, missing Econoday’s consensus of 5.420 million for a 0.7 percent dip from June and the fourth decline in a row. This is the lowest rate in 2-1/2 years. Year-on-year, resales are down 1.5 percent.

Both single-family homes and condos show similar weakness, the former down 0.2 percent on the month and down 1.2 percent on the year at a 4.750 million rate. Condo resales, at a 590,000 rate, fell 4.8 percent on the month and are down 3.3 percent on the year. All regions show similar declines on the year with the West posting the only monthly gain in July, at 4.4 percent.

Supply doesn’t offer any relief either, down 0.5 percent to 1.920 million total resales on the market. Relative to sales, supply is unchanged at 4.3 months. And prices fell in the month, down a monthly 1.5 percent to $269,600 for a 4.5 percent yearly gain that stands in contrast to the yearly decline in sales in a comparison that doesn’t point to price traction ahead.

Rising mortgage rates aren’t a plus for housing and neither are construction constraints for labor and materials that are slowing the new home market where weakness bleeds into resales. Third-quarter GDP looks to be very solid but apparently won’t be getting much lift from residential investment.

Home Sales Tumbled In July for the Longest Slump Since 2013

(WSJ) Existing-home sales fell 0.7% in July from June to a seasonally adjusted annual rate of 5.34 million units. That marked the fourth straight month of declines. Compared with a year earlier, sales in July were down 1.5%. The average interest rate on a 30-year fixed-rate mortgage in July was 4.53%, up from 4.03% in January and 3.97% in July 2017, according to Freddie Mac. Sales of homes at the low end of the price spectrum—priced at less than $100,000—fell nearly 11% from July 2017. Sales of homes priced $1 million or more, by comparison, rose 16%.

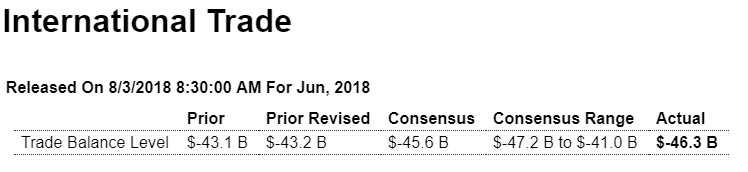
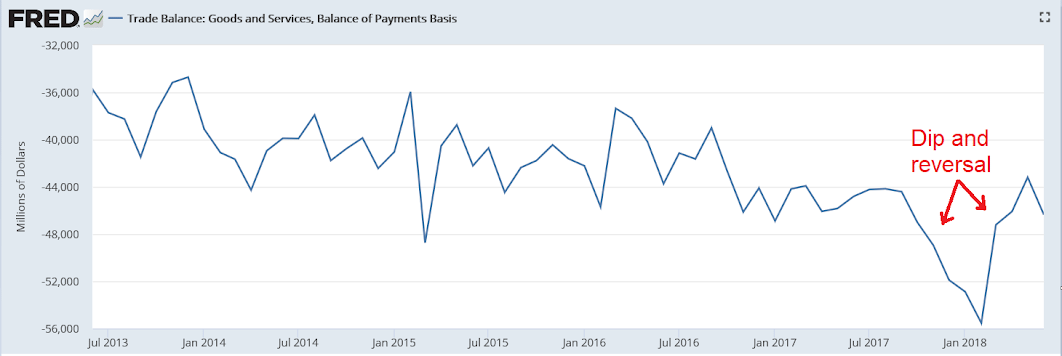
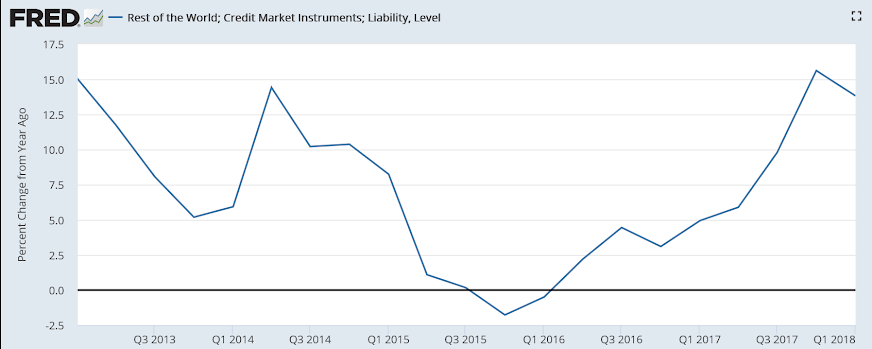
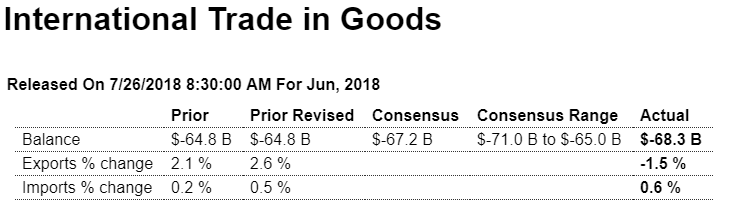
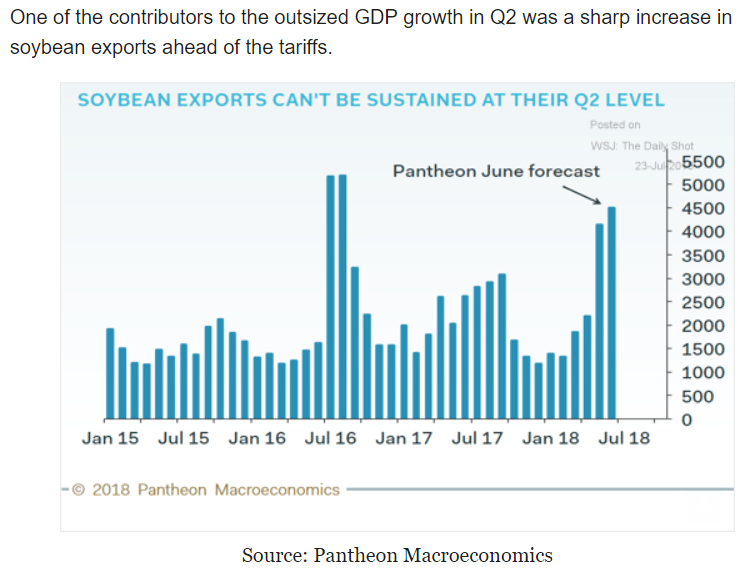
The July year-over-year export counts were weaker than last month – and imports are now showing a declining trend line.

Retail sales, Housing starts, Philly Fed

June was revised lower, so best to hold back judgement on July until August is released. Note vehicles were revised quite a bit lower for June, with the initially reported .9 jump suspect in any case:

Highlights

Demand for autos has cooled but not overall retail sales which rose 0.5 percent in July to easily top Econoday’s consensus range where the high forecasts were only at 0.3 percent. A downward revision to June, however, is an offset, now at a 0.2 percent gain vs an initial 0.5 percent. This will trim the second estimate of second-quarter GDP but the strong gain for July will lift early estimates for third-quarter GDP.

Motor vehicle sales did manage, despite July’s downturn in unit sales, to post a gain of 0.2 percent but the downward revision to June is centered here, now at only a 0.1 percent for this component vs an initial jump of 0.9 percent. But restaurant sales, which like autos are a discretionary category, rose a very strong 1.3 percent which is on top of 1.6 and 2.8 percent gains in the prior two months. Also very strong are sales for e-commerce as nonstore retailers posted a 0.8 percent July gain following a 0.7 percent rise in June.

Gasoline sales are also positive, up 0.8 percent in July and probably reflecting strength in summer driving demand, not just changes in prices. Apparel sales popped back up in July as did department store sales. Building materials, however, were flat with June sales for this category revised sharply lower to only a 0.1 percent gain. This along with a 0.5 percent decline in furniture sales are negative indications for residential investment.

But this report is not about negatives but positives — and that is strength in the central driver of the economy which is consumer spending and which is getting a major boost from strength in the labor market.

Weak and worse than expected but permits holding up. June revised lower slightly lowers q2 GDP:

Highlights

Capacity constraints in construction may very well be slowing down the sector as housing starts have turned lower. They did rise 0.9 percent in July to a 1.168 million annualized rate but follow a sharply downward revised 1.158 million in June. July’s result is far below the low end of Econoday’s consensus range at 1.200 million. Year-on-year, starts are down 1.4 percent with completions, at a 1.188 million rate, down 0.8 percent and homes not started, at 175,000, up 23.2 percent. Lack of available construction labor and high costs for lumber, which are tied in part to tariffs, are negative factors.

Showing much less weakness are permits, up 1.5 percent in the month to 1.311 million which compares favorably with Econoday’s 1.307 million consensus. Year-on-year, permits are up 4.2 percent with strength centered where it should be and that’s single-family homes where permits are up a very solid 6.4 percent. Multi-family permits are up 0.2 percent year-on-year.

By region, the Midwest is leading the way with mid-to-high single digit yearly gains for both starts and permits. The South is close behind with the West and Northeast lagging.

The housing sector in general is lagging though the gain in permits is a plus that, by contrast, underscores the capacity issues that are slowing down active construction.

Stalling out at the lows of 1960… :(


This is a negative surprise, and note the chart:

Highlights

Rates of growth may finally be slowing in the Mid-Atlantic manufacturing sector based on the Philly Fed general conditions index which fell sharply to 11.9 in August. This is the lowest reading in nearly two years and is far below Econoday’s low-end estimate of 20. It also follows June’s reading of 19.9 which also marked a turn lower for this index.

New orders are the life blood of business and growth here is clearly slowing, at 9.9 and also near a 2-year low. Other readings also show moderation with backlogs building at a slower rate, shipments strong but also slowing, employment strong but easing slightly, and the workweek also down slightly. And price pressures, though highly elevated, are easing slightly both for inputs and selling prices.

Not easing is the 6-month outlook which is up nearly 10 points to 38.8. This is very solid and does not speak to fundamental concerns about tariffs and trade wars.

Slowing should be no surprise for this report which was the first of the regional and private reports to shoot higher after the 2016 election. Slowing in orders should help limit the risk of capacity constraints for this sample.

Consumer credit, Miles driven, Income revision

More Q2 weakness:

Highlights

Consumers credit came in below expectations, up $10.2 B in June as consumers held back from adding to their credit-card debt and even paid off some of it following a spending spree in the previous month. Revolving credit, which includes credit cards and which posted the biggest increase since November in the previous month, fell $0.2 billion in June. Nonrevolving credit, which tracks both vehicle financing as well as student loans, rose a moderate $10.4 billion. The decline in revolving credit suggests the consumer is back to the prudent spending habits characteristic of most the months in the first half of the year.

Getting It Right – Significant Underestimation Of Income

“What is the use of producing data if you cannot get it right? Would we be better off if data were published every five years when it would presumably be more accurate?

One very important takeaway from the new data is that the current economic expansion may have more room to run. For almost two years now we have been saying that consumers spending more than they were making in income was unsustainable. Turns out that they have been living more within their means than we thought and sustainability is less of a concern.”

Trade, Employment, ISM, Japan swf

Larger than expected which also means q2 GDP will be revised down some:

Highlights

The nation’s trade deficit proved a little deeper than expected in June,, at $46.3 billion vs Econoday’s consensus for $45.6 billion.

After a run of strength going back to February, exports posted a 0.7 percent decline to $213.8 billion in the month with a rise in service exports offset by a drop in goods exports where capital goods, vehicles and especially consumer goods posted declines.

Imports, in special focus of course given the tariff situation, rose 0.6 percent to a monthly $260.2 billion with consumer goods, the sore spot in the nation’s deficit, rising a sharp $2.0 billion to $53.4 billion. Oil imports were also up, rising $1.2 billion to $14.1 billion.

Country data show a deepening deficit with China, at $33.5 billion in June with the year-to-date deficit 8.6 percent wider at $185.7 billion. Other year-to-date deficits include an 11 percent deepening with Europe at $77.6 billion, a 5.5 percent deepening with Mexico at $38.0 billion, and a 23.4 percent improvement with Canada at $8.1 billion.

Though deeper than expected in June, the nation’s trade deficit has been improving though the outlook, given tit for tats on tariffs, is uncertain.


Chugging along as low participation rates and low wage growth tell me there’s still a lot of excess capacity:

Highlights

Slowing job growth may be a welcome outcome given the risk that economic activity may be pressing up against capacity limits. A 157,000 rise in nonfarm payrolls for July is at the low end of Econoday’s consensus range but is still healthy growth that is strong enough to absorb new entrants into the labor market. And revisions to prior months are favorable, a net 59,000 gain with June revised up to 248,000 and May higher at 268,000 in what were two very strong months for job growth.

The slowing in July is also favorable for the inflation outlook as average hourly earnings showed a little heat, up 0.3 percent which was expected but still firm. The year-on-year rate, at an as-expected 2.7 percent, has been steady which is a relief to Federal Reserve policy makers who are focused on keeping inflation stable at current rates.

The payroll breakdown is led by temporary help services which rose 28,000 in a very strong gain that indicates employers, stacked up with orders and backlogs, are scrambling to meet demand. Construction payrolls also standout with a strong 19,000 gain in the latest indication of strength in this sector. Manufacturing payrolls rose 37,000 to more than double Econoday’s consensus with trade & transportation, reflecting strong activity in the supply chain, up 15,000. Weakness in payrolls comes from mining, down 4,000 after a long series of gains, and also government payrolls which fell 13,000 to nearly reverse the prior month’s 14,000 jump.

The unemployment rate fell 1 tenth in July to 3.9 percent with the number of unemployed actively looking for a job down 284,000 to 6.280 million. The pool of available workers, which includes those wanting a job but aren’t looking, fell 379,000 to 11.443 million which hints at capacity limits in the labor force, again underscoring the risk of wage inflation. The participation rate holds at 62.9 percent.

Though the headline is softer than expected, this is yet another positive employment report that speaks to the strength of the labor market and the success, so far, of Federal Reserve policy.

Analysts have been crying wolf on ‘wage inflation’ for several years now:


The deceleration had seemingly reversed a year ago, but in any case employment growth is modest at best:


Hasn’t been much of a recovery:

Fyi,

I don’t see the public purpose behind this at all, of course:

Japan plans sovereign wealth fund to finance US infrastructure

(Nikkei) The Japanese government intends to create a sovereign wealth fund to invest in American infrastructure projects. The state-backed fund will support infrastructure construction along with resource development and storage, as well as invest in joint U.S.-Japanese projects in other countries. It could work with a $113 million Indo-Pacific investment initiative announced this week by U.S. Secretary of State Mike Pompeo. Japan is expected to offer the fund as a concrete example of economic cooperation with the U.S. at the “free, fair and reciprocal” trade talks that the two sides will launch on Aug. 9.

Motor vehicle sales, Factory orders

Highlights

Unit vehicle sales proved surprisingly weak in July, at a 16.8 million annualized rate vs 17.2 million in June. This is the lowest rate since August last year but it will be the comparison with June that will pull down forecasts for July’s retail sales report. Vehicles were a valuable contributor to the monthly retail sales reports throughout the second quarter, but today’s results point to a flat opening for the third-quarter. Vehicle sales make up about one-fifth of total retail sales. Weakness was split between imports, at a 3.7 million rate vs June’s 3.8, and domestic-made, at 13.1 million vs 13.4.

Highlights

Factory orders for June rose a sharp 0.7 percent but miss Econoday’s consensus by 2 tenths in a report that does include some slowing. Orders for commercial aircraft were a plus in the month as were orders for vehicles excluding which, as well as all other transportation equipment, orders in June rose 0.4 percent and are unchanged from last week’s advance estimate.

What are changed are orders for core capital goods (nondefense ex-aircraft) which are revised to only a 0.2 percent gain vs a 0.6 percent rise in last week’s advance data. Shipments for this reading are revised 3 tenths lower to a 0.7 percent gain in a downgrade that will weigh slightly on forecasts for the second estimate of second-quarter GDP.

Orders for steel and aluminum fell back in June though unfilled orders are up and related inventories continue to rise sharply. Total orders for durable goods rose 0.8 percent, revised 2 tenths lower from the advance report, with orders for non-durable goods, the fresh information in today’s report, up 0.5 percent on strength in chemicals vs May’s 1.1 percent gain which was fed by strength in petroleum and coal.

Other data include a useful build in total unfilled orders which extended recent gains with a 0.4 percent rise. Total shipments were very strong, up 1.0 percent despite wide reports in the month of trucking snags. Inventories are low in the factory sector, up only 0.1 percent in June to drive down the inventory-to-shipments ratio to 1.33 from 1.35.

Today’s strong headline aside, June wasn’t that great of a month for the factory sector which perhaps was held down to a degree by tariff-related disruptions. Year-on-year growth in orders is very positive, at 6.1 percent, but down from 9.2 and 7.9 percent in the two prior months. Nevertheless, indications including strong readings in regional and private manufacturing reports point to second-half acceleration for the sector and second-half leadership for the 2018 economy.

Growth is slowing and on an inflation adjusted basis we aren’t even back up to levels of two decades ago:

Vehicle sales, Mtg purchase applications, Construction spending, Payrolls, Tesla

A lot worse than expected as sales are clearly going south:

U.S. Light Vehicle Sales decrease to 16.7 million annual rate in July

Read more at https://www.calculatedriskblog.com/#ZO2HJY5rKwX1XQfU.99

Highlights

Purchase applications for home mortgages fell a seasonally adjusted 3 percent in the July 27 week, posting the third weekly decline in a row, while applications for refinancing declined 2 percent. Unadjusted, purchase applications were just 1 percent above the level in the same week a year ago. The refinance share of mortgage activity increased by 0.3 percentage points from the prior week to 37.1 percent. Interest rates resumed their climb, with the average interest rate for 30-year fixed rate conforming mortgages ($453,100 or less) rising 7 basis points from the prior week to 4.84 percent.

Highlights

Volatility once again appears in construction spending data as a 1.1 percent June drop was unexpected, coming in far below a plus 0.3 percent consensus gain and Econoday’s low estimate of minus 0.3 percent. Part of the surprise is tied to a sharp 9-tenths upward revision to May, now at plus 1.3 percent, which made the comparison for July more difficult.

Residential spending slowed widely in June especially for new multi-family homes, down 2.8 percent in the month, but also for new single-family homes, down 0.4 percent. Home improvements inched 0.1 percent higher in the month.

Private nonresidential spending slipped 0.3 percent with spending on commercial and power projects down while manufacturing, which had been weak, managed a bounce higher. Public spending on educational projects and highways & streets both declined.

Part of the weakness in construction spending is likely tied to shortages of construction workers, especially skilled labor. High prices for construction materials is another likely negative. And for the residential sector, weakness in new construction will continue to limit buyer choices and overall home sales. Still, stepping back and looking at the year-on-year change offers a reminder that construction is overall very strong, with spending up a year-on-year 6.1 percent.

Doesn’t look strong to me. And these numbers are not adjusted for inflation:


ADP payroll growth:


Another big loss for Tesla, again failing to meet expectations, and cash depleted to $2.2 billion. Stock only up about 5% after hours on expectations for q3… ;)

Personal income and spending, Pending home sales

The benchmark revisions were substantial and the data now paints a very different picture:

Highlights

Easing inflation pressure along with healthy consumer vital signs is the message from the personal income & outlays report for June. Both price indexes, the overall and the closely watched core rate which excludes food and energy, posted only marginal 0.1 percent gains in June with year-on-year rates favorable, at 2.2 percent overall and at 1.9 percent for the core, both unchanged from downwardly revised results in May. The movement in inflation is coming back toward the Fed’s 2 percent target line, not away from it.

Personal income rose a useful 0.4 percent with the wages & salaries component also at 0.4 percent. The savings rate was shifted sharply higher in last week’s benchmark GDP revisions in what is a very fundamental sign of health. The savings rate held unchanged in June at 6.8 percent.

The consumer didn’t dip into savings to keep up spending which was a solid 0.4 percent with May revised sharply upwards, from an initial 0.2 percent gain to 0.5 percent. Spending on services rose 0.6 percent in June to offset what is a small disappointment in today’s report which is no change in spending on durables.

The inflation readings in today’s report are complemented by a little less pressure in the employment cost index which was also released this morning. Together, they ease the pressure on the Federal Reserve and may help to keep down any hawkish edge to Wednesday’s FOMC statement.

The personal savings rate has been substantially revised to now show that the consumer has not been dipping into savings as previously indicated, removing that source of stress:


Nor is consumption growth decelerating as it was before the revisions:


And the downward bend in the personal consumption curve has been revised away as well:


Serious upward revisions for 2017!

June 2018 Pending Home Sales Seasonally Adjusted Index Remains In Contraction Year-over-Year

The National Association of Realtors (NAR) seasonally adjusted pending home sales index improved – yet the year-over-year contraction worsened. Our analysis shows continued worsening of growth.

GDP, World trade

So the savings rate puzzle, where consumption was exceeding income, has now been reconciled with large upward revisions in personal income. And looks like the credit expansion that supplied the income and drove the spending was from non-residents. The next monthly consumption and income releases will bring it all up to date:

Highlights

Leading a report that speaks to the risk of overheating, consumer spending drove GDP significantly higher in the second quarter, to a 4.1 percent annualized rate which, however, just misses Econoday’s consensus for 4.2 percent. Consumer spending rose at a very strong 4.0 percent rate in the quarter to contribute 2.7 points of the total rate with spending on services contributing 1.5 points. Spending on goods, split roughly evenly between durables and nondurables, contributed 0.6 points.

Net exports were the next biggest contributor, adding 1.1 points and reflecting strong improvement in exports that offset a slight increase in imports. Nonresidential fixed investment contributed 1.0 point to the quarter led by structures and intellectual property with equipment only slightly positive. Government purchases were also a positive contributor at 0.4 points.

Inventories are another major story in this report, falling $27.9 billion for a 1.0 point subtraction from GDP. When excluding inventories (final sales), GDP came in at 5.1 percent. And the pull lower from inventories is actually a positive for the economy, as inventories are too low and need to be rebuilt which should be a positive for third-quarter GDP. Residential investment proved only marginally negative in the second quarter.

To top this very strong report off are price pressures as the GDP price index came in at a very hot 3.0 percent, vs 2.0 percent in the first quarter and exceeding Econoday’s consensus range by 5 tenths. And the core, which excludes food and also energy prices which have been high, shows similar pressure, at 2.7 percent vs the first quarter’s 2.4 percent.

Overheating would appear to be a danger for the economy right now, consistent with the array of regional and private economic data where delivery delays, input costs and even price pass through are at or near record highs. Today’s report includes benchmark revisions including a 2 tenths upgrade to first-quarter GDP which now stands 2.2 percent. Also of note, the savings rate for 2017 is revised much higher to 6.7 percent from 3.4 percent.

Beneath the Surface, a Solid Economy With Room to Run

(WSJ) Exclude the volatile categories of net exports, inventories and government and the Q2 GDP result is 4.3% growth. Over the past year, it’s up 3.2%. Even without the tax cut the consumer would be in great shape. Wage growth remains subdued, but so many people are finding jobs that incomes are rising briskly. Friday’sreport disclosed that wages and self-employed income were much higher in recent years than previously thought. The saving rate instead of sliding to around 3% stands at 6.8%, in line with its average since 2012. The expansion now looks to be in its late middle age, not old age.

This is the quarterly data, just released, that shows a 4% gain for the quarter:


This is from the monthly data- paints a similar but somewhat picture:


This monthly report came out before the revisions:


Today’s quarterly numbers were from the new revised data:


And Fed profits paid to Treasury are no longer in the corporate profit series, slowing reported profit growth:


Corporate debt growth continues to decelerate:


But credit expansion for the rest of world has been accelerating since the presidential election. I don’t have a narrative for that, but seems large enough to explain where the income and spending originated:

Someone else now reads it the way I do- growth has been decelerating since the end of 2014 when oil capex collapsed:

Indications Are The Economy Will Slow With Or Without A Trade War

According to Lakshman Achuthan, Co-Founder & Chief Operations Officer of ECRI

Contrary to the notion of a “strengthening” economy, consumer spending growth has fallen to a 4 ¼-year low, as personal income growth continues to undershoot spending growth.

The consumer — which makes up about 70% of the economy — is getting hit with a six-year highs in inflation, so real wages are actually lower than a year ago.

Durable goods, Trade, Inventories, Apartment survey

The tax cuts helped the economy though they were relatively small and largely low multiple, but tariffs are tax increases and work to reduce real consumption if income doesn’t also adjust. Also, there could have been some front running ahead of the dates the tariffs go into effect. This adds volatility to the data.

Highlights

Helping to give a 1.0 percent boost to durable goods orders, aircraft orders did in fact rise sharply in June but still not nearly as much as expected given Econoday’s consensus for a 3.2 percent surge. Civilian aircraft orders rose 15.7 percent in the month but follow sharp declines of 21.0 percent and 39.4 percent in the prior two months. Excluding transportation, durable goods orders managed a moderate 0.4 percent rise to just miss expectations for 0.5 percent.

Strength in the report is centered in core capital goods (nondefense ex-aircraft) where orders rose 0.6 percent to just exceed Econoday’s consensus. Shipments for this reading, which are inputs into GDP, rose a sharp 1.0 percent which should raise estimates for second-quarter nonresidential investment.

Orders for primary metals fell 0.4 percent following May’s 0.1 percent dip, with fabrications, which are indirectly affected by tariffs, up only 0.1 percent in June after a 1.2 percent May decline. These two components make up more than 20 percent of total durable orders. In contrast to the soft new order data, inventories and unfilled orders for both primary metals and fabrications are building sharply.

Total unfilled orders, which have been building in recent months, rose a useful 0.4 percent in June which is another positive for the factory employment outlook. Total shipments surged 1.7 percent while inventories, which were already lean, slipped 0.1 percent. This mismatch drives the inventory-to-shipments ratio down sharply, to 1.60 vs 1.63 in both May and April.

Though aircraft is soft, this is otherwise a very positive report showing solid strength for capital goods. Manufacturing remains one of this year’s top performing sectors.

This is not adjusted for inflation, so just chugging along at modest levels;

Highlights

The goods portion of June’s trade deficit is a bit deeper than expected, at $68.3 billion vs Econoday’s consensus for $67.2 billion. Exports fell 1.5 percent in the month but follow an upward revised 2.6 percent gain in May. Imports rose 0.6 percent and very near an upward revised May increase of 0.5 percent.

There was a very steep decline in exports of consumer goods in June, down 8.5 percent to $16.3 billion, as well as vehicles, down 6.1 percent to $12.7 billion. Capital goods exports, a key U.S. strength, also fell, down 1.8 percent to $47.3 billion. Exports of foods & feeds, which are in focus given trade troubles, dipped 0.5 percent to $14.0 billion.

Imports of consumer goods, the nation’s sore point on trade, jumped 3.6 percent to $53.3 billion with vehicle imports up 1.6 percent to $30.2 billion. Imports of capital goods fell 2.7 percent to $57.4 billion with food & feed imports down 1.7 percent to $12.2 billion.

These results may trim back estimates for net exports in tomorrow’s second-quarter GDP report but they follow very positive results in May and April.

Highlights

Retail inventories were unchanged in June following an unrevised 0.4 percent build in May. The lack of a retail build, together with no change for wholesale inventories in June and a 0.1 percent decline for durable inventories, both also released morning, will be trimming back inventory estimates for tomorrow’s second-quarter GDP report.

Mtg apps, Home sales, Soy beans, Puerto Rico employment, Iran comments

Housing continues to roll over and is no negative year over year:

Highlights

Purchase applications for home mortgages fell a seasonally adjusted 1 percent in the July 20 week, while applications for refinancing increased by 1 percent from the previous week. Unadjusted, purchase applications were 2 percent higher than in the same week a year ago. The refinance share of mortgage activity rose 0.3 percentage points from the prior week to 36.8 percent. The average interest rate for 30-year fixed rate conforming mortgages ($453,100 or less) remained unchanged at 4.77 percent. Purchase applications dipped into negative year-on-year territory in June and while managing to post modest gains compared to the year ago level in recent weeks, the jump in financing costs by more than a half of a percentage point since the start of the year (though roughly unchanged since April) is likely to continue to suppress homebuyer appetites. Later this morning, the release of the New Home Sales report for June will provide further insights into homebuyer activity.

Highlights

New home sales unfortunately join the host of housing data showing weakness. Sales fell 5.3 percent in June to a 631,000 annualized rate vs Econoday’s consensus for 668,000. The disappointment comes despite price concessions as the median fell a monthly 2.5 percent to $302,100. Year-on-year, the median is down 4.2 percent vs a 2.4 percent rise for sales.

But good news comes from supply which rose 1.7 percent to 301,000 new homes on the market. Relative to sales, supply is at 5.7 months vs 5.3 and 5.6 months in the prior two months.

New home sales in the West, which is a key region for home builders, fell 5.2 percent with this yearly rate at minus 15.0 percent. The Northeast is the smallest region for new home sales but sales here have been picking up, jumping 37 percent in the month for a 21 percent year-on-year increase. Sales in the Midwest and South were weak in June, down a monthly 13.4 and 7.7 percent respectively.

The Spring selling season was a poor one for the housing sector with both new sales and especially resales showing little life. Less-than-favorable mortgage rates are one reason for the slowing as are constraints on new building including scarcity of skilled construction labor as well as materials.

Rolling over after not even getting to half what they were in the last cycle, and population adjusted they are well below prior cycles:

Chinese investors have become net sellers of U.S. commercial real estate for the first time in a decade, reversing a yearslong trend when these buyers spent tens of billions of dollars and helped boost the market for hotels and other properties.
Chinese insurers, conglomerates, and other investors sold $1.29 billion worth of U.S. commercial real estate in the second quarter, while purchasing only $126.2 million of property, according to data firm Real Capital Analytics. This marked the first time that Chinese investors were net sellers for a quarter since 2008.
The more than $1 billion in net sales reflects how much the Chinese government’s attitude toward investing overseas has changed in recent months.


Puerto Rico still losing people. When the Fed’s take over they don’t work to grow the economy, but only to limit PR gov expenditures to PR tax revenues, which supports a downward spiral:

Trump warns Iran’s President Rouhani: ‘NEVER, EVER THREATEN THE UNITED STATES AGAIN’

  • President Donald Trump threatens his Iranian counterpart in a Twitter post.
  • Monday morning, Trump’s hawkish national security advisor, John Bolton, backed the president’s rhetoric.
  • Tensions between Iran and the U.S. have grown since Trump withdrew America from a nuclear deal struck during President Obama’s administration.