2008-05-20 US Economic Releases


[Skip to the end]


Whether the ‘definitions’ call the food and energy price hikes ‘inflation’ or not, they are still problematic.

There are two choices for government: try to sustain aggregate demand or try to reduce aggregate demand.

Currently, the policy is to say ‘inflation’ is not a problem and try to sustain aggregate demand, as evidenced by the tax rebates and Fed rate cuts.
(NOTE: I don’t think rate cuts add to demand, but the Fed does.)

And as oil climbs in price, markets discount lower rates from the Fed (markets also think lower rates add to demand).

And, for another fiscal example, Obama speaks of tax cuts for the middle class so people can pay for their food and energy. Adding to demand like that will drive prices up further.

Supply responses aren’t particularly price sensitive in the short run; so, crude could go up a lot more before something like pluggable hybrids in sufficient quantities cut demand for gasoline by the 5-10 million bpd necessary to break the rise in crude prices.

And by that time the pass throughs to the rest of the economy (yes, including housing and wages) will be well entrenched.

The other choice for government is to cut aggregate demand. This means tax hikes or spending cuts, and a deep, ugly recession to hopefully cut demand for gasoline that way. Looks even more painful and less promising, if that’s possible.

I have suggested cutting demand for gasoline with a ‘non-price’ policy of setting the national speed limit at 30 mph for private transportation. This is a conceptual extension of policies mandating mpg, etc. It will cut gasoline demand by perhaps 5 million bpd and if adopted world wide more than that, but has yet to even enter the national debate.

So it will be a debate between adding to aggregate demand and cutting aggregate demand – like choosing whether you want to get shot with a revolver or an automatic.

The days are numbered for current bias to add to demand – the limits of ‘inflation’ tolerance aren’t far away. We are only now probably seeing the pass through from $60 crude. There is much more to come, and for several years. And in hindsight, the current policy of adding to demand will at best be considered an error of judgment.


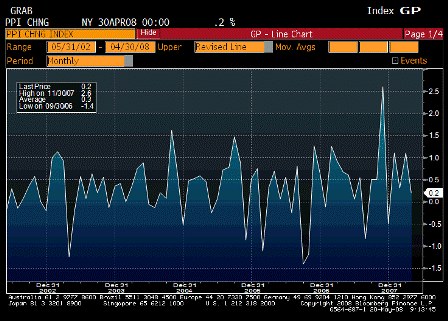
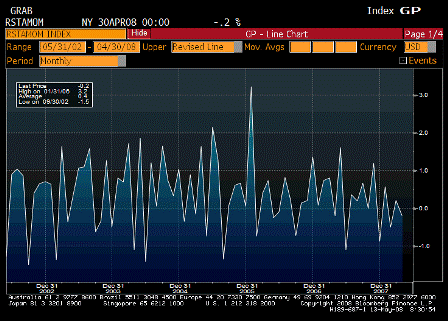
2008-05-20 Producer Price Index MoM

Producer Price Index MoM (Apr)

Survey 0.4%
Actual 0.2%
Prior 1.1%
Revised n/a

[top][end]


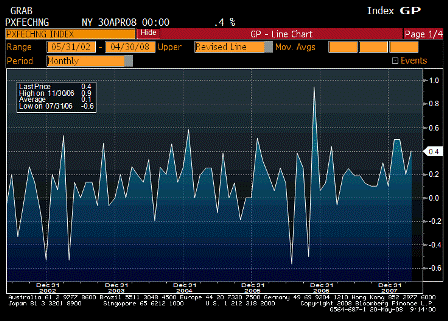
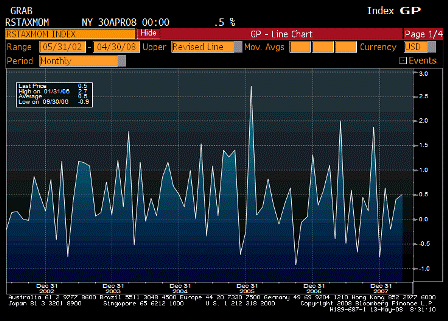
2008-05-20 PPI Ex Food & Energy MoM

PPI Ex Food & Energy MoM (Apr)

Survey 0.2%
Actual 0.4%
Prior 0.2%
Revised n/a

[top][end]


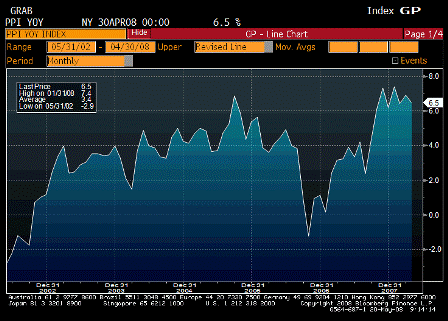
2008-05-20 Producer Price Index YoY

Producer Price Index YoY (Apr)

Survey 6.7%
Actual 6.5%
Prior 6.9%
Revised n/a

This all either gets passed through to all other prices (inflation) or real terms of trade deteriorate further – both unpleasant at best.

[top][end]


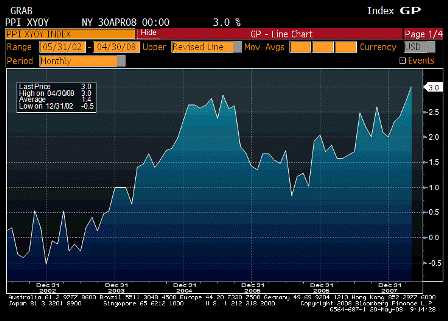
2008-05-20 PPI Ex Food & Energy YoY

PPI Ex Food & Energy YoY (Apr)

Survey 2.9%
Actual 3.0%
Prior 2.7%
Revised n/a

The pass through has started and has long way to go just based on current energy prices.

[top][end]


IBD/TIPP Economic Optimism (May)

Survey 37.8
Actual 40.3
Prior 39.2
Revised

Add one more to the ‘better than expected’ list.

[top][end]


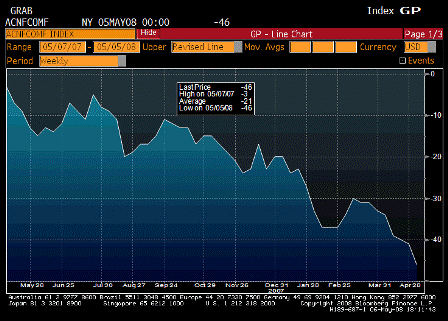
ABC Consumer Confidence (May 18)

Survey
Actual
Prior 2.9%
Revised

[comments]


[top]
2008-05-15 US Economic Releases


[Skip to the end]


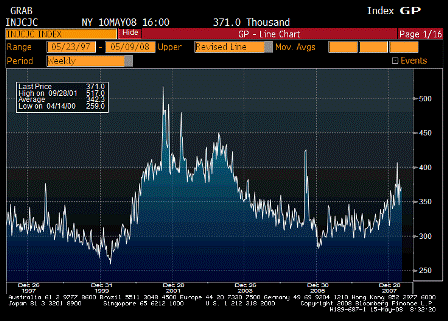
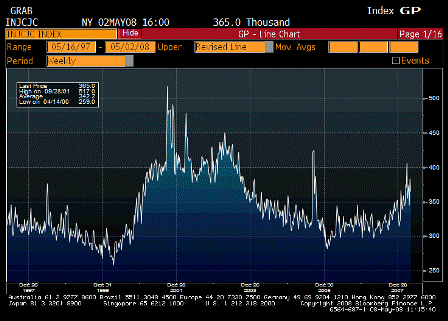
2008-05-15 Initial Jobless Claims

Initial Jobless Claims (May 10)

Survey 370K
Actual 371K
Prior 365K
Revised n/a

Looks like it’s past the peak.

[top][end]


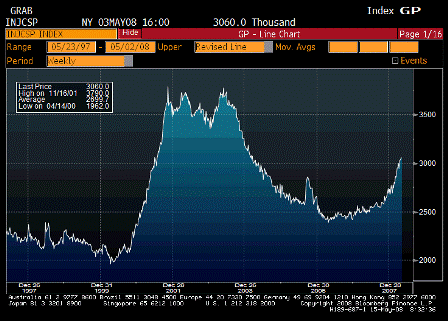
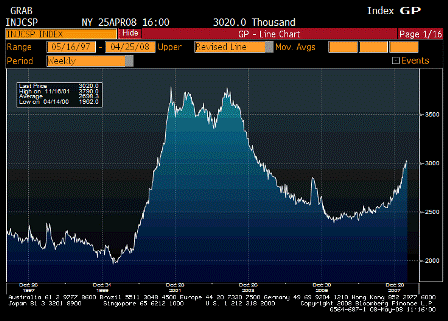
2008-05-15 Continuing Claims

Continuing Claims (May 3)

Survey 3035K
Actual 3060K
Prior 3020K
Revised 3032K

Looks like it’s not past the peak.

[top][end]


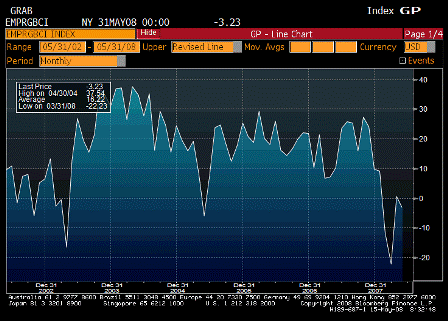
2008-05-15 Empire Manufacturing

Empire Manufacturing (May)

Survey 0.0
Actual -3.2
Prior 0.6
Revised n/a

Still off the bottom, needs another month to see where it’s going.

[top][end]


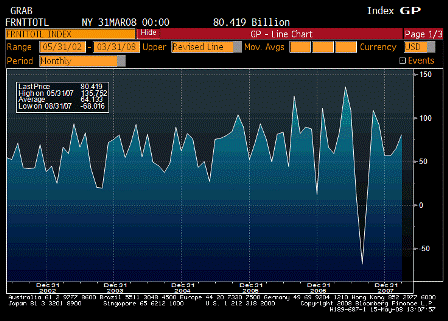
2008-05-15 Net Long-term TIC Flows

Net Long-term TIC Flows (Mar)

Survey $62.5B
Actual $80.4B
Prior $72.5B
Revised $64.9B

[top][end]


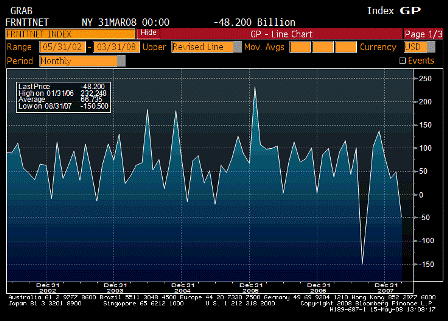
2008-05-15 Total Net TIC Flows

Total Net TIC Flows (Mar)

Survey $67.5B
Actual -$48.2B
Prior $64.1B
Revised $48.9B

In general I expect these types of numbers to follow the trade gap down.

[top][end]


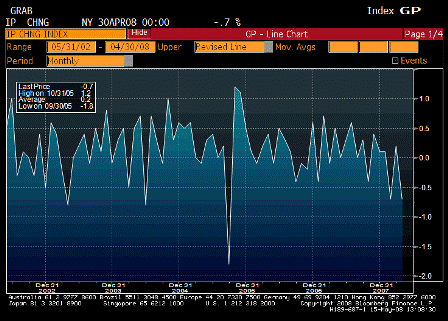
2008-05-15 Industrial Production

Industrial Production (Apr)

Survey -0.3%
Actual -0.7%
Prior 0.3%
Revised 0.2%

Still weak. Been weak for 50 years.

[top][end]


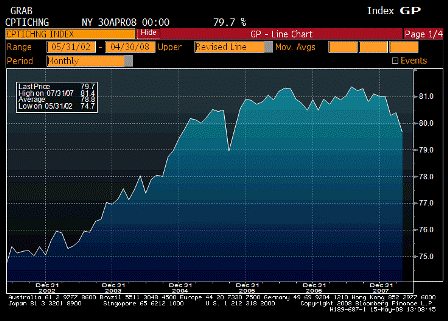
2008-05-15 Capacity Utilization

Capacity Utilization (Apr)

Survey 80.1%
Actual 79.7%
Prior 80.5%
Revised 80.4%

Weak, but not recession levels yet.

[top][end]


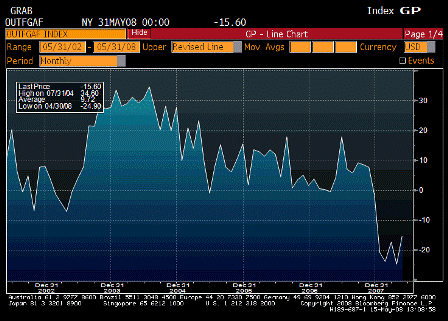
2008-05-15 Philadelphia Fed.

Philadelphia Fed. (May)

Survey -19.0
Actual -15.6
Prior -24.9
Revised n/a

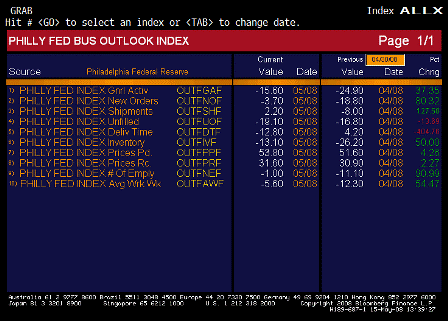
2008-05-15 Philadelphia Fed. TABLE

Philadelphia Fed. TABLE

Perking up from low levels,
prices high and moving higher

[top][end]


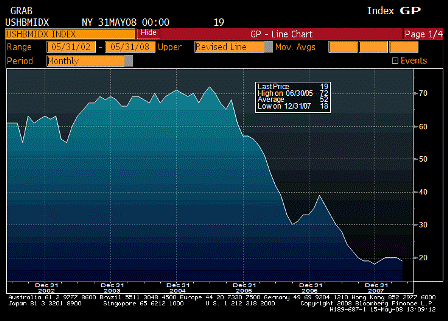
2008-05-15 NAHB Housing Market Index

NAHB Housing Market Index (May)

Survey 20
Actual 19
Prior 20
Revised n/a

Still off the lows and looking like a bottom to me.


[top]

2008-05-14 US Economic Releases


[Skip to the end]


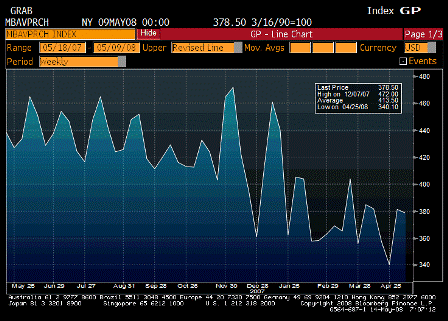
2008-05-14 MBAVPRCH Index

MBAVPRCH (May 9)

Survey n/a
Actual 378.5
Prior 381.3
Revised n/a

Not bad. Still supports the notion that housing bottomed in Q4.

[top][end]


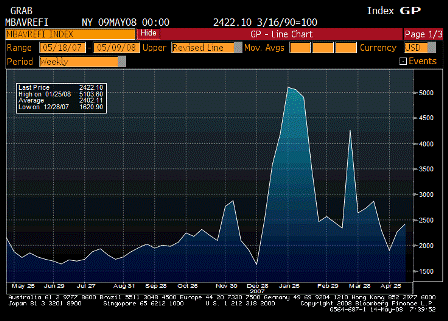
2008-05-14 MBAVREFI Index

MBAVREFI Index (May 9)

Survey n/a
Actual 2422.1
Prior 2273.8
Revised n/a

Refi market alive and well.

[top][end]


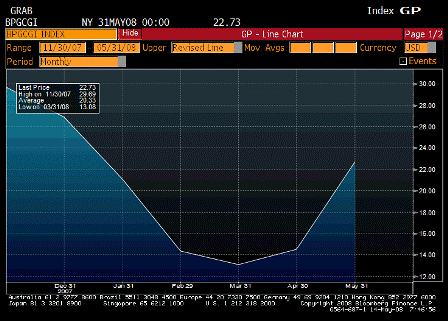
2008-05-14 Bloomberg Global Confidence

Bloomberg Global Confidence (May)

Survey n/a
Actual 22.73
Prior 14.54
Revised n/a

Speaks for itself.

[top][end]


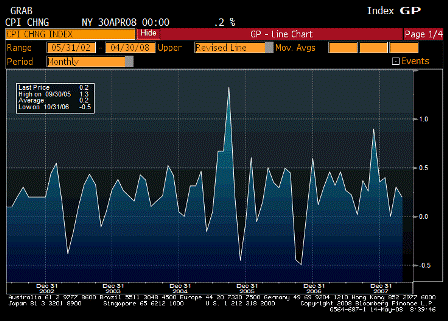
2008-05-14 Consumer Price Index MoM

Consumer Price Index MoM (Apr)

Survey 0.3%
Actual 0.2%
Prior 0.3%
Revised n/a

[top][end]


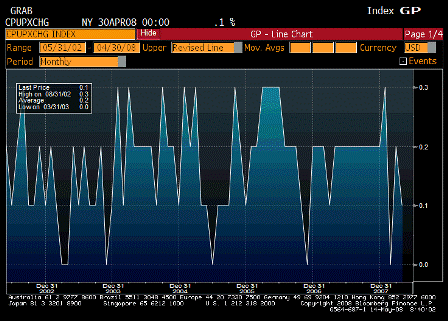
2008-05-14 CPI Ex Food & Energy MoM

CPI Ex Food & Energy MoM (Apr)

Survey 0.2%
Actual 0.1%
Prior 0.2%
Revised n/a

[top][end]


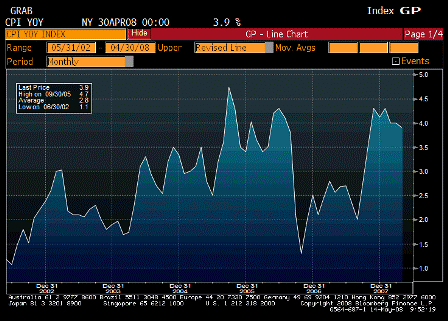
2008-05-14 Consumer Price Index YoY

Consumer Price Index YoY (Apr)

Survey 4.0%
Actual 3.9%
Prior 4.0%
Revised n/a

[top][end]


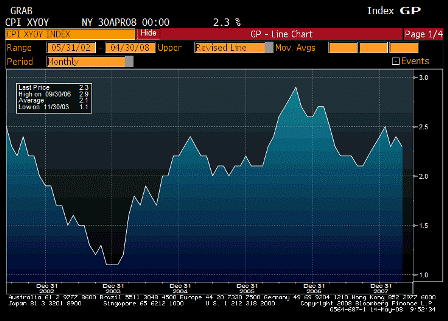
2008-05-14 CPI Ex Food & Energy YoY

CPI Ex Food & Energy YoY (Apr)

Survey 2.4%
Actual 2.3%
Prior 2.4%
Revised n/a

[top][end]


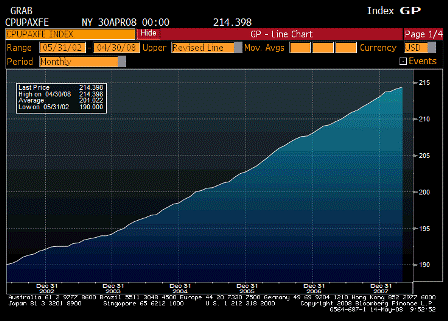
2008-05-14 CPI Core Index SA

CPI Core Index SA (Apr)

Survey n/a
Actual 214.398
Prior 214.176
Revised n/a

[top][end]


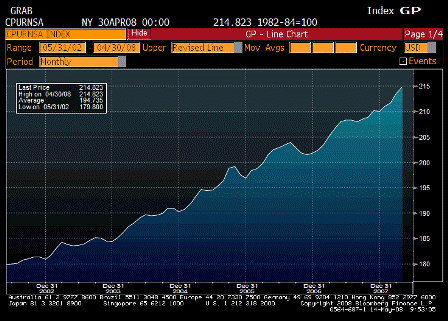
2008-05-14 Consumer Price Index NSA

Consumer Price Index NSA (Apr)

Survey 214.715
Actual 214.823
Prior 214.528
Revised n/a

It’s all being said on CNBC – seasonals that subtract this month add later in the year.


[top]

2008-05-13 US Economic Releases


[Skip to the end]


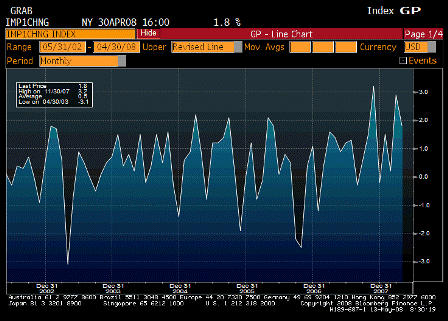
2008-05-13 Import Price Index MoM

Import Price Index MoM (Apr)

Survey 1.6%
Actual 1.8%
Prior 2.8%
Revised 2.9%

Alarming to the Fed.

[top][end]


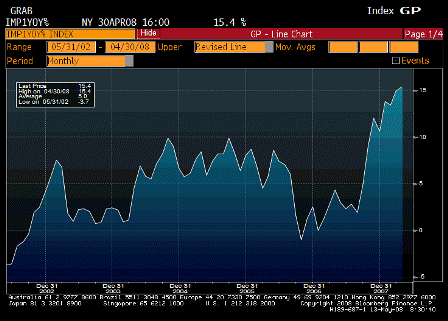
2008-05-13 Import Price Index YoY

Import Price Index YoY (Apr)

Survey 15.0%
Actual 15.4%
Prior 14.8%
Revised 14.9%

Alarming to the Fed.

[top][end]


2008-05-13 Advance Retail Sales

Advance Retail Sales (Apr)

Survey -0.2%
Actual -0.2%
Prior 0.2%
Revised n/a

As expected, but composition surprised on the upside.

[top][end]


2008-05-13 Retail Sales Less Autos

Retail Sales Less Autos (Apr)

Survey 0.2%
Actual 0.5%
Prior 0.1%
Revised 0.4%

Way better than expected, and prior revised higher as well.  Consumer alive and well.

[top][end]


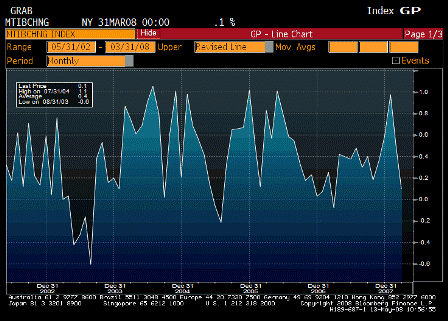
2008-05-13 Business Inventories

Business Inventories (Mar)

Survey 0.4%
Actual 0.1%
Prior 0.6%
Revised 0.5%

Another pleasant surprise that means Q1 GDP gets revised up a bit more.

[top][end]


ABC Consumer Confidence (May 11)

Survey
Actual
Prior -46
Revised

[comments]


[top]
2008-05-09 US Economic Releases


[Skip to the end]


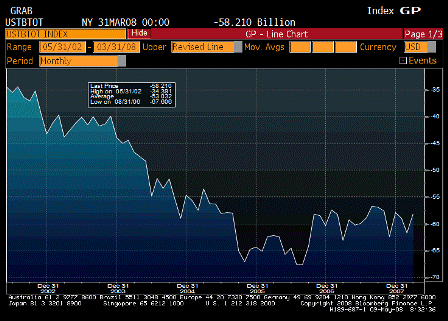
2008-05-09 Trade Balance

Trade Balance

Survey -$61.0B
Actual -$58.2B
Prior -$62.3B
Revised -$61.7B

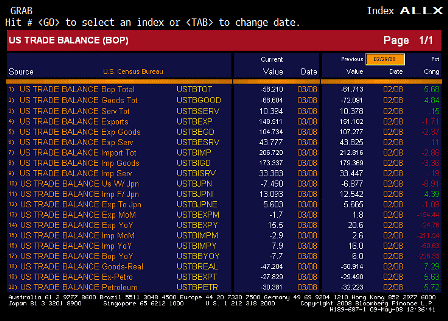
Better than expected.  Without foreign CBs and monetary authorities accumulating USD reserves, I expect the trade balance to fall to near zero, and the USD will probably fall until we get there.

Note that saying the dollar will fall until the trade balance goes to zero is not the same as saying the falling USD directly causes the trade gap to go to zero.  Yes, they are linked, but loosly and over longer periods of time, so this can be a choppy and ugly process as US real terms of trade continuously decline.

Exports up 15.5% year over year, though down a bit in March.

Street talking Q1 revisions will kick gdp up to the 1-1.5% range and more for Q2 with fiscal now kicking in.

Most of the data is coming out better than expected and showing some modest improvement.

Credit spreads seem to have peaked with the Bear Stearns raid.

Financial sector still being hit/disrupted with its continuing credit and liquidity issues as the Fed creeps towards removing some of the self imposed landmines in its own monetary operations procedures.

Housing may have bottomed but still muddling through at very low levels.

The rest of the economy doing reasonably well and leaving the financial sector in its wake.

Modestly rising GDP means the output gap is at least stable.

The question for the Fed is the level of GDP that corresponds to non inflationary growth – what they call the ‘speed limit’ for optimal long term GDP.

Seems hard to make the case that higher GDP growth won’t add to upward price pressures from levels already too high.

Meanwhile, consumers hit with higher food/crude prices still working but buying less as their remaining output gets exported.

Welcome to the new US export economy – looks good, feels bad, and the Fed and Tsy think the trade balance moving towards zero (less consumption more exports) is a ‘good thing’ .

[top][end]

2008-05-09 Trade Balance TABLE

Trade Balance TABLE


[top]
2008-05-08 US Economic Releases


[Skip to the end]


2008-05-08 Initial Jobless Claims

Initial Jobless Claims (May 3)

Survey 370K
Actual 365K
Prior 380K
Revised 383K

Still far from recession levels anticipated several months ago by most forecasters.

[top][end]


2008-05-08 Continuing Claims

Continuing Claims (Apr 26)

Survey 3020K
Actual 3020K
Prior 3019K
Revised 3030K

Far from recession levels but the chart is still looking higher. This often lags initial claims.

[top][end]


2008-05-08 Wholesale Inventories

Wholesale Inventories (Mar)

Survey 0.5%
Actual -0.1%
Prior 1.1%
Revised 0.9%

Another sign that the odds of a recession are lower than anticipated a few months ago.

[top][end]


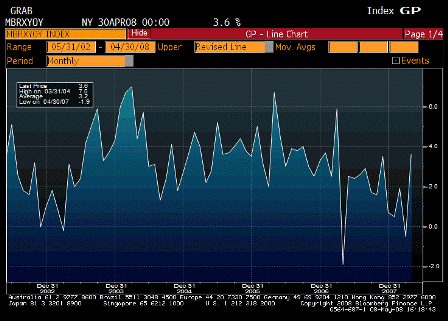
2008-05-08 ICSC Chain Store Sales YoY

ICSC Chain Store Sales YoY

Survey n/a
Actual 3.6%
Prior -0.5%
Revised n/a

More evidence the worst is over, and recession was never in the cards.


[top]
2008-05-07 US Economic Releases


[Skip to the end]


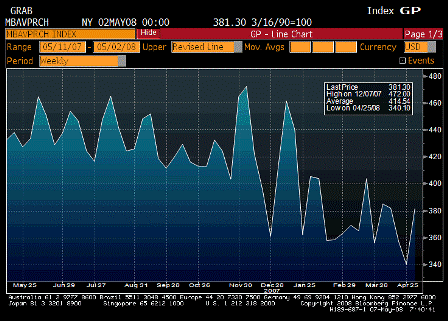
2008-05-07 MBAVPRCH Index

MBAVPRCH Index (May 2)

Survey n/a
Actual 381.3
Prior 340.1
Revised n/a

Seems to have at least stabilized.

[top] [end]
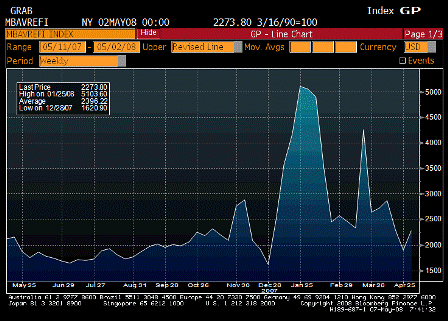


2008-05-07 MBAVREFI Index

MBAVREFI Index (May 2)

Survey n/a
Actual 2773.8
Prior 1905.2
Revised n/a

Doing okay.

[top][end]


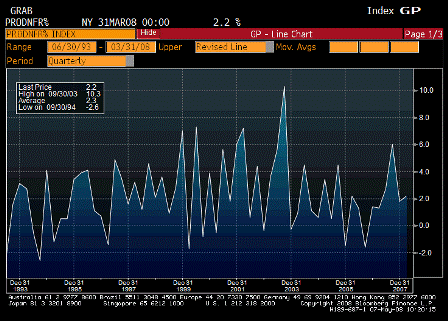
2008-05-07 Nonfarm Productivity

Nonfarm Productivity (1Q P)

Survey 1.5%
Actual 2.2%
Prior 1.9%
Revised 1.8%

Better than expected. Usually rises with output.

[top][end]


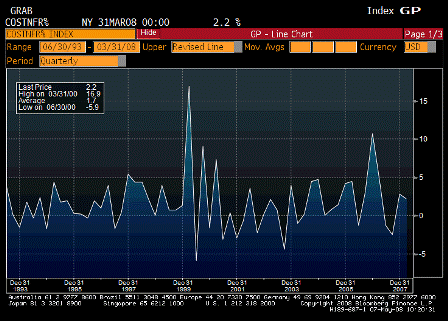
2008-05-07 Unit Labor Costs

Unit Labor Costs (1Q P)

Survey 2.6%
Actual 2.2%
Prior 2.6%
Revised 2.8%

Better then expected, prior revised up. This series isn’t doing much.

Look to imports from China for a handle on unit labor costs as well.

[top][end]


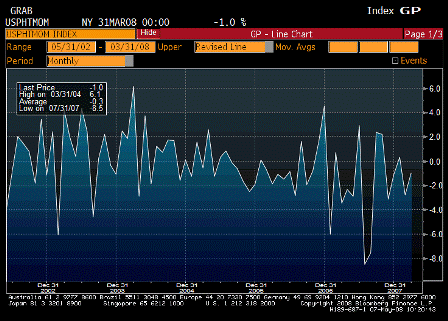
2008-05-07 Pending Home Sales MoM

Pending Home Sales MoM (Mar)

Survey -1.0%
Actual -1.0%
Prior -1.9%
Revised -2.8%

Still falling some, seasonally adjusted, and with actual inventory going down there is less to buy.

[top][end]


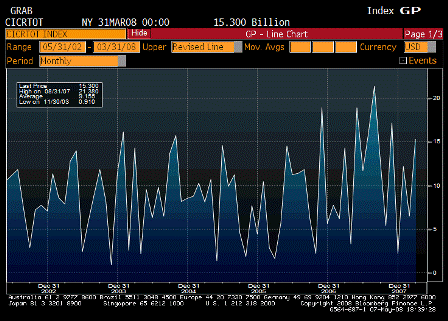
2008-05-07 Consumer Credit

Consumer Credit (Mar)

Survey $6.0B
Actual $15.3B
Prior $5.2B
Revised $6.5B

Volatile series.
Seems to be holding up as incomes hold up.

[top]