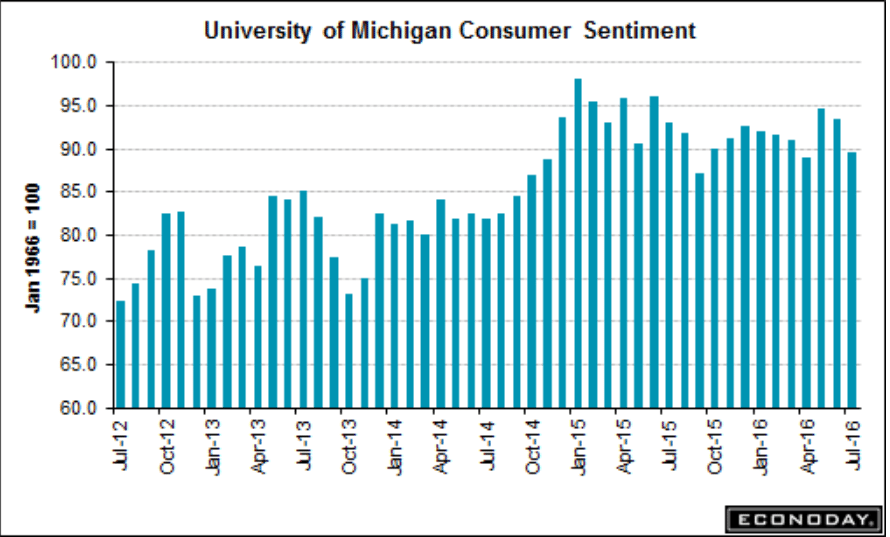
CPI, retail sales, Empire State Mfg, Industrial production, Business inventories, Consumer sentiment, JPM earnings, UK comment, China comment

A bit less than expected- nothing to cause the Fed to be alarmed. You’d think that by now they’d realize that all that rate cutting and so called ‘money printing’ has nothing to do with the price level or ‘accommodation’…:

7-15-1

Highlights

Price pressures evident the last two months down the supply chain are not yet appearing in consumer prices where the CPI rose only 0.2 percent in June for a weak year-on-year rate that is not going in the right direction, at plus 1.0 percent vs 1.1 percent in the prior three months. Ex-food & gas, consumer inflation also rose 0.2 percent with this year-on-year rate moving 1 tenth higher to a respectable but still soft 2.3 percent.

Strength in service prices was a highlight of yesterday’s producer price report and is also a highlight in this report, up 0.3 percent for the third straight month. This gain helps offset weakness in commodity prices which rose only 0.1 percent. Lodging away from home shows an outsized gain for a second month, at plus 0.6 vs May’s 0.7 percent, though housing overall is flat at only plus 0.2 percent. Transportation rose 0.6 percent in the month with medical care up 0.4 percent, gains offset by a 0.1 percent decline for food and a 0.4 percent dip for apparel.

Energy prices rose 1.3 percent in the month and follow similar gains in the four prior months, pressure reflecting the pass through from the manufacturing and wholesale sectors. For consumer prices in general, however, this effect is still limited, yet today’s report does show some signs of new life and may boost confidence among policy makers that the inflation picture is improving.

Pretty large downward revision to last month, when the larger than expected increase was taken as evidence of a recovery. If this revised number had been reported last month it would have been taken as a setback. Watch for that to happen again with this month’s larger than expected increase, and I’ll be watching next month to see if it’s also revised.

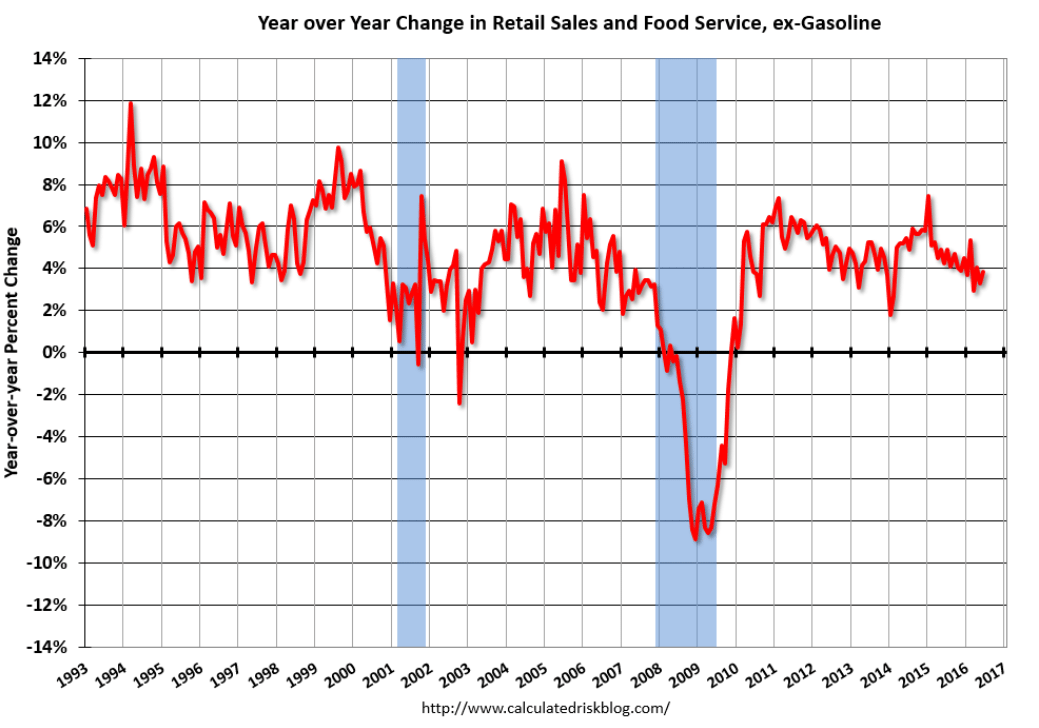
Also, note that the year over year chart continues to show severely depressed levels of growth and no sign yet of material improvement:

7-15-2

Highlights

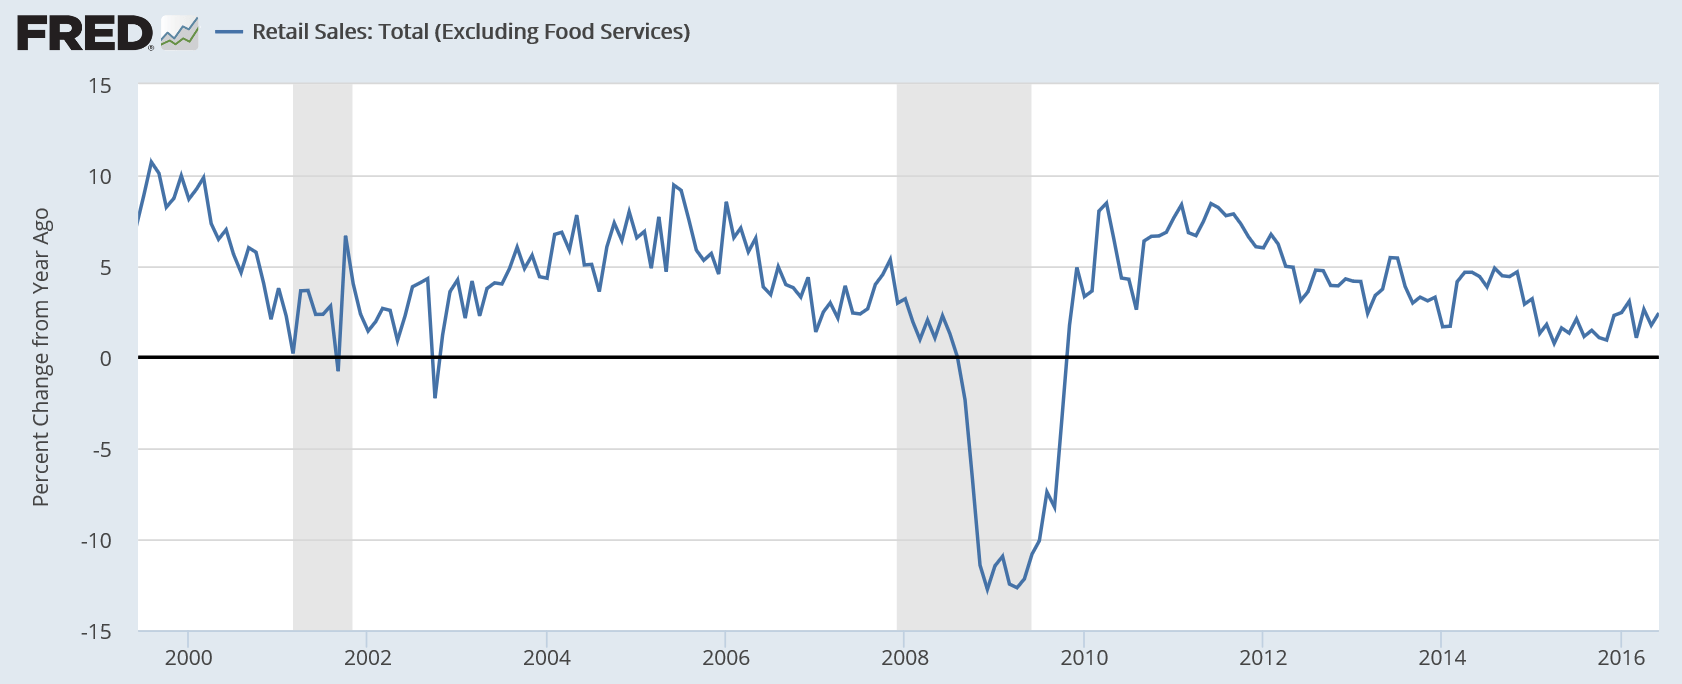
June proved a fabulous month for the consumer though May, after revisions, proved only so so. Flat vehicle sales could not hold back retail sales which jumped a much higher-than-expected 0.6 percent in June, with May revised however 3 tenths lower to plus 0.2 percent. Excluding vehicles, June retail sales surged 0.7 percent as did the key ex-auto ex-gas reading.

Ex-auto ex-gas offers a gauge on underlying trends in consumer spending, a dominant one of which is ecommerce as nonstore retailers popped a 1.1 percent surge in the month which follows even stronger gains in prior months. Department stores, up 0.9 percent, show a big comeback in the month with sporting goods & hobbies strong for a second month. An outsized gain, one that hints at adjustment issues and the risk of a downward revision, is a 3.9 percent surge in building materials & garden equipment, a component that had been lagging.

This report is a major plus for the second-half economic outlook not to mention coming data on the second quarter (sales for April, after the second revision, are at a standout plus 1.2 percent). The job market is healthy and the consumer is alive and spending.
7-15-3
A setback here:

7-15-4

Highlights

The first anecdotal report on the factory sector for the month of July is not very promising as the Empire State index barely held in the plus column, at 0.55 vs 6.01 in June and minus 9.02 in May. New orders, after jumping to 10.90 in June, are down 1.82 in this month’s report. This combined with yet another contraction for backlogs, at minus 12.09, do not point to strength ahead for other readings. Employment is one of these readings and, after coming in at zero last month, is at minus 4.40. The workweek is also negative as are inventories which continue to contract. Price data are mixed, showing steady energy-related pressure for inputs but no life for selling prices. The factory sector has been up and down this year on a trend that is dead flat. Watch for the industrial production report coming up this morning at 9:15 a.m. ET. It will offer the first definitive data on the factory sector for the month of June.

Better than expected for the month, largely from a gain in vehicle output. However with vehicle sales sagging and down vs last year this month’s gain is likely to be a one time event:

7-15-5

Highlights

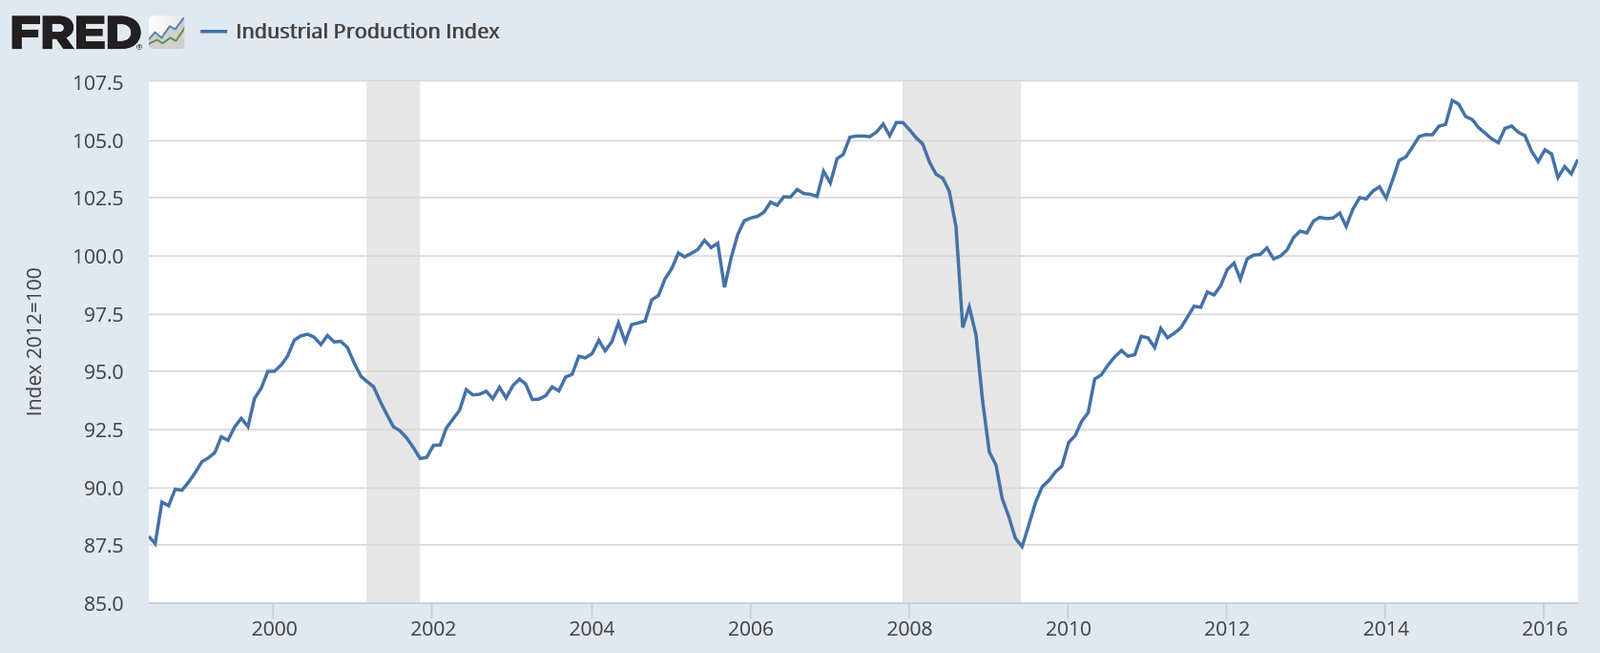
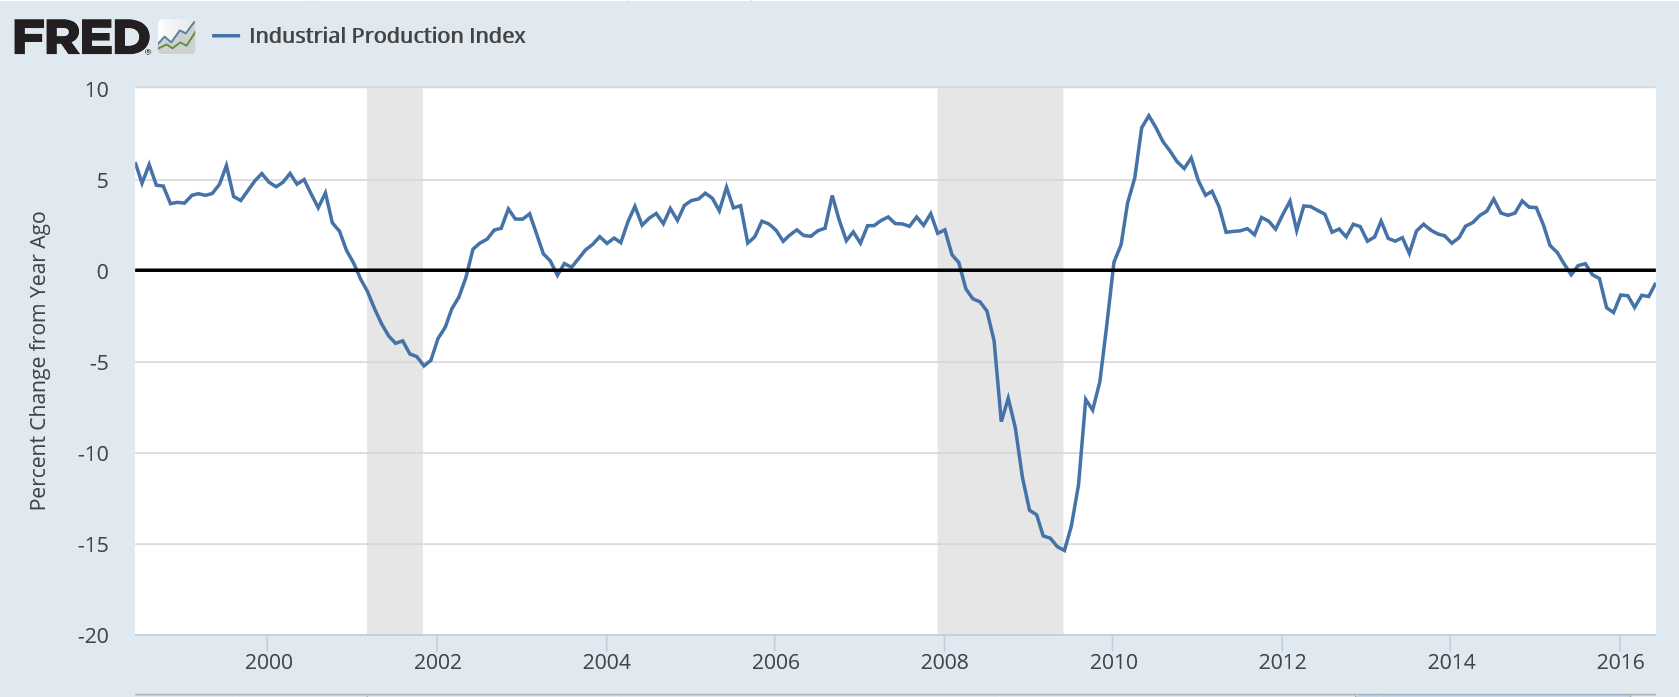
Vehicles held down industrial production in May but not in June, making for a big 0.6 percent gain that is just outside Econoday’s high-end estimate. The production of motor vehicles & parts surged 5.9 percent in June following a 4.3 percent drop in May. Year-on-year, this component tops the list with 7.8 percent growth compared to only 0.4 percent growth for manufacturing as a whole. Only due to vehicles, manufacturing managed to put in a good showing in June, up 0.4 percent on the month to reverse a revised 0.3 percent decline in May.

Headline production also got a big boost from utilities where output rose 2.4 percent in the month. Mining output, which is down 10.5 percent year-on-year, posted a second straight small gain, at plus 0.2 percent which is promising and follows the recovery in energy and commodity prices.

Looking at details deeper in the report, the output of business equipment rose a solid 0.7 percent but the year-on-year rate, in what is definitive evidence of weakness in business investment, is in the negative column at minus 0.6 percent. The output of consumer goods, up 1.6 percent on the year, rose 1.1 percent in the month in what is another good showing in this report.

The second quarter had been looking soft before this report and especially this morning’s retail sales report. A June bounce in the factory sector, facing global weakness and unfavorable currency appreciation, may not extend much into the third quarter but it may make a difference in the final readings of the second quarter.

From the Fed: Industrial production and Capacity Utilization

Industrial production increased 0.6 percent in June after declining 0.3 percent in May. For the second quarter as a whole, industrial production fell at an annual rate of 1.0 percent, its third consecutive quarterly decline. Manufacturing output moved up 0.4 percent in June, a gain largely due to an increase in motor vehicle assemblies. The output of manufactured goods other than motor vehicles and parts was unchanged. The index for utilities rose 2.4 percent as a result of warmer weather than is typical for June boosting demand for air conditioning. The output of mining moved up 0.2 percent for its second consecutive small monthly increase following eight straight months of decline. At 104.1 percent of its 2012 average, total industrial production in June was 0.7 percent lower than its year-earlier level. Capacity utilization for the industrial sector increased 0.5 percentage point in June to 75.4 percent, a rate that is 4.6 percentage points below its long-run (1972–2015) average.

Read more at http://www.calculatedriskblog.com/#JhY5L16LgIWsMrRf.99

You can see how weak this cycle is, particularly when compared to prior cycles. The rate of growth has been low and the total is below where it was in 2007:
7-15-6

7-15-7

7-15-8
Still way too high/recession levels:

7-15-9

Highlights

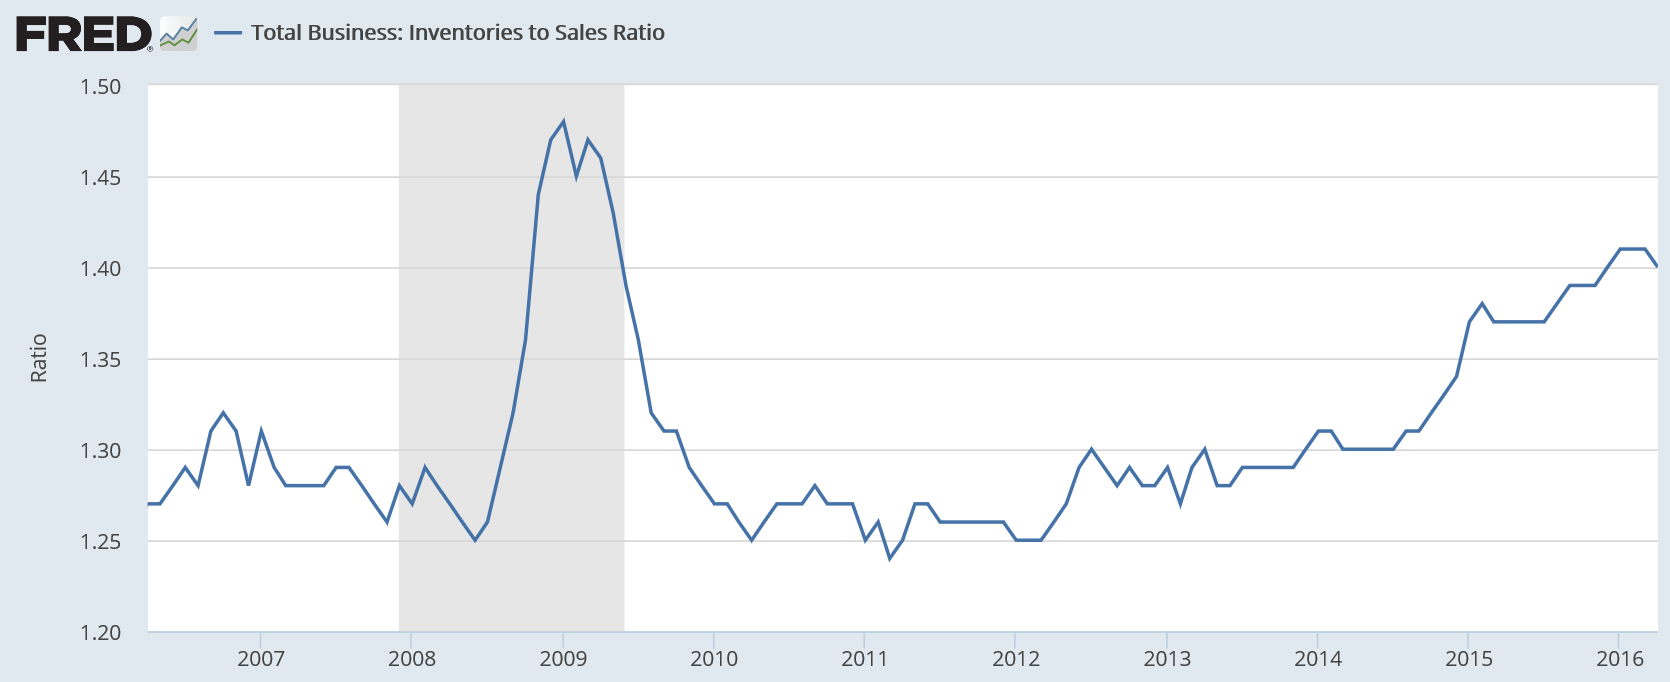
Businesses are keeping their inventories in check amid slow sales. Inventories rose only 0.2 percent in May following April’s even leaner 0.1 percent rise. Sales in May also rose 0.2 percent keeping the inventory-to-sales ratio unchanged at 1.40, which is a little less lean than this time last year when the ratio was at 1.37.

Retail inventories did rise an outsized 0.5 percent in May in a build, however, that looks to be drawn down by what proved to be very strong retail sales in June. Manufacturing inventories fell 0.1 percent in May with wholesalers up 0.1 percent.

Year-on-year, total inventories are up 1.0 percent which looks fat against what is a 1.4 percent decline in sales. With Brexit now in play, businesses are certain to keep ever tightening control over their inventories, a factor that will keep down current GDP growth but will help the outlook for employment and future GDP.

(this chart not updated yet for today’s 1.40 print)
7-15-10
Big setback here, confirming the downtrend:

7-15-11

7-15-12
Ok, stronger than expected, but down from same quarter last year, with other banks reporting similar or worse, and overall rates of loan growth are decelerating:

J.P. Morgan Posts Stronger-Than-Expected Results on Trading Surge

By Emily Glazer and Peter Rudegeair

July 14 (WSJ) — J.P. Morgan’s second-quarter profit fell slightly from a year earlier, to $6.2 billion. Loan growth topped 10%. Revenue rose 2.4% from a year ago to $24.38 billion. The bank’s net-interest margin fell 0.05 percentage point from the prior quarter to 2.25%. J.P. Morgan’s loan portfolio grew to $858.6 billion. And total net-interest income of $11.4 billion was up 6% from a year earlier. Total consumer loans, excluding credit cards, grew by 14% to $361.31 billion. The bank’s overall provision for credit losses ballooned 50% to $1.4 billion because of reserve increases and higher net charge-offs.

Looks to me the UK can now threaten not to leave unless they get favorable terms?
;)

‘Reasonable’ that Britain wants financial services access to EU: Schaeuble

By Joseph Nasr

July 14 (Reuters) — UK Treasury Secretary Philip Hammond’s remarks that British financial services should retain access to the European Union’s single market are “reasonable,” German Finance Minister Wolfgang Schaeuble said on Thursday.

So maybe those western educated monetarists will recognize that fiscal adjustments do work…:

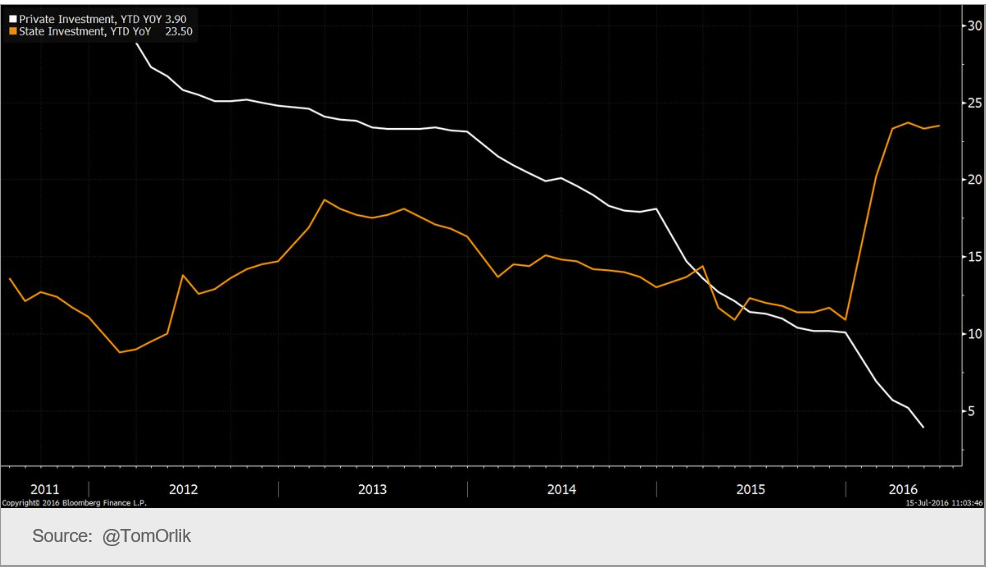
China Q2 economic growth beats estimates as stimulus shores up demand

July 15 (CNBC) — China’s economy narrowly beat estimates Friday with a 6.7 percent expansion on-year in the three months through June. The headline figure was steady from the previous quarter’s 6.7 percent pace. Second quarter Gross Domestic Product (GDP) was up 1.8 percent from the first quarter. The Chinese government is aiming for growth of 6.5 to 7 percent this year. For 2015, Beijing logged 6.9 percent growth. Friday’s release was the first since China tweaked its methodology of compiling data by adding research and development (R&D) spending into its calculations for GDP.
7-15-13

Oil prices, Regional feds, Long term deficit forecasts, China trade

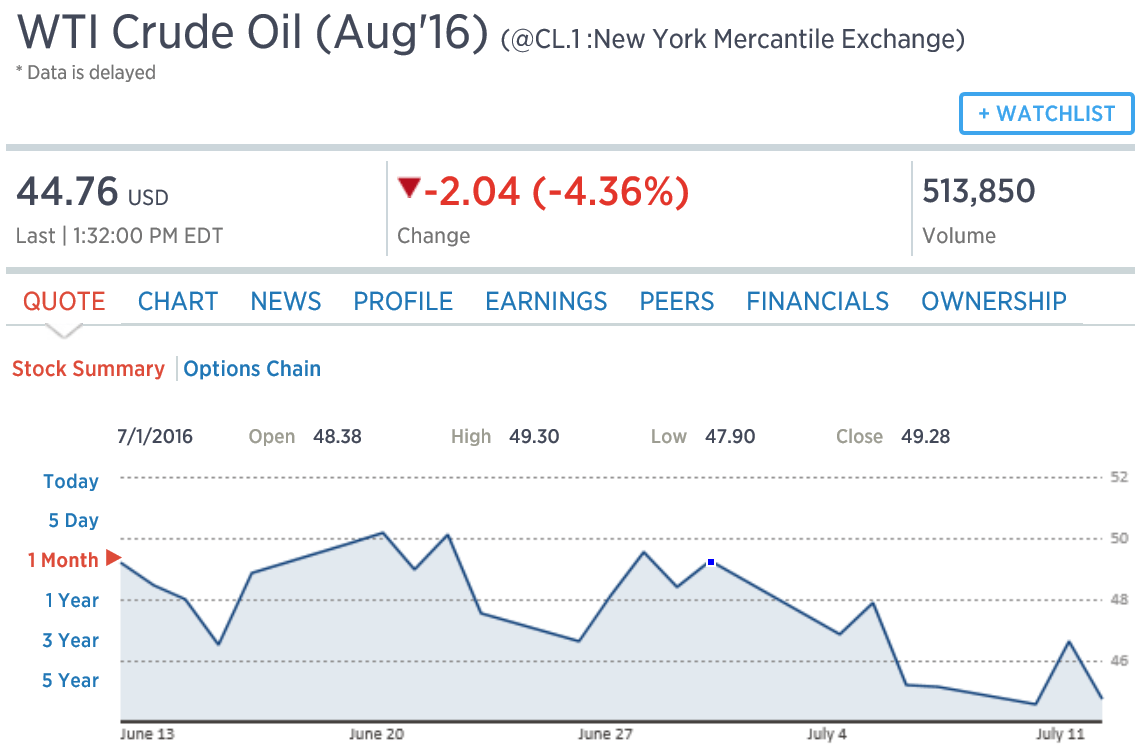
A few weeks ago I posted the announcement of Saudi price cuts, suggesting this could be meant to bring down prices, which now seems to be happening:

7-13-5
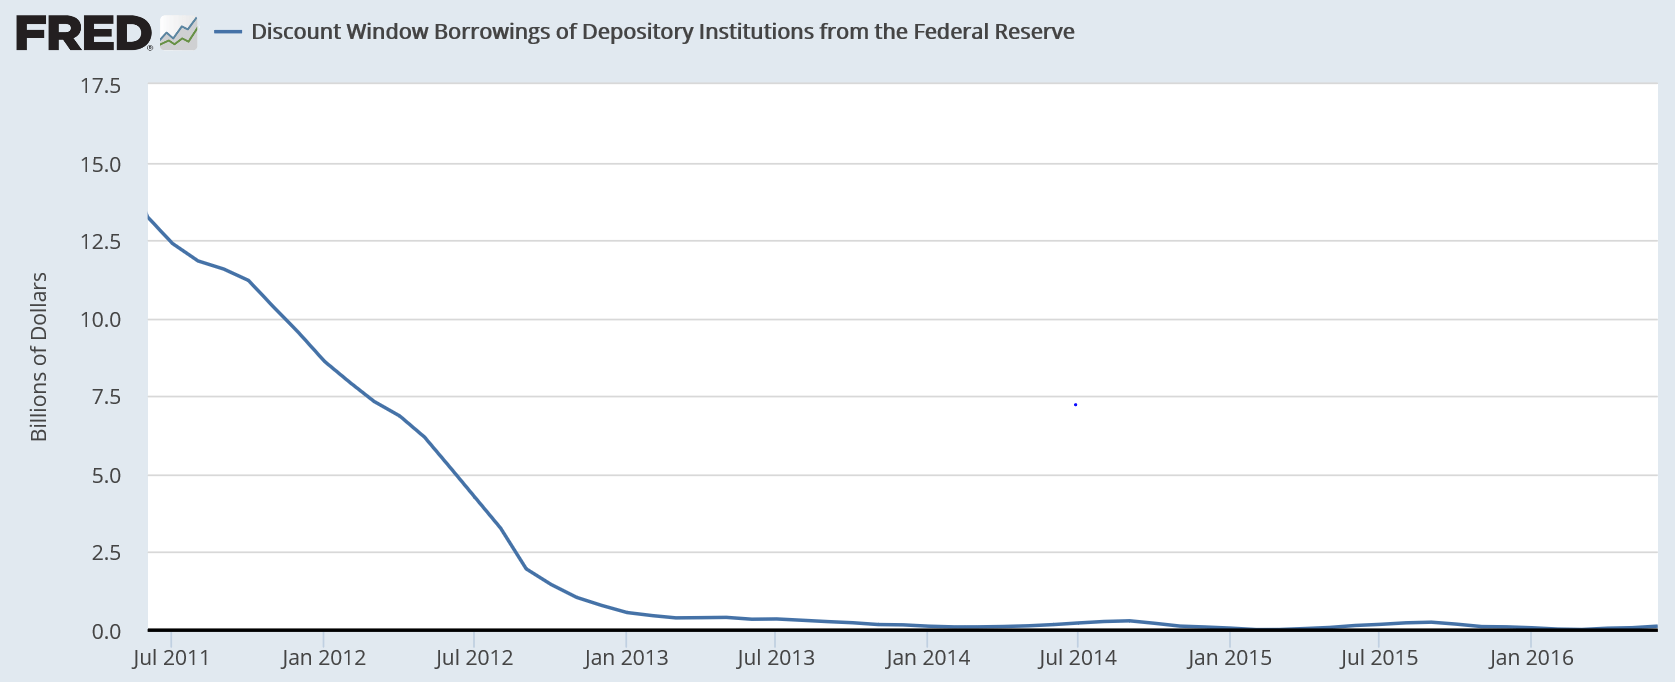
Again, with no loan demand, they are calling for higher rates, presumably to slow down lending:

Six Fed banks called for discount rate hike: minutes

By Lindsay Dunsmuir

July 12 (Reuters) — The number of regional Federal Reserve banks pushing the central bank to raise the rate it charges commercial banks for emergency loans rose to six in June, minutes from the Fed’s discount rate meeting released on Tuesday showed. The Federal Reserve banks of Kansas City, Richmond, Cleveland and San Francisco continued to push for an increase and were joined this time around by Boston and St. Louis. Those that wanted an increase cited “expected strengthening in economic activity and their expectations for inflation to gradually move toward the 2 percent objective.”

7-13-6

At the macro level the only financial problem from Federal deficit spending per se would be some kind of inflation problem. Therefore the burden of proof is on anyone claiming there is a long term deficit problem to show there is a long term inflation problem. So with the Fed’s and CBO’s forecasts at 2%, and with the Treasury TIPS markets showing something less than that, the burden of proof is on those claiming a long term deficit problem to show those forecasts are sufficiently wrong. Yet the ‘headline left’ unquestioningly concedes that there is a long term deficit problem, and the rest is history… :(

CBO Expects Higher Long-Term Deficits and Lower Interest Rates

By Nick Timiraos

July 12 (WSJ) — Federal debt, which has doubled since 2008 to about 75% of gross domestic product, will rise to 122% in 2040, up from an estimate of 107% last year. On the latest forecasts, the national debt would exceed GDP by 2033. Last year’s projections had the U.S. reaching that threshold in 2039. The CBO projects that the debt will reach 141% of GDP in 2046, down from an earlier estimate of 155% made this past January. The latest CBO estimates envision the 10-year Treasury rate, after inflation, reaching just 1.9% over the long term, down from estimates of 2.2% last year and 3% in 2013.

The drop in imports and exports tells the story of the collapse of global trade. Not good:

China’s June exports, imports fall more than expected

July 13 (CNBC) — China’s June exports and imports fell more than expected. In June, exports fell 4.8 percent year-on-year percent, while imports declined 8.4 percent, percent, in U.S. dollar terms. In yuan terms, exports rose 1.3 percent from a year ago while imports declined 2.3 percent. That compared with May exports in dollar-denominated terms tanking 4.1 percent on-year, more than double April’s 1.8 percent fall, while imports edged down 0.4 percent, compared with April’s 10.9 percent drop. In yuan terms, May trade data had painted a different picture, with exports up 1.2 percent on-year and imports 5.1 percent higher.

PMI manufacturing, ISM manufacturing, Construction spending, China PMI, Manhattan apartment sales

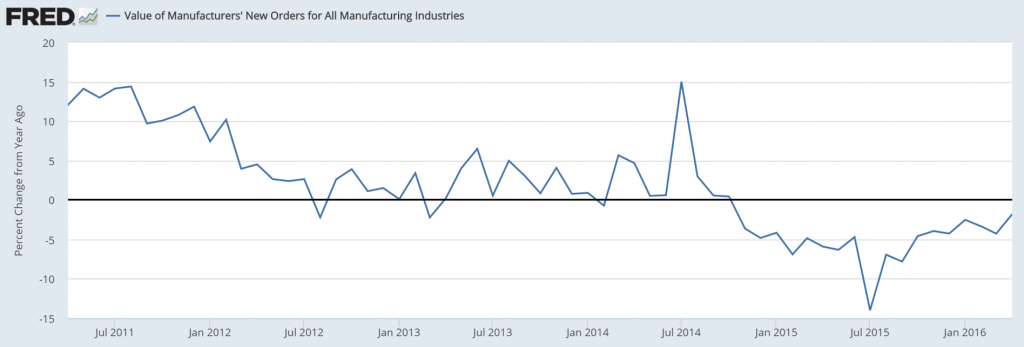
Manufacturing historically just chugs along at maybe a 3% growth rate or so. However as oil capital expenditures collapsed, manufacturing ratcheted down accordingly. And now it looks like it may be resuming it’s traditional modest growth rate from a much lower base than otherwise. This is not to say that the reduction in spending on capex is being replaced, as the spending deficiency now continues after having spread to the (much larger) service sector.

Still on the low side but better than expected:

7-1-1

Highlights
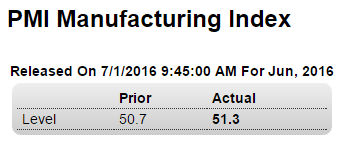
The final manufacturing PMI for June is little changed from the flash, down 1 tenth to a 51.3 level that points to no more than modest growth for the sector. But the news is mostly good in June, at least compared to May when the index was even weaker at 50.7. June saw a pickup in new orders and a 2-year high in export growth. Production was also up as was employment. But inventories were down as the sample, in a defensive move, keeps a lid on restocking. Coming up next is the closely watched ISM manufacturing where a modest 51.5 headline is expected.

This chart is about a month old:
7-1-2
Also better than expected:
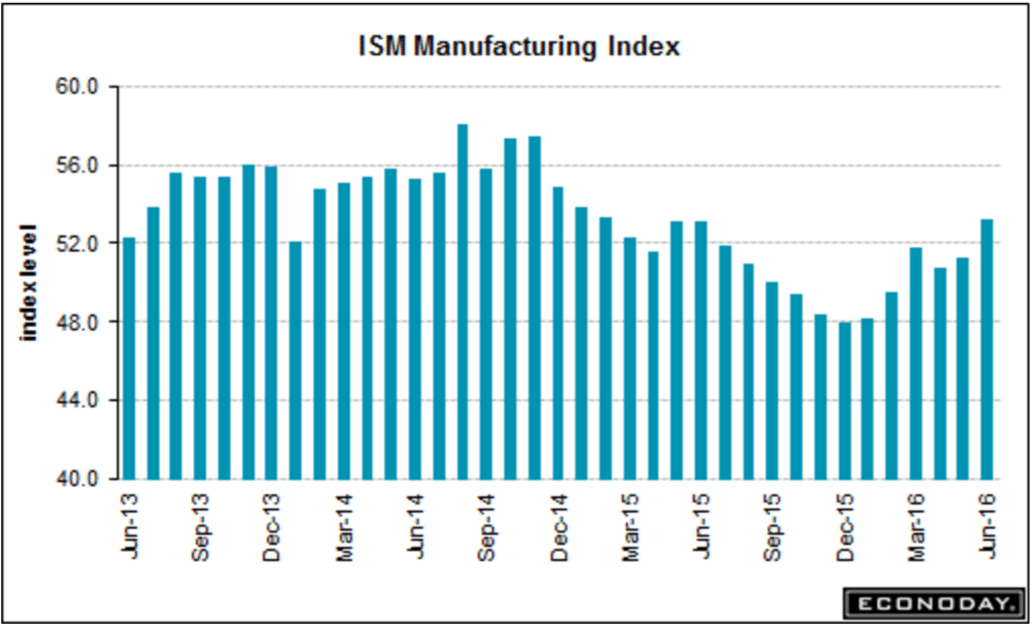
7-1-3

Highlights
ISM’s sample is reporting significant acceleration to a level that is still, however, no more than moderate. The index easily beat expectations, at 53.2 in June and the best reading since February last year. New orders are especially solid, at 57.0 for a 1.3 point gain and the best reading since March. And export orders are keeping up, 1.0 point higher at 53.5 for the 4th straight plus-50 showing. Production is active, inventories may be on the climb, but employment is flat. A negative for profits but a plus for the inflation outlook is continued pressure in raw material costs. New orders are very closely watched in this report and the strength will lift expectations for June’s factory data.

7-1-4
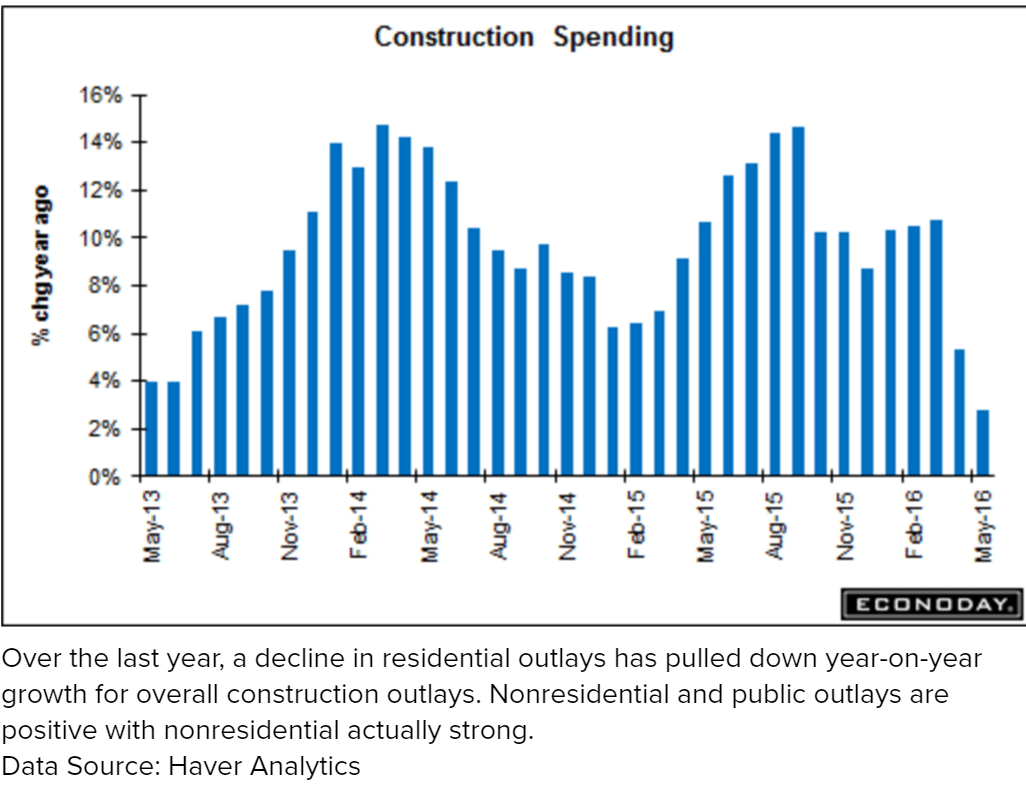
Growth in construction spending continues its decline, as this hope as a driver of positive growth continues to disappoint:
7-1-5

Highlights
Construction spending proved surprisingly weak in May, down 0.8 percent vs expectations for a 0.6 percent gain. The decline follows an even steeper and downwardly revised 2.0 percent drop in April. Spending on single-family homes, despite the rise underway in housing starts, fell 1.3 percent in May for a third straight decline with the year-on-year gain moving slightly lower to a still constructive 6.3 percent. Spending on multi-family homes has been much stronger, up 1.8 percent in the month for a 23.9 percent year-on-year gain.

Construction spending on non-housing has been very soft with May down 0.7 percent following April’s 0.1 percent dip. Year-on-year, private nonresidential spending is up 3.9 percent led by the office category and pulled down by manufacturing. Public spending on buildings and highways has been flat to slightly negative.

Housing is on the climb this year but a gradual one, which has its positives given the bubbles of the past. The construction sector as a whole still looks to be a positive contributor to overall economic growth.

7-1-6
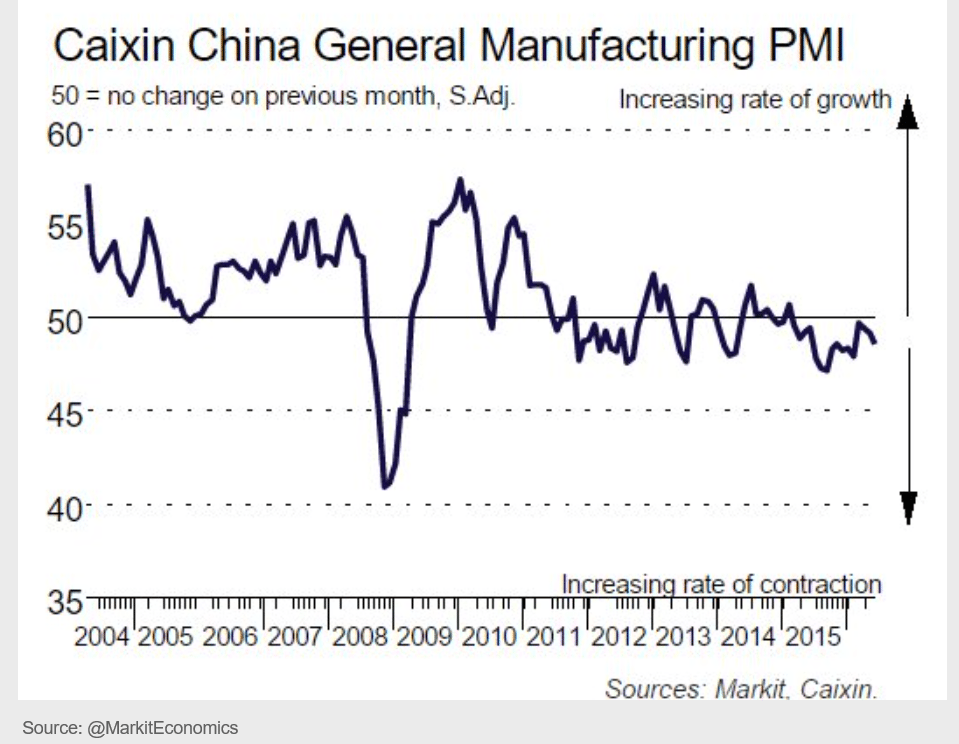
Remember when markets cared about China’s economy?

;)
7-1-7
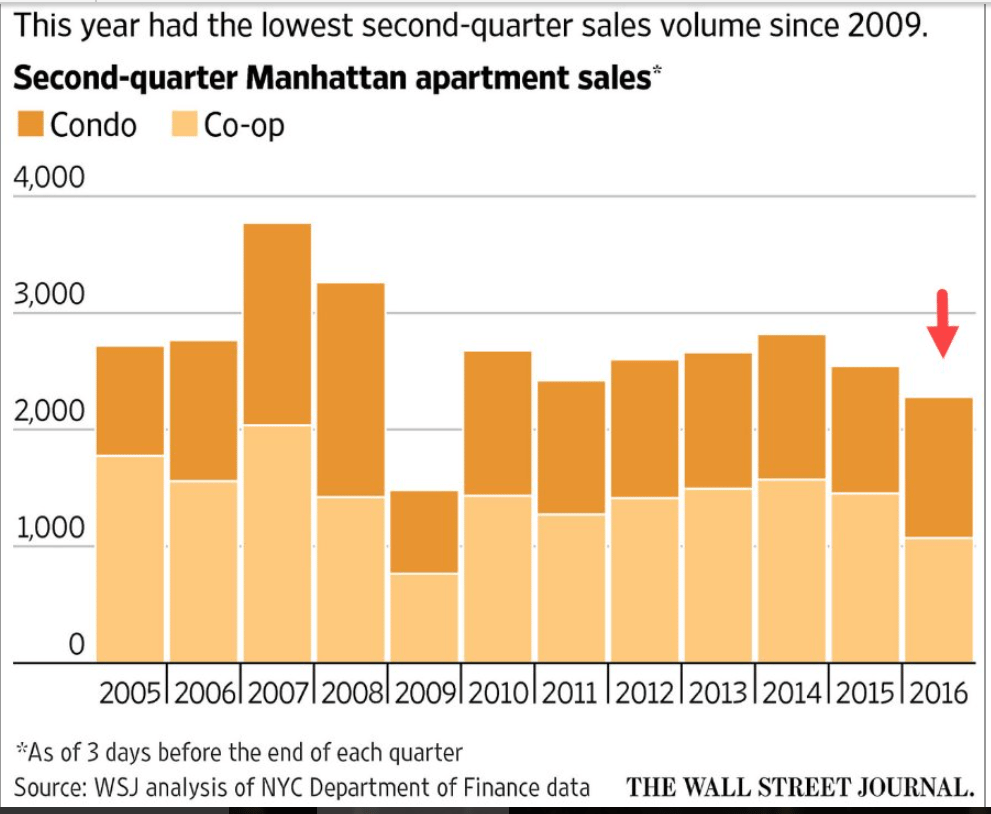
Looks like the collapse in oil capex hit the NYC rentiers as well ;):
7-1-8

Brexit comment, trade, PMI services, Comments on CNBC article on Trump’s plan

Still looks to me like the vote will have no material financial consequences?
6-27-1

“The UK will have to renegotiate 80,000 pages of EU agreements, deciding those to be kept in UK law and those to jettison. British officials have said privately that nobody knows how long this would take, but some ministers say it would clog up parliament for years.”

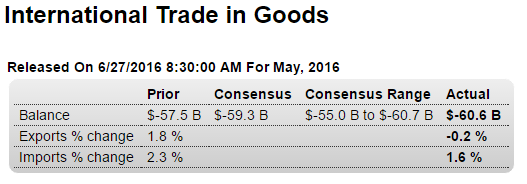
As previously discussed, the drop in oil prices led to increased consumer imports and reduced exports, both of which fundamentally work against the dollar:
6-27-2

Highlights
Goods exports were soft in May while at the same goods imports rose, making for a widening in the nation’s goods gap to $60.6 billion from April’s $57.5 billion. Exports fell 0.2 percent reflecting declines in auto exports and, unfortunately, capital goods exports as well. Imports rose a sharp 1.6 percent with imports of consumer goods especially strong in a gain that points to business confidence in U.S. retail expectations. Imports of industrial supplies show a large gain made larger by upward price effects tied to oil. But like the export side, capital goods imports were weak hinting at contraction in business investment and continuing trouble for productivity growth. Though the import data is consistent with strong domestic demand, exports point to soft global demand. Note also that the widening of May’s gap is a negative for second-quarter GDP.
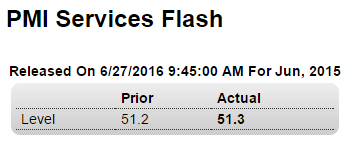
Still weak:
6-27-3

Highlights
Service sector activity remains slow, little changed at an index of 51.3 for Markit’s June flash. New orders are picking up but remain soft while job creation is slowing for a third straight month. Confidence in the year-ahead outlook continues to moderate. Price data are subdued both for inputs and for selling prices. The bulk of the U.S. economy is chugging along at marginal rates of growth heading into Brexit fallout and ongoing market volatility.
Here’s why Trump’s economic plan would spark a recession: Moody’s Mark Zandi

By Stephanie Landsman

June 26 (CNBC) —

If Donald Trump becomes president and implements his current economic plan, Moody’s Analytics chief economist Mark Zandi said it would create dire consequences for the U.S. economy.

“The key thing is the very large budget deficits which would ensue under his plan,” Zandi recently told CNBC’s “Fast Money.”

The large deficits would add to output and employment, as every economist who gets paid to be right knows and incorporates into his forecasts.

That is, if congress increases the deficit by cutting taxes or increasing spending, GDP forecasts are always revised up accordingly.

Zandi, a former economic advisor to 2008 republican presidential candidate John McCain, is the man behind a new report that suggested a Trump presidency would send the economy spiraling into a recession. He cites the “massive tax cuts” in Trump’s plan as his plan’s biggest problem.

“Only a small part of that is paid for so you get very large budget deficits and much higher government debt—on top of an economy that’s already at full employment,” Zandi explained. That “results in much higher interest rates which combined with a lot of other things undermines corporate earnings and ultimately stock prices.”

All evidence shows increased deficits support higher earnings. And interest rates are set by the Fed, so they would go up only if the Fed votes to raise them. And the size of the deficit per se is not the driving force of the Fed’s reaction function.

And while headline unemployment is relatively low at 4.7%, he also knows that doesn’t mean there is no one left to be hired, particularly with the ultra low participation rates that contribute to the near 10% U6 rate of unemployment.

Zandi, who’s getting ready to release special analysis of Hillary Clinton’s economic plan, believes a watered-down Trump measure is the likeliest scenario if he wins the race for the White House. Zandi added that a less aggressive economic plan would still negatively alter the current economy’s state.

“I don’t think the Congress, no matter what it (the plan) looks like, would actually pass what he has proposed,” he said. “It’s pretty clear that everyone would end up in a pretty bad place.”

Moody’s isn’t the only one to find fault with Trump’s tax plan. Just months ago, the nonpartisan Tax Foundation said the real estate mogul’s tax and spending proposals were “unrealistic”, and could explode the U.S.’s debt burden.

However, the Trump campaign took issue with Zandi’s research, firing back with salvos of its own.

“The errors in Zandi’s analysis are profound,” Trump campaign senior policy advisor Stephen Miller wrote in a statement released to CNBC.

“Closing the trade gap with China would create millions of jobs, as would lowering taxes, unleashing energy production, streamling regulations, and ending the fiscal drain of open borders,” Miller added.

Nor does any of that address Zandi’s point about the us being at full employment with no one left to hire.

Zandi, however, responded that his study is “error free.”

And they all miss the risk of depression should Trump attempt to execute his play to pay off the public debt in 8 years.

Instead, thinking that would be a good thing, it’s never addressed…

Non performing loans, Working poor, China export policy, STX-STT ferry

Check out the second chart:

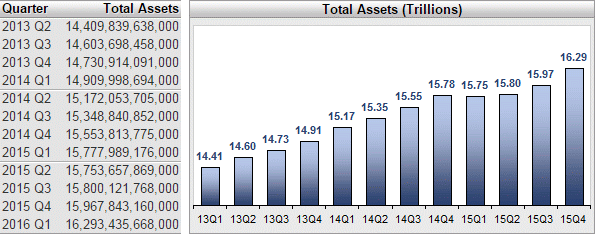
2016 Q1 call report data is available at BankRegData.com. Industry wide assets leapt to $16.293 Trillion adding an amazing $325.59 Billion (2.04%) in the 1st Quarter.
er-5-12-16-1
The $325.59 Billion increase is the largest since (you guessed it) the $337.96 Billion jump in 2008 Q1 – a span of 32 quarters.

er-5-12-16-2
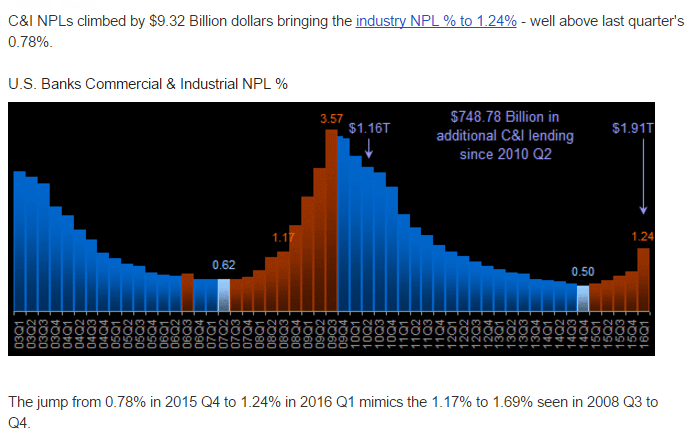
What’s even more amazing is that the 1.24% would really be 1.28% if C&I lending had stayed flat. The jump to 1.24% was actually lower than it should have been due to the additional $71.168 Billion in additional C&I lending over last quarter.

I would caution that we’re beyond the “it’s Energy related” part of the commentary. C&I delinquencies are rising in most geographies and at most big banks.

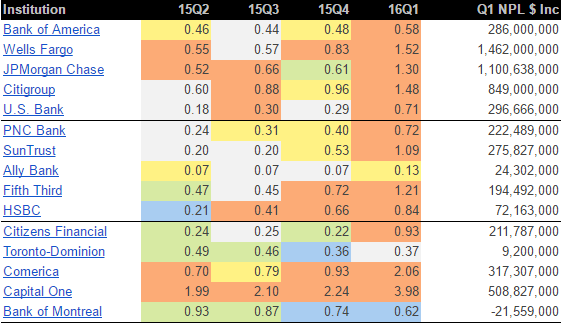
The following table lists the Top 15 C&I lenders top to bottom. At the top is Bank of America with $239.58 Billion in C&I (at an average Yield of 2.97%) and Bank of Montreal is #15 with $24.88 Billion in C&I.

C&I NPL % Heat Map Top 15 C&I Lenders
er-5-12-16-3
Wells Fargo has seen it’s C&I NPL % climb from 0.55% in 2015 Q2 to 1.52% in 2016 Q1 – NPL $ climbed $1.46 Billion in the quarter.

Take a gander at Capital One jumping from 2.24% to 3.98%. Even SunTrust which had been performing exceptionally well has seen rates go from 0.20% 3 quarters ago to 1.09% – a fivefold jump in the rate in 6 months.

The two standouts in the group are Toronto-Dominion and Bank of Montreal. Both banks have seen NPL % rates decline over the past year. I’m sure it’s just a coincidence that both are BankRegData clients. Yes, shameless plug and one I hope they’ll forgive me for.

Levity aside, C&I NPLs are getting worse and are likely to climb considerably higher in the next few quarters. We can’t add near $750 Billion in new lending in 6 years and not expect higher subsequent NPLs.

One in three US manufacturing workers are on welfare: Study

Philadonna Wade’s story plays out across middle America on a daily basis but is seldom told. It’s the story of the working poor who labor in tough jobs — like Wade’s position as an assembler for a Ford Motor plant — that don’t pay enough to keep them off public assistance.

In fact, fully 1 in 3 Americans who work in the manufacturing sector are receiving some form of public assistance, according to a study released this week by the UC Berkeley Center for Labor Research and Education. Of those who came to their positions through temp agencies, a category in which Wade falls, half are on some type of safety net program.

It’s not that Wade wants to be on food stamps and Medicaid, among other programs, it’s that the mother of four has no choice.

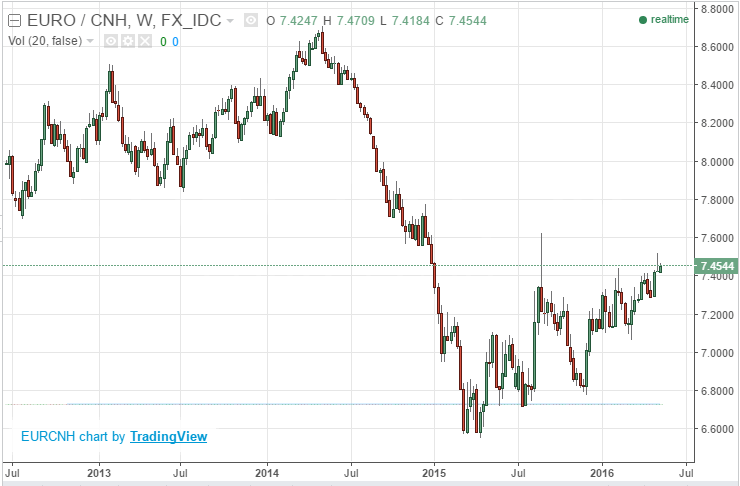
China continues to push exports, including what appears to me to be (re)targeting the euro area by buying euro a year or so after Draghi freightened them into lightening up on their euro reserves:

China Introduces Proposals to Boost Exports

May 9 (WSJ) — In policy guidelines released Monday, the State Council, the government’s cabinet, called for greater lending by banks to support small-scale and profitable exporters and said it would expand rebates of value-added taxes. It also promised to reduce short-term rates for export credit insurance, which protects exporters against nonpayment by foreign customers. “Presently, the foreign trade situation is complicated and severe, elements of uncertainty and instability are increasing and downstream pressures are continuously growing,” the State Council said.
er-5-12-16-4

Ferryboat Touches Water for First Time; Launch Trip Projected for Mid-June

China, Fed’s labor market index

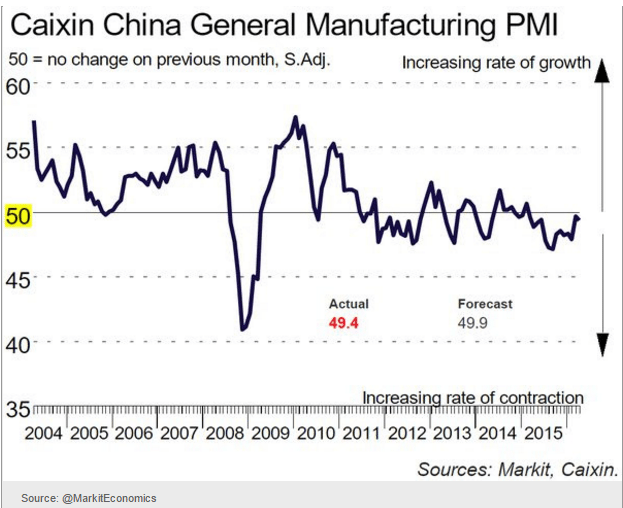
More evidence global demand is slowing as both exports and imports fell. In any case the trade surplus continues, providing fundamental currency strength which probably translates into continuing fx reserve builds:

China’s exports drop again in April; imports also plunge
er-5-9-1
Highlights
Employment has been the economy’s central strength but has not been in the positive column for the labor market conditions index which remains in contraction for a 4th straight month, at minus 0.9 in April. Still, this is an improvement from March’s minus 2.1, a month when payroll growth and the participation rate were stronger but not other data that are tracked in this composite including the 12-month reading for average hourly earnings or the jobs-hard-to-get subcomponent of the consumer confidence report which both showed strength in April. The index, experimental in nature, is a broad composite of 19 separate indicators and, as yet at least, is rarely cited by policy makers.

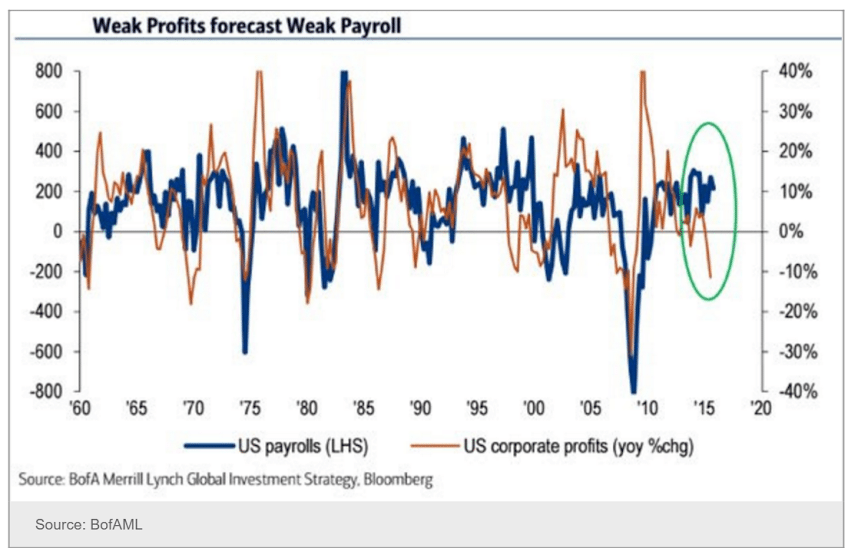
Euro reserves, Rail week, St. Louis Fed, China, Profits and Payrolls

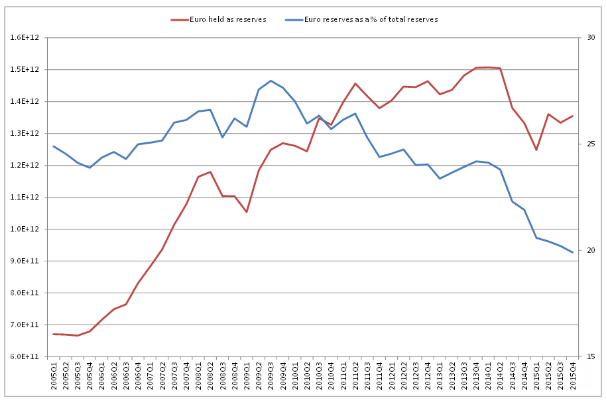
The euro level is in dollar terms, but in any case, as previously discussed, the chart shows that there was an exit from the euro when the ECB initiated its aggressive interest rate and QE policies. And the way I see it it was that selling that weakened the euro, not anything ‘fundamental’:
er-5-6-16-1

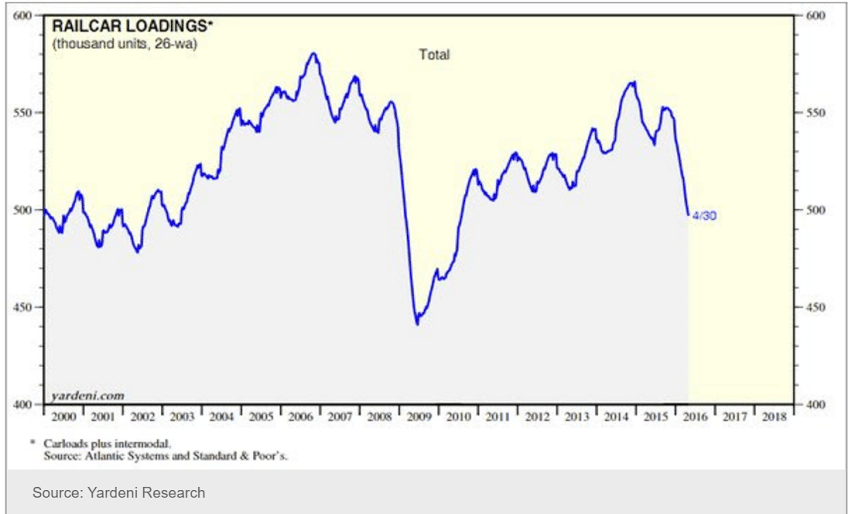
Rail Week Ending 30 April 2016: Rail Contracted 11.8 Percent From Same Month One Year Ago

Week 17 of 2016 shows same week total rail traffic (from same week one year ago) declined according to the Association of American Railroads (AAR) traffic data. All rolling averages moved deeper into contraction.

er-5-6-16-2

Negative Interest Rates: A Tax in Sheep’s Clothing

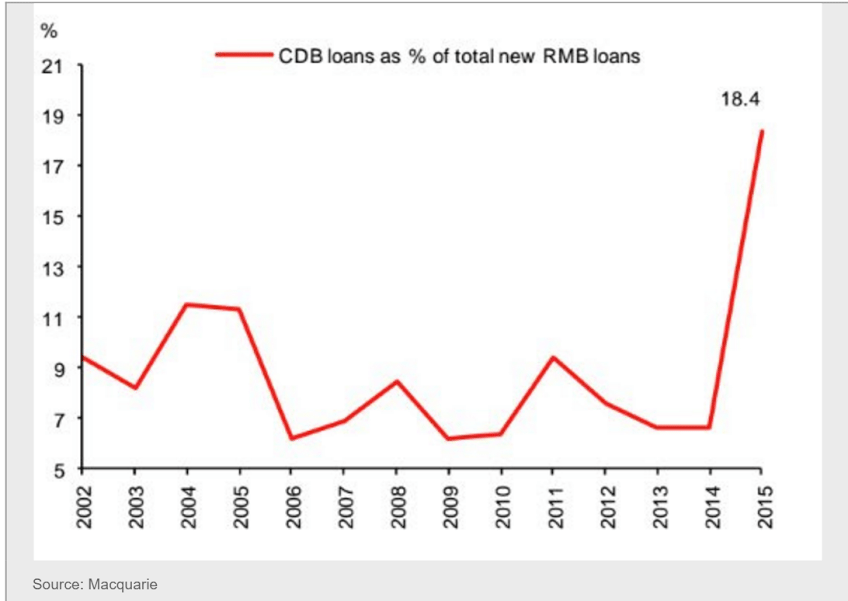
The Development Bank has been stepping up its ‘off balance sheet deficit spending’:
er-5-6-16-3
er-5-6-16-4

Mtg purchase apps, ADP, Trade, Factory orders

Same story, depressed and growing too slowly to matter:

MBA Mortgage Applications
er-5-4-16-1
Highlights
Purchase applications for home mortgages managed to rise 1.0 percent in the April 29 week, but refinancing continued to decline, down 6.0 percent after falling 5.0 percent in the prior week. Though purchase applications are 13 percent higher than the same week a year ago, the year-on-year gain has narrowed sharply from the 30 percent gains seen as recently as March. Rates crept slightly higher, with the average 30-year mortgage for conforming loans ($417,000 or less) up 2 basis points to 3.87 percent.

Weak:
er-5-4-16-2

ADP Employment Report
er-5-4-16-3
Highlights
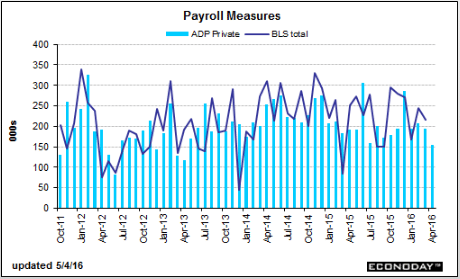
Consumer spending and economic growth are slowing and now the labor market, at least based on ADP’s estimate, is softening. ADP sees private payrolls rising only 156,000 in April for what would be one of the weakest prints of the economic cycle and the lowest since 142,000 in February 2014. ADP, whose reputation as a leading indicator isn’t perfect, has nevertheless been on a 4-month hot streak and today’s report is certain to raise talk of trouble for Friday’s employment report.

er-5-4-16-4
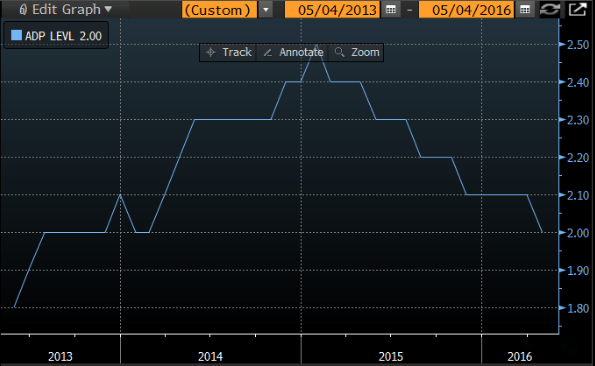
And here’s the year over year growth chart. Can you spot the point where oil capex collapsed? ;)
er-5-4-16-5

Global trade continues its collapse:

er-5-4-16-6
Highlights
The nation’s trade gap narrowed in March but, unfortunately, is not a positive for the economic outlook. The gap came in at $40.4 billion in March vs a revised $47.0 billion in February and largely reflects a downgrade for imports which fell 3.6 percent in the month vs the prior month’s 1.3 percent rise. Contraction in imports, though a positive for the gap, is however a negative indication for domestic demand, especially in this report as consumer goods show unusual weakness. And indications on foreign demand are also negative with exports, despite the positive effects of this year’s depreciation in the dollar, slipping 0.9 percent vs February’s 1.1 percent rise.

Imports of consumer goods fell a very steep $5.1 billion in the month followed, in yet another major negative, by core capital goods which fell $1.6 billion. The former points to weak consumer demand and the latter points to weakness in business expectations. Oil was not a factor on the import side, averaging $27.68 per barrel vs February’s $27.48 and making for a total petroleum deficit of $3.0 billion vs February’s $3.5 billion deficit.

Weakness on the export side is also concentrated in consumer goods, down $1.6 billion in the month, and includes a separate $0.7 billion decline for autos. Industrial supplies are also down. One positive is a $1.3 billion rise in core capital goods which, however, follows a long string of declines. A solid positive is a further gain for service exports, up 0.5 percent in the month and generally reflecting demand for the nation’s technical and managerial expertise.

The nation’s gap with China, reflecting the decline in imported consumer goods, narrowed very sharply, to $20.9 billion in March from February’s $28.1 billion. The narrowing with China offset widening gaps with the EU, at $13.1 billion, and with Mexico, at $5.4 billion, and also with Japan, at $6.7 billion.

Trade data are always very revealing, in this case pointing unfortunately to declining cross-border demand and showing little benefit, at least so far, from this year’s decline in the dollar.

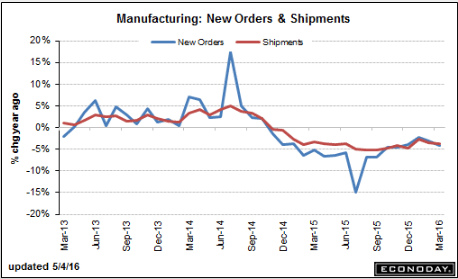
Factory orders and shipments continue in negative territory on a year over year basis:
er-5-4-16-7
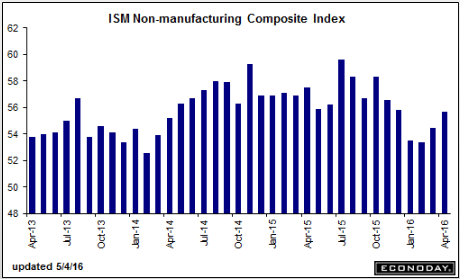
A bit of improvement here but still looking like growth in this sector will be lower this year than it was last year, and may still be trending lower:
er-5-4-16-8

China, Redbook retail sales, UK manufacturing, yen comments

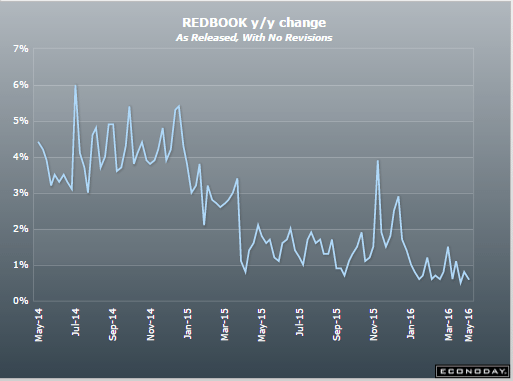
Still in negative territory:
er-5-3-1
Still stone cold dead:
er-5-3-2
er-5-3-3
Exporters have serious clout over there.

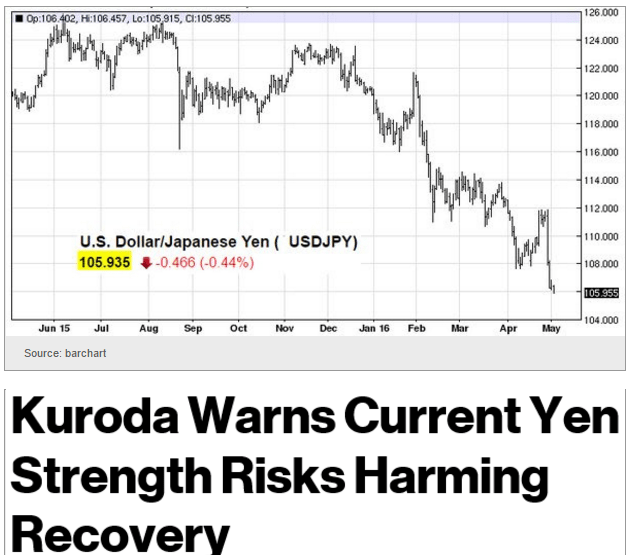
Intervention on their behalf would be no surprise:

Japan exporters stand to take nearly $10bn hit from rising yen

The yen’s sharp appreciation threatens to undercut profits at major Japanese exporters by more than 1 trillion yen ($9.37 billion) this fiscal year, outweighing any benefits of a stronger home currency for some companies, estimates by The Nikkei show.

Even at exchange rates of 110 yen to the dollar and 125 yen to the euro — levels on which many companies are basing their fiscal 2016 earnings estimates — 25 of the country’s biggest exporters, including Toyota Motor and Komatsu, would see their combined operating profits fall 1.14 trillion yen on the year owing to currency movements alone.

er-5-3-4

CNY/EUR, construction spending

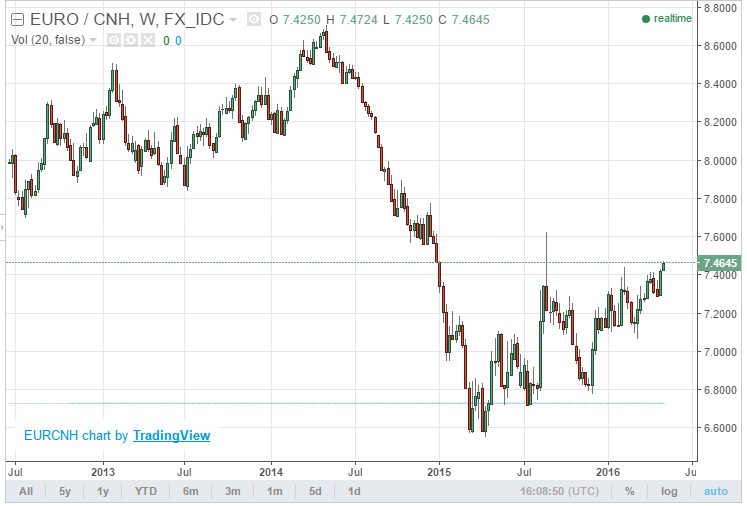
Good chance China is now rebuilding euro reserves sold when they panicked over negative rates, qe, etc. In fact, they could now be targeting the euro area for export growth:
er-5-2-16-1
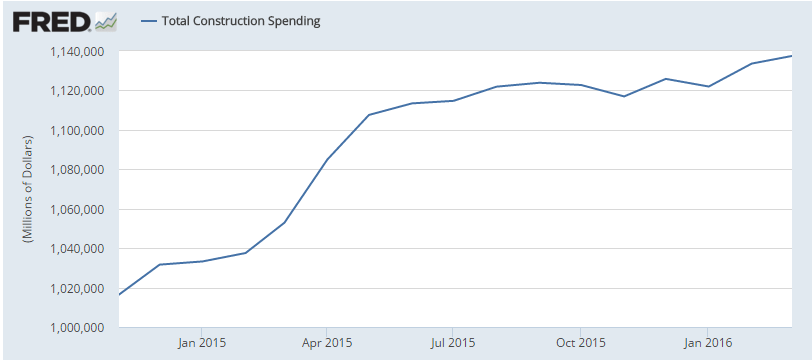
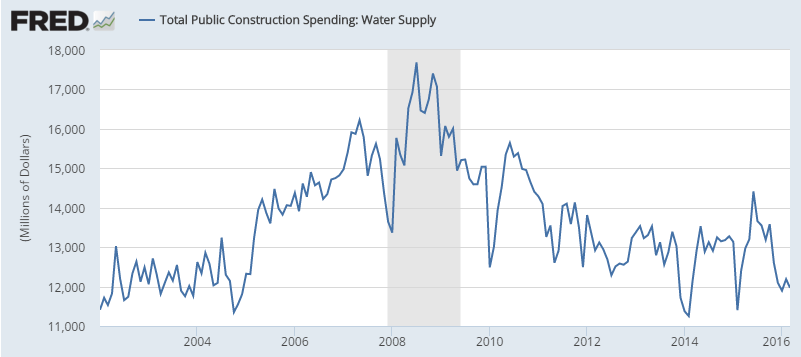
This came out this am. Note how construction flattened in the middle of last year when the NY tax incentives expired, and so far there is no sign of a repeat of last year’s growth for this year:
er-5-2-16-2
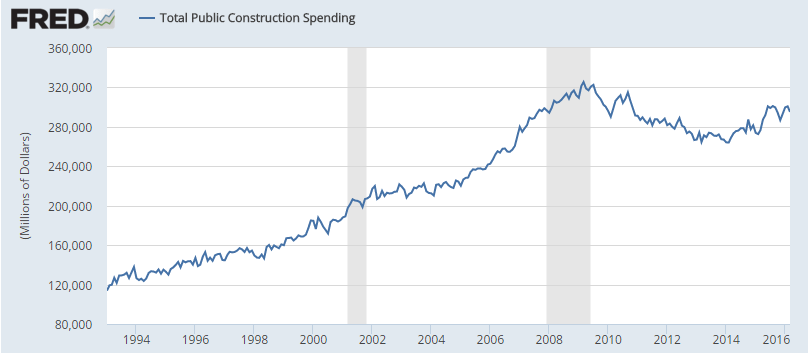
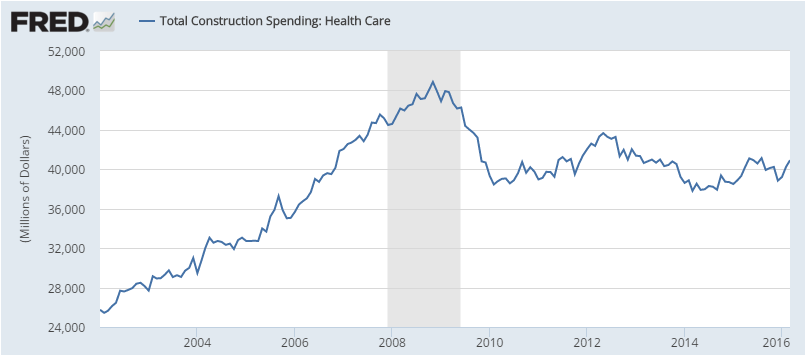
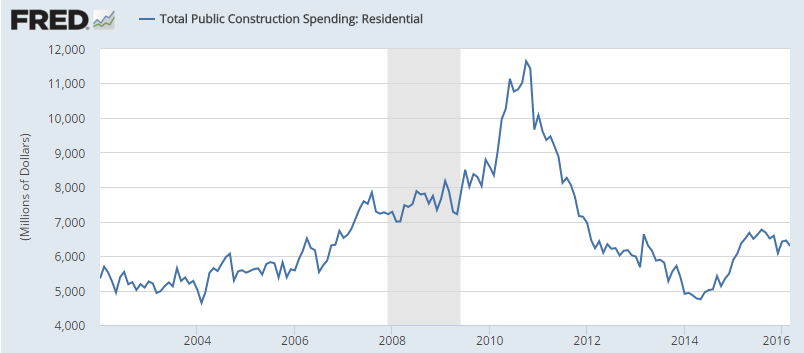
When it comes to downsizing govt, Obama looks to have been the best ever. What more could the Tea Party ask for?
er-5-2-16-3
er-5-2-16-4
er-5-2-16-5
er-5-2-16-6