New home sales, Chicago Fed survey, Lumber prices, US survey

Trump looks to be losing by a substantial margin at the moment, which means
to me that there won’t be a fiscal adjustment before January’s new Congress,
and without a sufficient majority in the Senate all initiatives may be blocked indefinitely.


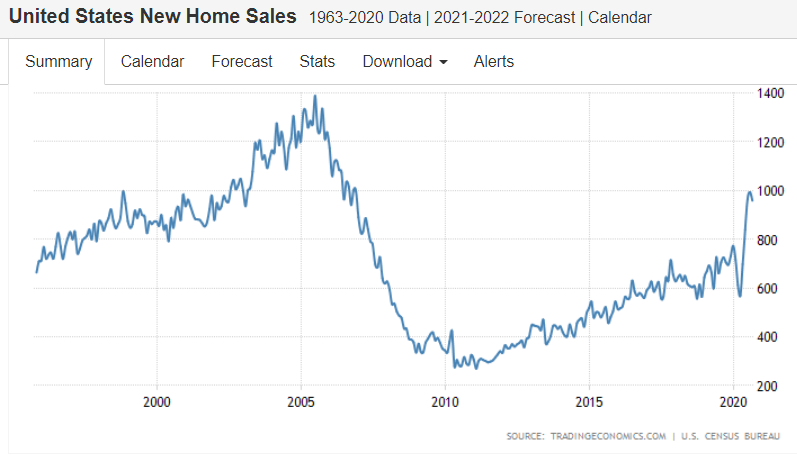
Most likely new home sales at best return to their pre covid growth path:


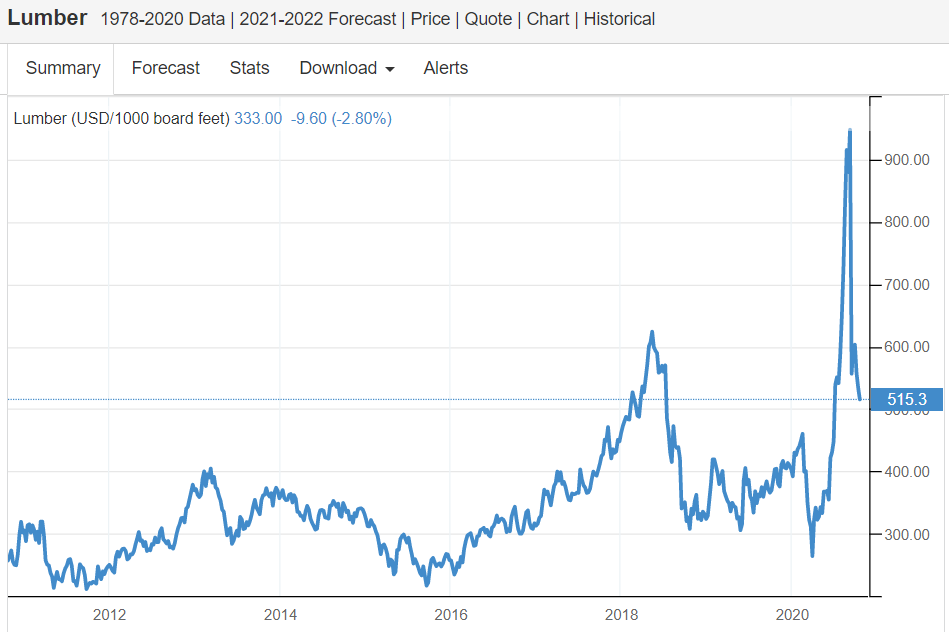
Trump was upset with Canada because they weren’t charging us enough for lumber:

Lumber prices across North America have nearly tripled since 2019. Based on a weekly price report by the B.C. Ministry of Forests, Lands and Natural Resources, the price of SPF (spruce, pine, fir) 2×4 lumber – as of Sept. 18 – is at $1,288 per thousand board feet, up from a 2019 average annual of $499.

Income, Consumption Chicago PMI, Trade, GDP forecasts, France, Canada, India

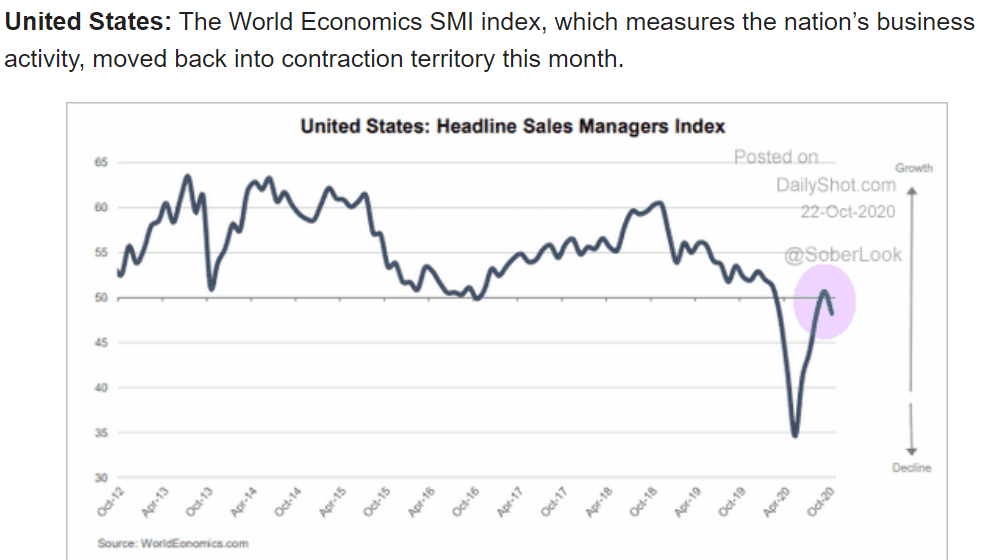
Continues to decelerate from the tariffs, and this is before the virus:

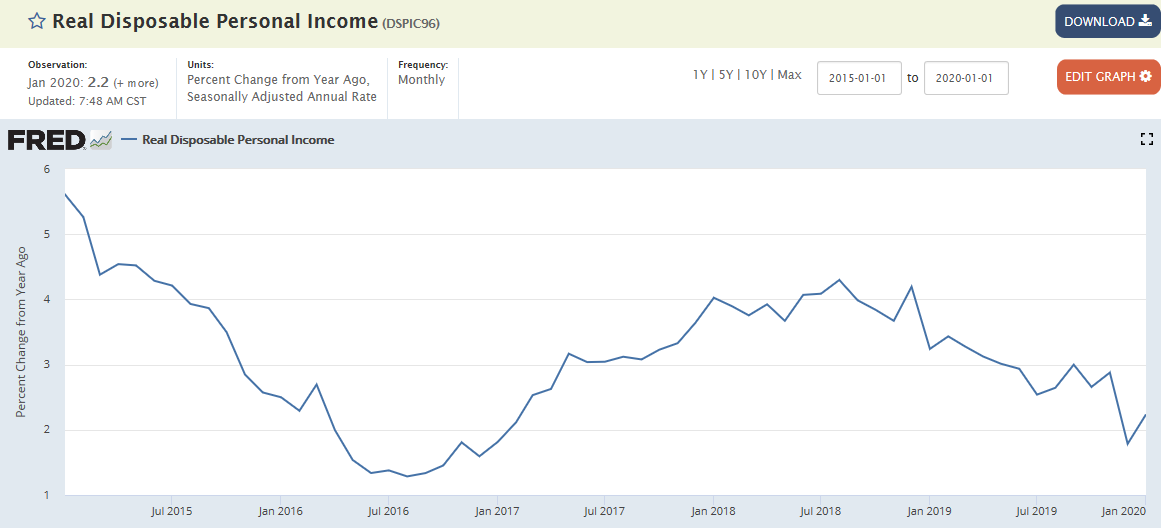
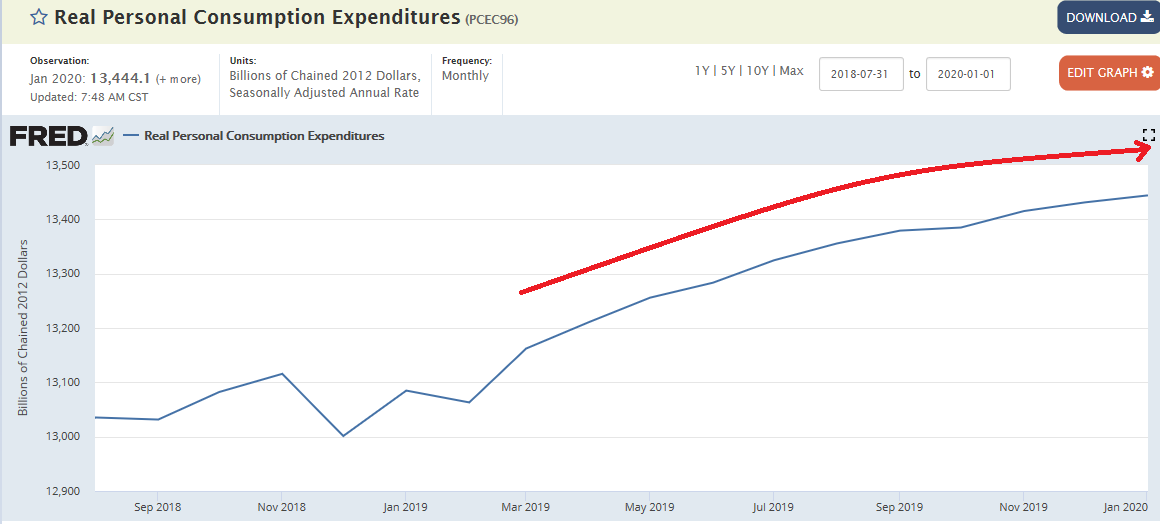
Also decelerating before the virus:

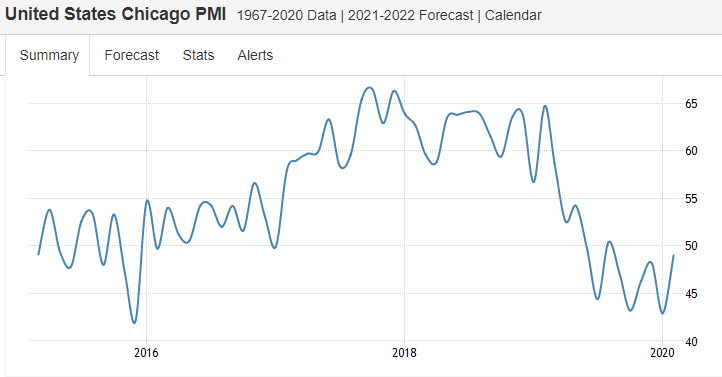
Before the virus, the downtrend is obvious as it remains below 50:

Exports and imports both slowing as global trade continues to wind down:


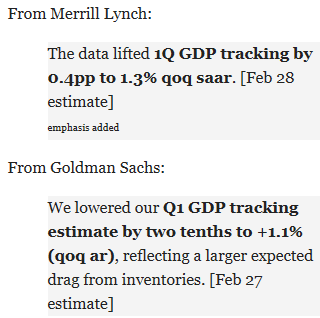
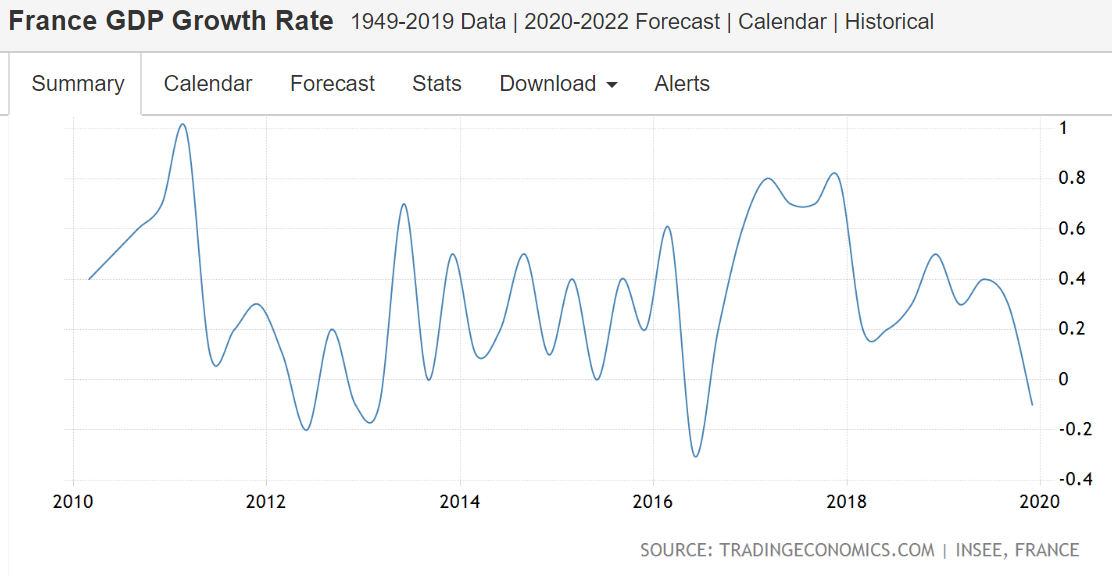
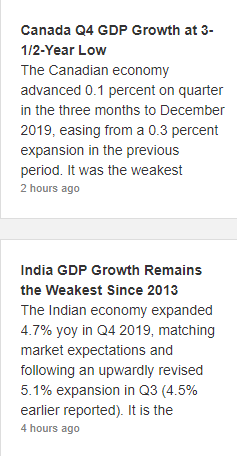
GDP forecast to decelerate, before the virus:


Unsold inventory piling up:


Gone negative well before the virus:

ISM, Canada

US service sector continues its rapid deceleration:

Seems about the same everywhere- imports and exports both down:

Canada’s trade surplus decreased to CAD 0.14 billion in June 2019 from a downwardly revised CAD 0.56 billion in the previous month and against market expectations of a CAD 0.3 billion gap. It was the third trade surplus since December 2016, as exports were down 5.1 percent, while imports fell at a softer 4.3 percent, both due in part to significant decreases in crude oil, as well as aircraft and other transportation equipment and parts. Balance of Trade in Canada averaged 1281.20 CAD Million from 1971 until 2019, reaching an all time high of 8524.80 CAD Million in January of 2001 and a record low of -4962 CAD Million in December of 2018.

Trade, Housing affordability, China, BOJ equity buying, Retail comment

Imports and exports both decelerating indicates a weaker global economy, and weak US retail sales indicates domestic consumer spending growth is slowing:

Highlights

First-quarter GDP looks to get a major boost from improvement in the nation’s trade deficit which, for February, came in at much lower-than-expected $49.4 billion. And the positives are more than just a technical calculation as exports, driven by aircraft, jumped 1.1 percent in the month on top of January’s 1.0 percent gain.

Exports of goods rose 1.5 percent to $139.5 billion as civilian aircraft rose $2.2 billion in the month. Outside of aircraft, however, gains are less striking with auto exports up $0.6 billion and with monetary gold and consumer goods showing marginal gains. For farmers, the results are slightly in the negative column with exports down $0.2 billion. But exports of services, at $70.1 billion in the month and usually a reliable plus, rose 0.3 percent.

Imports rose only 0.2 percent in the month, totaling $259.1 billion but with consumer goods showing yet another large increase of $1.6 billion in the month. Imports of industrial supplies fell $1.2 billion despite a 0.8 billion rise in the oil subcomponent. Imports for other categories were little changed.

Bilateral country deficits show a sharp decline with China, down $24.8 billion in unadjusted monthly data that are hard to gauge given strong calendar effects during the lunar new year. But year-to-date, the deficit with China is at $59.2 billion and down sizably from $65.2 billion in the comparison with the 2018 period. February’s deficit with both the European Union and Canada narrowed while deficits with Japan and especially Mexico, at $7.4 billion vs January’s $5.8 billion, deepened.

Today’s results are certain to lift first-quarter GDP estimates which had been roughly at the 2 percent line. The average deficit for the first two months of the quarter is $50.3 billion which is well under the $55.6 billion monthly average in the fourth quarter. And the easing deficit with China may well ease immediate tensions in U.S.-Chinese trade talks.


Interesting as debt service and financial burdens ratios remain historically low:


They’ve made fiscal adjustments that may be kicking in:

Bank of Japan to be top shareholder of Japan stocks

Bank of Japan to be top shareholder of Japan stocks (Nikkei) The BOJ held over 28 trillion yen ($250 billion) in exchange-traded funds as of the end of March — 4.7% of the total market capitalization of the first section of the Tokyo Stock Exchange. Assuming that the bank maintains its current target of 6 trillion yen in new purchases a year, its holdings would expand to about 40 trillion yen by the end of November 2020. This would place it above the GPIF’s TSE first-section holdings of more than 6%. The BOJ has likely also become the top shareholder in 23 companies through its ETF holdings. It was among the top 10 for 49.7% of all Tokyo-listed enterprises at the end of March.

This could explain why same store sales have been growing by about 5% year over year:

CNN: American retailers already announced 6,000 store closures this year. That’s more than all of last year.

Trade, Factory orders, Vehicle sales, UK service sector, German PMI

Deficit growing despite tariffs. Could be J curve effect:

Highlights

A slight 0.1 percent decline in exports and a slight 0.2 percent gain in imports made for a sizable 1.7 percent deepening in the nation’s trade deficit in October to $55.5 billion which is just outside Econoday’s consensus range.

The deficit with China was very deep, at $43.1 billion in October vs $40.2 billion in September for a year-to-date deficit of $420.8 billion that is 23 percent deeper than this time last year. This is important data for ongoing trade talks between the U.S. and China.

October’s deficit with the EU, at $17 billion, also deepened as did the deficit with Japan at $6.2 billion. The deficit with Mexico, at $7.2 billion, eased slightly while the deficit with Canada, at $1.9 billion, widened slightly. Note that country balances, unlike other data in this report, are not adjusted for calendar or seasonal effects.

Exports, in possible tariff effects, show another sizable drop in foods, feeds & beverages, to $10.3 billion vs September’s $11.0 billion. Exports of civilian aircraft were also weak, at $4.9 billion vs September’s $5.2 billion. Services exports, an area of strength for the U.S., edged higher in the month to $69.6 billion.

Foods, feeds & beverages on the import side rose slightly to $12.3 billion with imports of consumer goods, which are a special sore spot in the U.S. trade picture, rising $2.0 billion to $57.4 billion. Imports of services rose modestly to $47.0 billion.

October’s $55.5 billion headline deficit compares with a monthly average in the third-quarter of $52.8 billion and unfortunately marks a very weak opening for fourth-quarter net exports.

Tariffs taking their toll:

Highlights

Held down by downturns in the defense goods and also civilian aircraft, factory orders sank 2.1 percent in October. The split between the report’s two main components shows a modest 0.3 percent increase for nondurable goods — the new data in today’s report where the gain is tied to printing and petroleum — and a 4.3 percent drop for durable orders vs 4.4 percent in last week’s advance report for this component.

Orders for defense goods have fallen 16.4 and 16.2 percent the last two reports but follow a giant 48.8 percent surge in August that was tied to aircraft. Orders for civilian aircraft in October and September have fallen 22.2 and 19.1 percent but here too follows an outsized gain in August, of 63.7 percent.

Core capital goods (nondefense ex-aircraft) are mostly weak in today’s report, with orders unchanged following declines of 0.6 and 0.2 percent in the prior two months. But core shipments, which are direct inputs into fourth-quarter GDP, did rise 0.3 percent for a respectable opening to fourth-quarter business investment.

Areas of strength in October include sharp order gains for fabrications, computers & electronics, and also electrical equipment. Other readings include a marginal 0.1 percent rise in factory inventories which will offset very strong October builds for retailers and wholesalers and will limit October’s contribution to GDP inventory. Both total shipments and also total unfilled orders posted soft 0.1 percent declines.

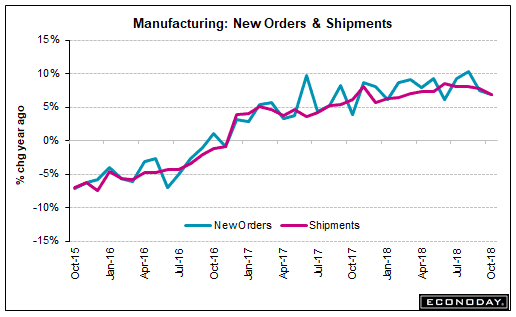
Monthly swings in aircraft can badly cloud results this report which focuses attention on the smoother reading of year-on-year change. This remains solidly positive at a 6.9 percent gain for total orders which, however, is down from 7.5 percent in September and a 4-year high of 10.3 percent in August. But a little slowing at year-end won’t dim manufacturing’s central contribution to the strength of the 2018 economy.


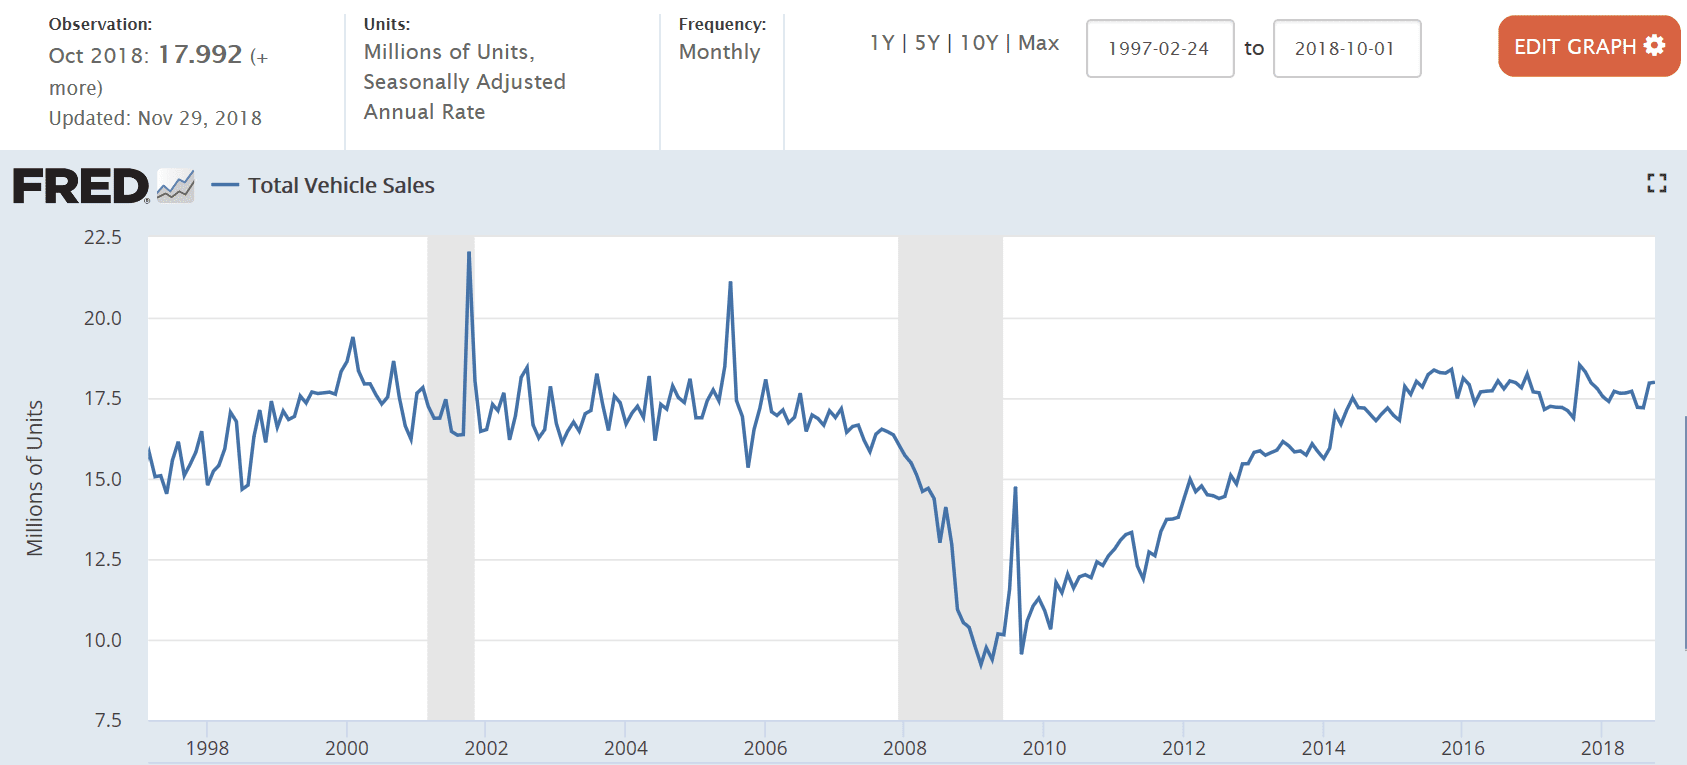
Still flat to down, much like housing:

Highlights

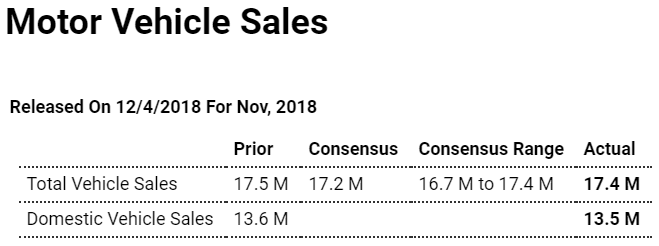
Unit vehicle sales in November came in on the high end of expectations but, at a 17.4 million annualized rate, still fell just short of October’s 17.5 million rate. The results do not point to a back-to-back monthly gain for motor vehicles which make up about 1/5 of total retail sales and which in October ended two months of declines. Yet November did come in at a very healthy rate with strength concentrated in light trucks which typically have high sticker prices and which help dollar totals of the retail sales report.

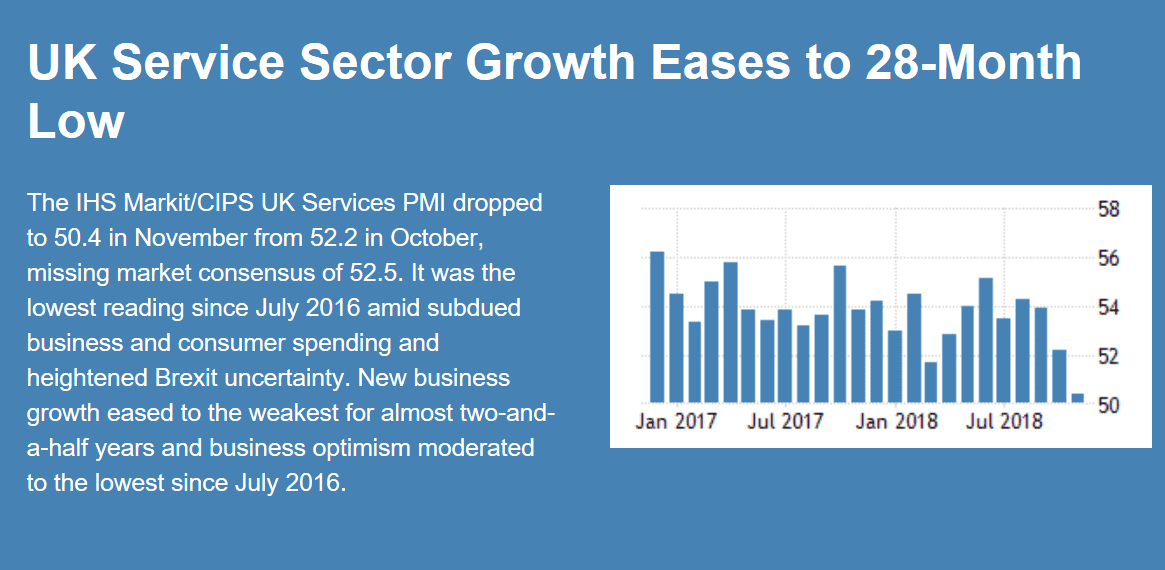
The IHS Markit Germany Composite PMI stood at 52.3 in November 2018, compared to a preliminary reading of 52.2 and October’s final 53.4. The latest reading pointed to the weakest pace of expansion in the private sector in nearly four years amid slower growth in service sector and a slight rise in manufacturing output that was the weakest for over five-and-a-half years. New orders rose the least since the start of 2015, with export orders falling for the third straight month, and job creation slowed. On the price front, output charge inflation eased to an 11-month low. Looking ahead, business confidence towards the outlook remained close to the lowest in almost four years. Composite Pmi in Germany is reported by Markit Economics.

Construction spending, Trade

Highlights

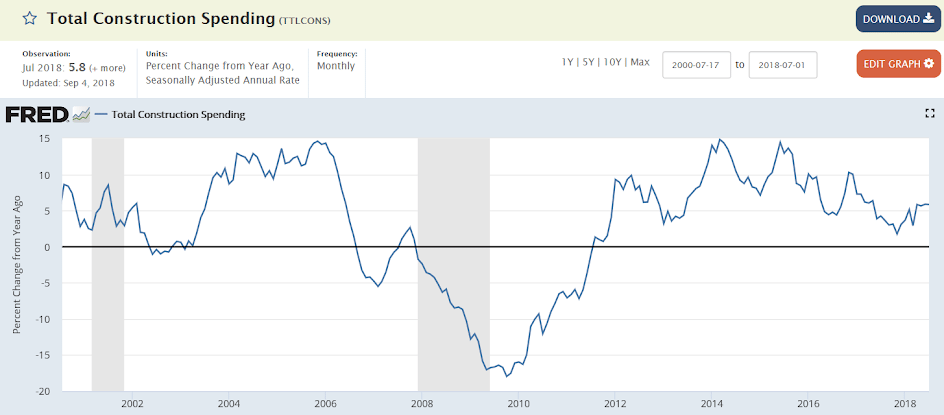
A solid rise in residential spending offset a mixed showing for non-housing components and made for a 0.1 percent July rise in overall construction spending to barely come within Econoday’s consensus range. Residential spending rose 0.6 percent but July’s gain was entirely centered in home improvements which jumped 2.1 percent to offset outright declines of 0.3 percent in single-family homes and 0.4 percent for multi-families.

Private non-residential spending fell 1.0 percent in the month, pulled down by a sharp fall in commercial projects, where spending has been uneven in recent months, that offset a fourth straight sharp gain in transportation. Public spending on educational building and highways & streets posted gains following declines in June.

Year-on-year rates help underline what is a healthy rate of growth in construction spending, up 5.8 percent overall with residential spending up 6.7 percent and both private nonresidential and public categories showing low to mid single digit gains. Nevertheless, reports out of housing have been uneven and are clouded further by the declines in single- and multi-family homes in this report.

Highlights

The nation’s trade deficit deepened sharply in July, to $50.1 billion vs a revised $45.7 billion in June. The deficit in goods jumped to $73.1 billion from $68.9 billion in June while the surplus in services slipped slightly to $23.1 billion.

Exports of capital goods fell $1.0 billion to $46.3 billion with civilian aircraft down $1.6 billion to $3.5 billion in the month. Exports of foods & feeds fell $0.9 billion to $13.2 billion with exports of consumer goods down $0.4 billion to $16.0 billion.

The import side shows a $0.8 billion decline in consumer goods to $52.6 billion with other components, however, on the rise including capital goods up $0.7 billion to $58.2 billion and autos up $0.5 billion to $30.7 billion.

The bilateral deficit with China deepened to $36.8 billion in unadjusted country data with the EU at a deficit of $17.6 billion. The deficit with both Japan and Mexico came in at $5.5 billion in July and Canada at $3.2 billion.

July’s deficit is much deeper than the $45.6 billion monthly average for the second quarter and points to a major uphill battle for net exports in the third-quarter GDP report.

Also, as you may know, I’ve been busy running for Governor of the USVI.

To see what that’s all about visit mosler4governor.com

And if you want to make a contribution click here:

warren4governor.com/donate

Many thanks!

warren

Trade, Employment, ISM, Japan swf

Larger than expected which also means q2 GDP will be revised down some:

Highlights

The nation’s trade deficit proved a little deeper than expected in June,, at $46.3 billion vs Econoday’s consensus for $45.6 billion.

After a run of strength going back to February, exports posted a 0.7 percent decline to $213.8 billion in the month with a rise in service exports offset by a drop in goods exports where capital goods, vehicles and especially consumer goods posted declines.

Imports, in special focus of course given the tariff situation, rose 0.6 percent to a monthly $260.2 billion with consumer goods, the sore spot in the nation’s deficit, rising a sharp $2.0 billion to $53.4 billion. Oil imports were also up, rising $1.2 billion to $14.1 billion.

Country data show a deepening deficit with China, at $33.5 billion in June with the year-to-date deficit 8.6 percent wider at $185.7 billion. Other year-to-date deficits include an 11 percent deepening with Europe at $77.6 billion, a 5.5 percent deepening with Mexico at $38.0 billion, and a 23.4 percent improvement with Canada at $8.1 billion.

Though deeper than expected in June, the nation’s trade deficit has been improving though the outlook, given tit for tats on tariffs, is uncertain.


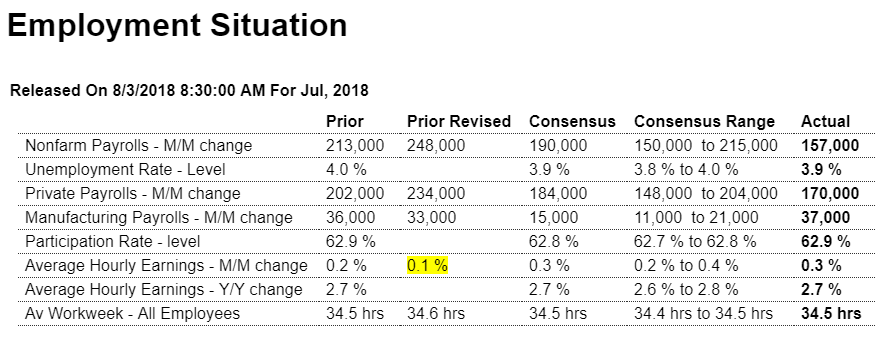
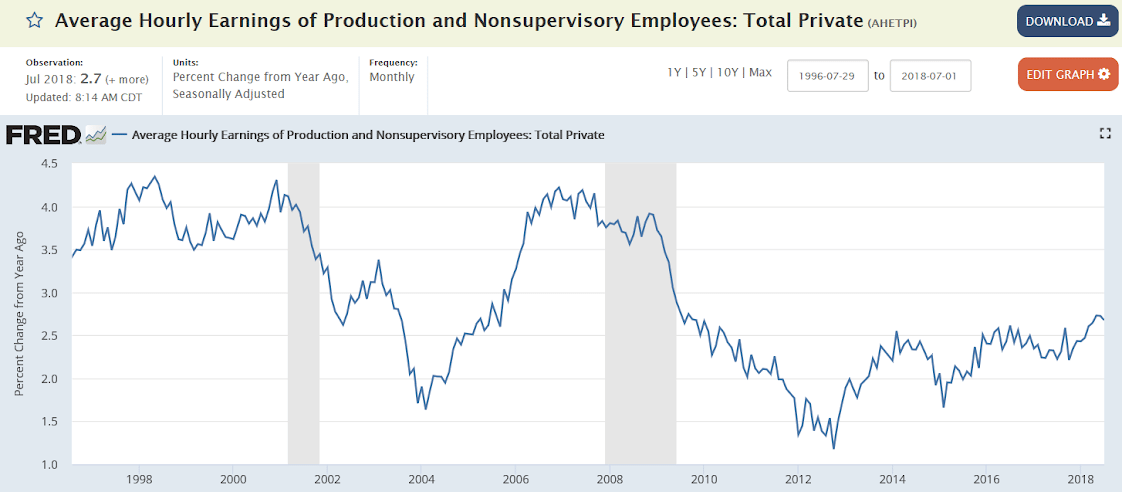
Chugging along as low participation rates and low wage growth tell me there’s still a lot of excess capacity:

Highlights

Slowing job growth may be a welcome outcome given the risk that economic activity may be pressing up against capacity limits. A 157,000 rise in nonfarm payrolls for July is at the low end of Econoday’s consensus range but is still healthy growth that is strong enough to absorb new entrants into the labor market. And revisions to prior months are favorable, a net 59,000 gain with June revised up to 248,000 and May higher at 268,000 in what were two very strong months for job growth.

The slowing in July is also favorable for the inflation outlook as average hourly earnings showed a little heat, up 0.3 percent which was expected but still firm. The year-on-year rate, at an as-expected 2.7 percent, has been steady which is a relief to Federal Reserve policy makers who are focused on keeping inflation stable at current rates.

The payroll breakdown is led by temporary help services which rose 28,000 in a very strong gain that indicates employers, stacked up with orders and backlogs, are scrambling to meet demand. Construction payrolls also standout with a strong 19,000 gain in the latest indication of strength in this sector. Manufacturing payrolls rose 37,000 to more than double Econoday’s consensus with trade & transportation, reflecting strong activity in the supply chain, up 15,000. Weakness in payrolls comes from mining, down 4,000 after a long series of gains, and also government payrolls which fell 13,000 to nearly reverse the prior month’s 14,000 jump.

The unemployment rate fell 1 tenth in July to 3.9 percent with the number of unemployed actively looking for a job down 284,000 to 6.280 million. The pool of available workers, which includes those wanting a job but aren’t looking, fell 379,000 to 11.443 million which hints at capacity limits in the labor force, again underscoring the risk of wage inflation. The participation rate holds at 62.9 percent.

Though the headline is softer than expected, this is yet another positive employment report that speaks to the strength of the labor market and the success, so far, of Federal Reserve policy.

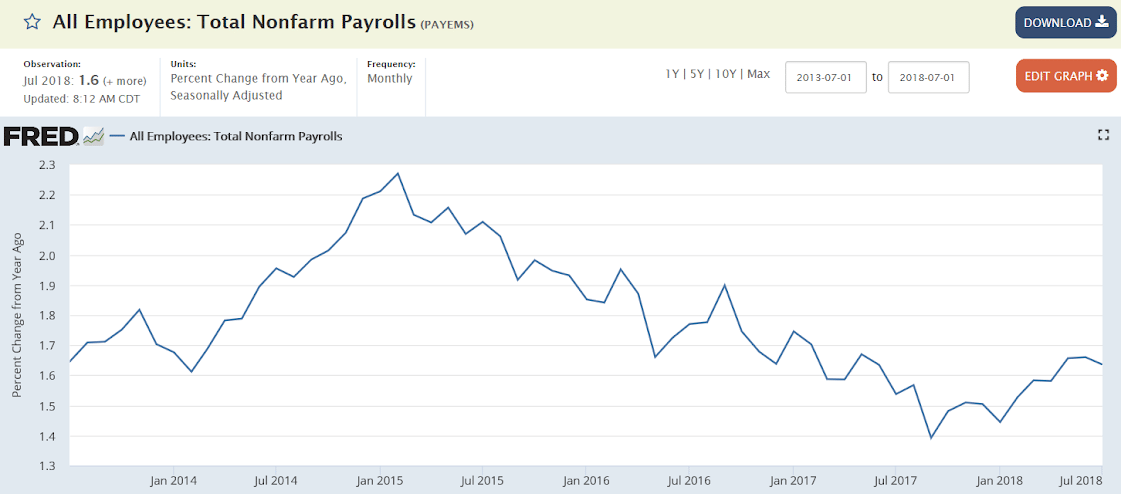
Analysts have been crying wolf on ‘wage inflation’ for several years now:


The deceleration had seemingly reversed a year ago, but in any case employment growth is modest at best:


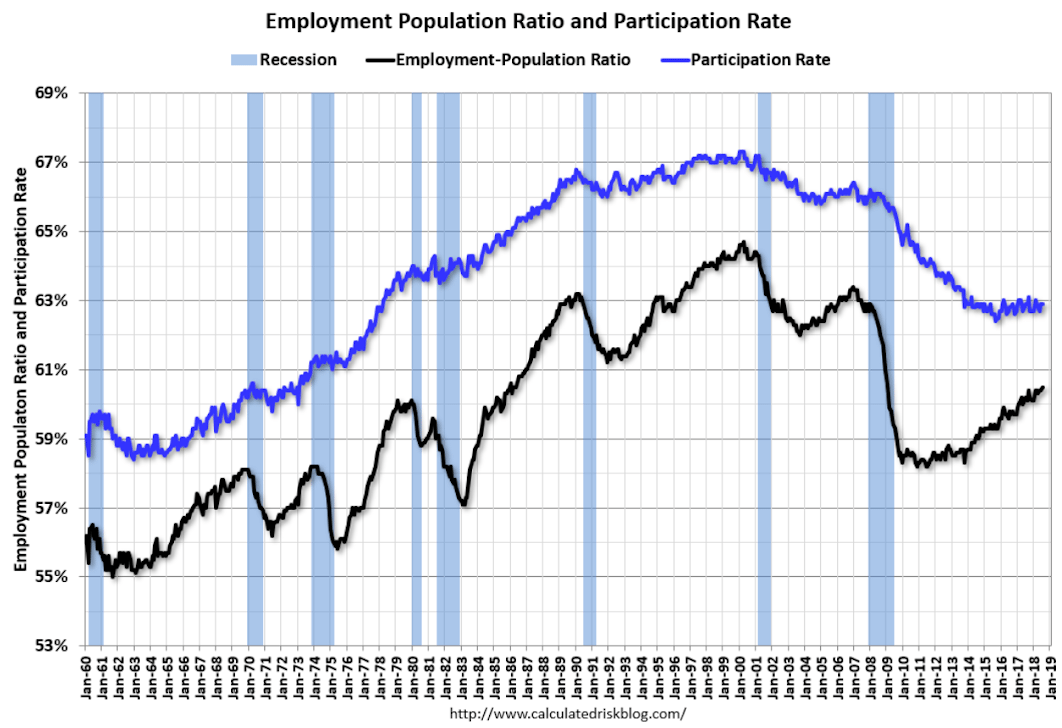
Hasn’t been much of a recovery:

Fyi,

I don’t see the public purpose behind this at all, of course:

Japan plans sovereign wealth fund to finance US infrastructure

(Nikkei) The Japanese government intends to create a sovereign wealth fund to invest in American infrastructure projects. The state-backed fund will support infrastructure construction along with resource development and storage, as well as invest in joint U.S.-Japanese projects in other countries. It could work with a $113 million Indo-Pacific investment initiative announced this week by U.S. Secretary of State Mike Pompeo. Japan is expected to offer the fund as a concrete example of economic cooperation with the U.S. at the “free, fair and reciprocal” trade talks that the two sides will launch on Aug. 9.

Trade, Consumer credit

The trade deficit narrowed but due to a drop in consumer spending on imported cell phones, which doesn’t bode well for retail sales, which are under pressure from the reduced growth of real disposable personal income. And the widening trade gap with the euro area is fundamentally euro friendly even as fears of Italian politics are frightening portfolio managers:

Highlights

Helped by a dip in cellphone imports, the nation’s trade gap narrowed sharply in April to a much lower-than-expected $46.2 billion. Cellphone imports fell $2.2 billion to pull down the consumer-goods deficit which narrowed by $2.8 billion in the month.

Despite the improvement for consumer goods, the bilateral gap with China rose a noticeable $2.1 billion to an unadjusted $28.0 billion in results that probably won’t ease ongoing trade friction. Note that country data, unlike other data in this report, are traditionally tracked in unadjusted terms due to small monthly totals yet adjusted data for China are available and tell a different story with the gap at a higher level of $30.8 billion but down in month-to-month terms from an adjusted $34.2 billion in March.

Turning back to unadjusted country data, the gap with Europe also deepened, by $2.5 billion in April to $14.6 billion with the Japanese gap little changed at $6.3 billion. Turning to North America, the gap with Mexico narrowed by $2.4 billion to a deficit of $5.7 billion while a small March surplus with Canada turned into a $785 million deficit in April.

Imports of iron and steel mill products rose $228 million to $2.1 billion with imports of bauxite and aluminum up slightly to $1.5 billion. It will be interesting to watch whether these totals, due to U.S. tariffs on steel and aluminum, begin to slide in the month’s ahead.

Overall, exports rose 0.3 percent in the month to $221.2 billion with goods, led by a gain for industrial supplies and also food, up 0.2 percent at $141.3 billion and despite a 0.1 percent slip in service exports which totaled $70 billion. Imports fell 0.2 percent with goods, again reflecting the weakness in cellphones, down 0.3 percent to $209.5 billion and services up 0.6 percent to $47.9 billion.

April’s deficit is more than $1 billion narrower than March and far under the $53.1 billion monthly average of the first quarter. This points to a big net-export lift for second-quarter GDP.

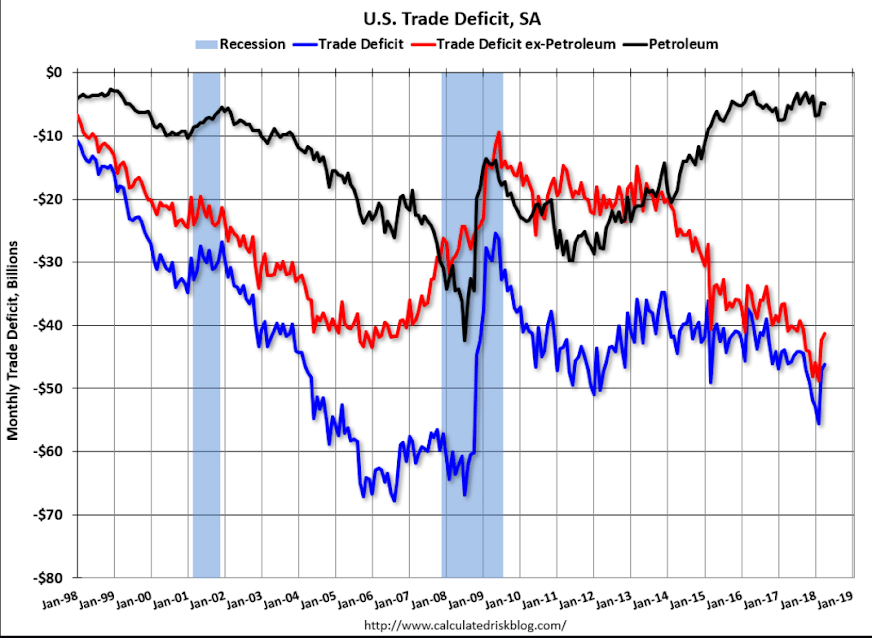
The petroleum deficit appears to have leveled off, while trade overall still looks to be trending further into deficit, recognizing the volatility around year end:


Deceleration continues:

Highlights

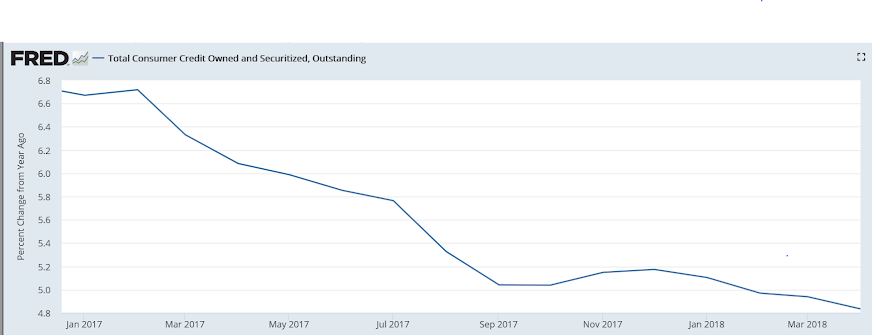
Consumer credit rose a lower-than-expected $9.3 billion in April though consumers did run up their credit-card debt slightly as revolving credit, which was in the negative column the last two reports, rose $2.3 billion in the month. Nonrevolving credit, which includes student loans and also vehicle financing and which often posts double-digit gains, rose only $7.0 billion in the month.

Light vehicle sales, Trump tariffs

Blaming interest rates for a decline that started about two years ago:

U.S. Car Sales Fall as Credit Terms, Higher Payments Squeeze Buyers (WSJ)

Overall U.S. vehicle sales dropped 2.4% in February, to 1.3 million, according to Autodata Corp. J.D. Power estimates incentive spending in February—averaging $3,850 per vehicle—was down slightly from the same month in 2017. The seasonally adjusted sales pace for the market slipped to 17.1 million on an annualized basis, from 17.5 million a year earlier, according to Autodata. Average monthly payments now exceed $525 a month, according to Edmunds.com, with the online-shopping company estimating that interest rates on new-vehicle loans hit an eight-year high in February.

What best serves public purpose when this is a concern is to require defense needs be sourced domestically while the rest of the economy continues unrestricted:

“The premise for the decision, known as Section 232, was on national security grounds. The White House claimed that relying on foreign steel could threaten the U.S. defense industry.”

I wrote this a year or so ago and just modified to keep it current:

Shop to Win!

The President no doubt knows that when you go shopping, buying at the lowest price is the mark of a winner, while paying too much is the mark of a loser. Yet when it comes to buying lumber from Canada, cars from Germany, and now steel and aluminum, the President has viciously attacked and is now retaliating against other nations for not charging us enough for their products!

And while everyone knows that buying at the lowest price is a good thing, there is no serious push back from Democrats, the ‘free trade’ Republicans, the media or any of the headline mainstream analysts. There is clearly something very wrong with their underlying mainstream logic that leads to this type of costly Presidential blunder.

Yes, when we buy imports jobs are lost, just as when we replace workers with machines, including lawn mowers, vacuum cleaners, and power washers, jobs are lost. And yet somehow we’ve survived all that. We went from needing 99% of the people working to grow our food to less than 1%, and manufacturing jobs are down to only 7% of the labor force. And yet the remaining 90% of us are not all unemployed, as jobs have proliferated in the service sector, where most of those jobs are now considered to be better jobs than the lost agricultural and manufacturing jobs. Nor has a trade deficit necessarily resulted in higher unemployment or lower pay. In 1999, for example, we had record imports with unemployment under 4% and inflation under 2%, and students were getting recruited for good paying jobs well before graduation.

The answer to sustaining high levels of employment and pay is fiscal policy. If for any reason, including more imports, weak demand at home is keeping unemployment too high or wages too low, the appropriate policy response is fiscal relaxation- either a tax cut or spending increase, even if that increases the public debt- and not to tax or otherwise drive up the cost of imports. Unfortunately however, the policy that allows all of us to pay the lowest prices for imports and have good paying jobs to replace those lost because of imports has been taken entirely off the table by both Republicans and Democrats. Consequently a very good thing for America- lower prices of imports- has been turned into a very bad thing- unemployment, and all because of the fake news about the public debt that is supported by Republicans and Democrats.

The US public debt is nothing more than the dollars spent by the federal government that have not yet been used to pay taxes. Those dollars spent and not yet taxed sit in bank accounts at the Federal Reserve Bank that are called ‘reserve accounts’ and ‘securities accounts’, along with the actual cash in circulation. Treasury securities (bonds, notes, and bills) are nothing more than dollars in securities accounts at the Federal Reserve Bank, functionally the same as dollars in savings accounts or CD’s at commercial banks.

Think of it this way- when the government spends a dollar, that dollar either is used to pay taxes and is lost to the economy, or it’s not used to pay taxes and remains in the economy. Deficit spending adds to those dollars that were spent but not yet taxed, which is called the public debt. And what’s called ‘paying off the debt’ (as happens to 10’s of billions of Treasury securities every month) is just a matter of the Fed shifting dollars from securities accounts to reserve accounts- a simple debit and a credit- all on its own books. (No tax payers or grand children required…) The ‘ability to pay’ is always there- it’s just a debit and a credit to accounts on the books of the Federal Reserve Bank. The fear mongering about the US running out of money or constraints by foreigners is simply not applicable to today’s monetary system.

And if you are worried about inflation, our proposal works to lower prices for all of us, while the Presidents direct policy is to raise the prices we all pay.

And if the concern is national security, the policy response that best serves public interest is to order the defense department to require domestic sourcing of what they consider strategically important,
and let the rest of us continue to shop for the lowest possible prices.

Point is, once it’s understood that 1) the public debt is nothing more than what can be called the net money supply 2) there is no risk of default 3) there is no dependence on foreign or any other lenders 4)there is no burden being put on future generations the President will be free to make us all winners by being our shopper in chief who works to get us the lowest possible prices.

Mtg apps, Jolts, Trade

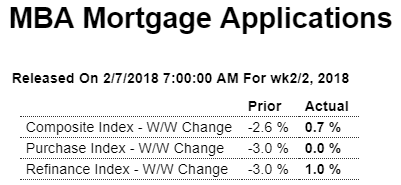
Still going nowhere:

Highlights

The volume of purchase applications for home mortgages remained unchanged on a seasonally adjusted basis in the February 2 week, while refinancing applications rose 1.0 percent from the previous week despite the headwind of rising interest rates. Unadjusted, purchase applications increased 7 percent from the previous week, though the year-on-year gain shed 2.0 percentage points to 8 percent. The refinancing share of mortgage activity fell 1.4 percentage points to 46.4 percent, the lowest level since July 2017. Mortgage rates continued to rise and accelerated their climb in the week, with the average interest rate on 30-year fixed rate conforming mortgages ($453,100 or less) up 9 basis points to 4.50 percent, the highest level since April 2014.
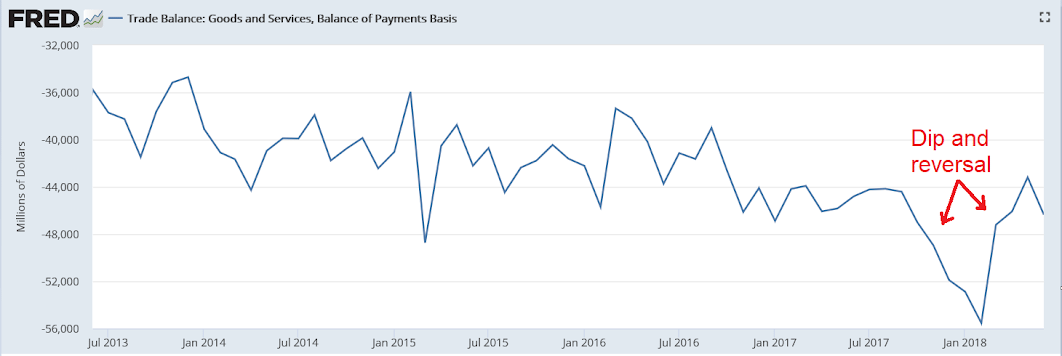
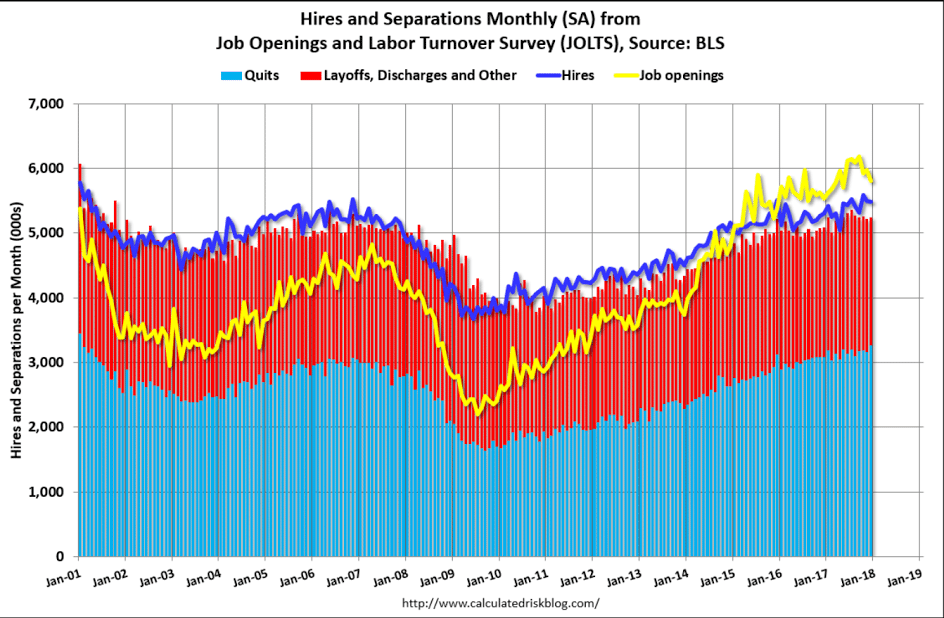
Worse than expected, but prior month revised higher, and still looking like a top to me:

Highlights

In bad news for fourth-quarter GDP revisions, the nation’s trade gap widened more sharply than expected in December, totaling $53.1 billion which just tops Econoday’s low estimate. Imports swelled by a steep 2.5 percent in the month to $256.5 billion which is a direct subtraction from GDP. The good news in the report is a solid 1.8 percent rise in exports to $203.4 billion which will add to GDP.

Imports of goods rose 2.9 percent to $210.8 billion with imports of services up 0.6 percent to $45.7 billion. Imports of consumer goods is the Achilles heel, at $55.5 billion for a 6.1 percent rise in the month.

Exports of goods, led by a strong rise in capital goods to $47.4 billion, rose 2.5 percent to $137.5 billion while growth in export of services remains slow, up only 0.2 percent to what is however a very positive $65.9 billion that does its share to hold down the total deficit.

Petroleum imports fell sharply to $15.8 billion as a decline in volume more than offset a rise in price. Exports of petroleum continue to catch up, at $12.5 billion for what is a modest petroleum deficit of $3.3 billion.

Country totals are in for full-year 2017 goods deficits and they are sizable: China up 8.1 percent on the year at $375.2 billion; EU up 3.2 percent at $151.4 billion; Mexico up 12.2 percent at $71.1 billion; Japan up fractionally at $68.9 billion; and Canada up the most by far in percentage terms, 63 percent higher to $17.6 billion.

Demand for foreign goods is bad for GDP but it does point to a very strong national appetite. Exports are on the rise which reflects the strength of global demand and also the decline in the dollar which, on the varying measures, fell about 10 percent during last year. For GDP which came in at an initial 2.6 percent annualized rate in the fourth quarter and was held down heavily by net exports, today’s data look to be an even bigger negative for the second estimate later this month.