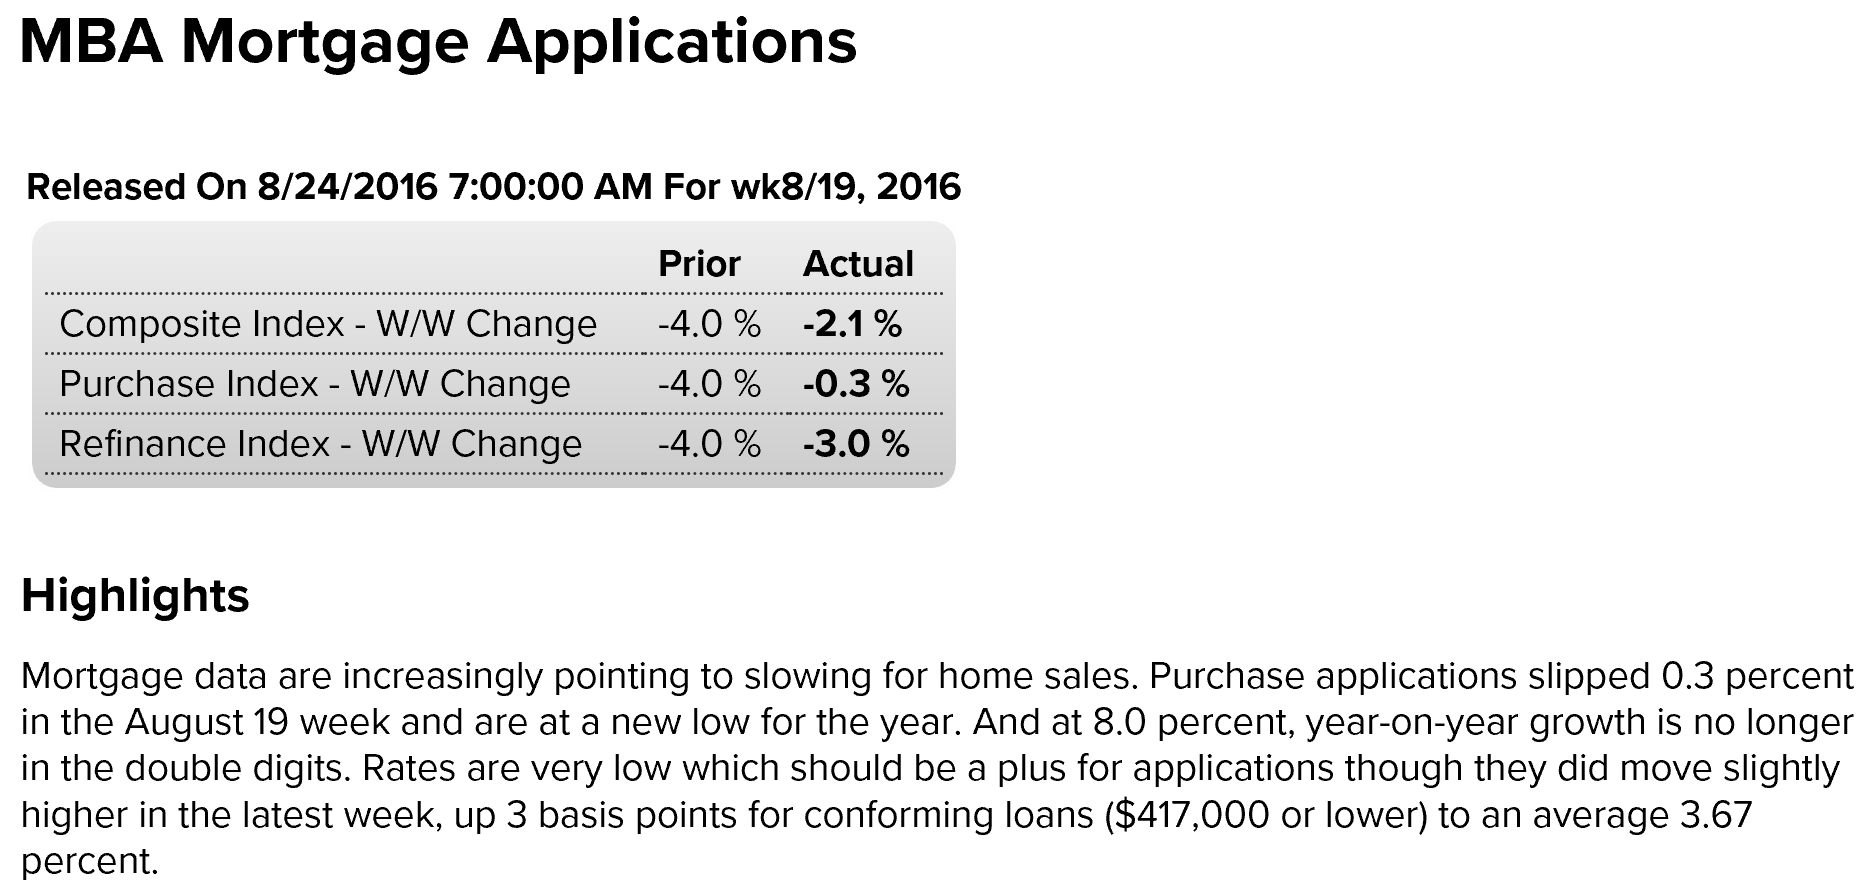
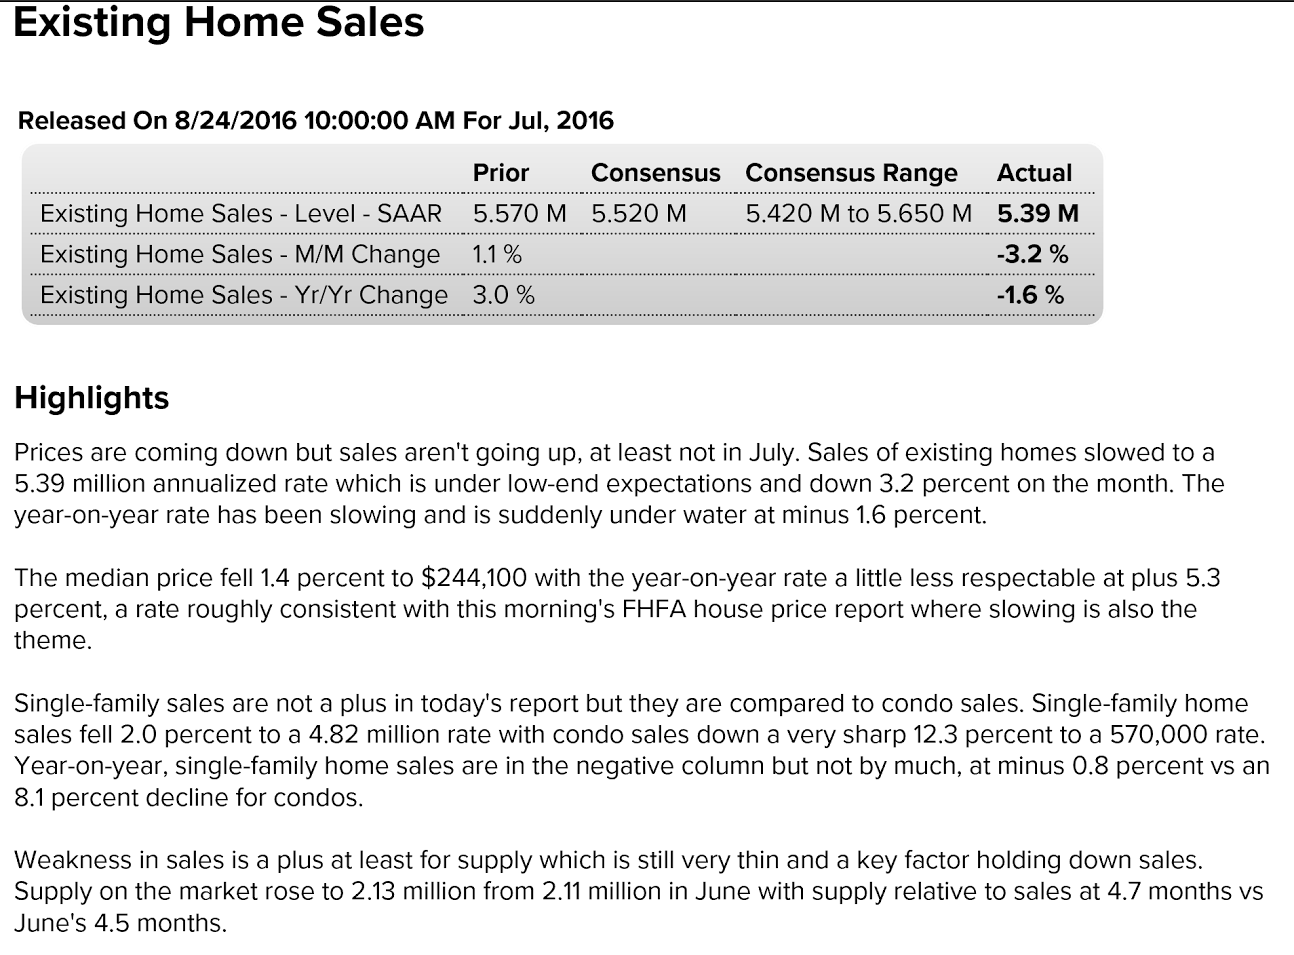
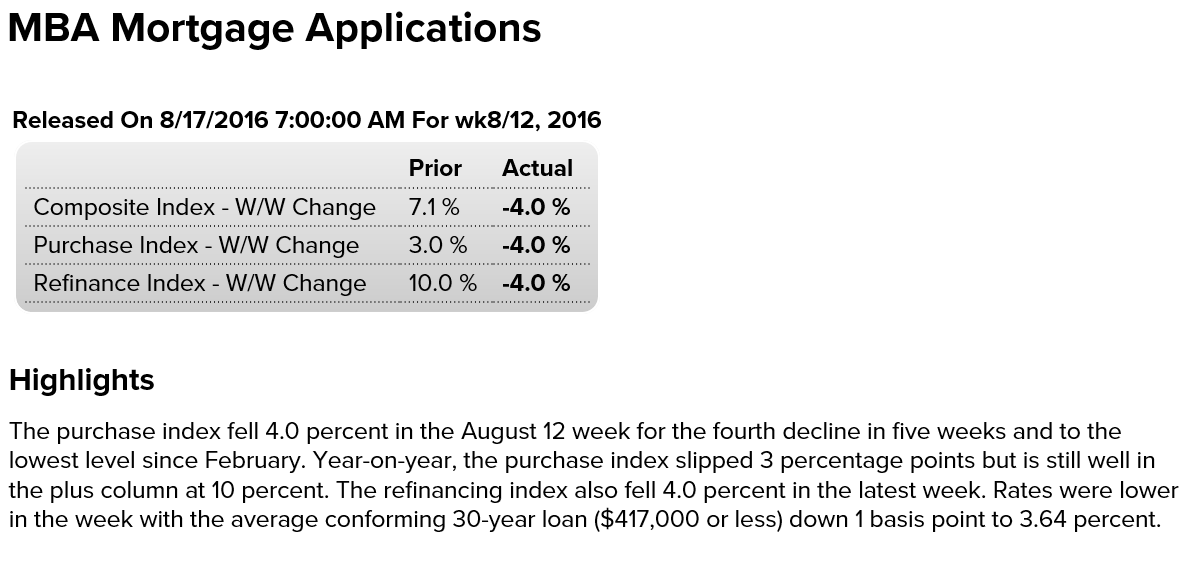
Bad news for housing today- mtg purchase apps at the lows of the year, prices moderate, and existing home sales weak, so, as previously discussed, not looking like housing will be contributing to growth this year:

Bad news for housing today- mtg purchase apps at the lows of the year, prices moderate, and existing home sales weak, so, as previously discussed, not looking like housing will be contributing to growth this year:
The beatings will continue until morale improves…
The Collapse of Rome: Washington’s $6.5 trillion Black Hole
The Defense Finance and Accounting Service, the agency that provides finance and accounting services for the Pentagon’s civilian and military members, has just revealed that it cannot provide adequate documentation for $6.5 trillion worth of “adjustments” to Army general fund transactions and data. According to a report released July 26 by the by the Inspector General of the US Department of Defense, US military budget practices are out of control. The report notes,
“The Office of the Assistant Secretary of the Army (Financial Management & Comptroller) (OASA[FM&C]) and the Defense Finance and Accounting Service Indianapolis (DFAS Indianapolis) did not adequately support $2.8 trillion in third quarter journal voucher (JV) adjustments and $6.5 trillion in year-end JV adjustments made to AGF data during FY 2015 financial statement compilation. The unsupported JV adjustments occurred because OASA (FM&C) and DFAS Indianapolis did not prioritize correcting the system deficiencies that caused errors resulting in JV adjustments, and did not provide sufficient guidance for supporting system-generatedadjustments.” (emphasis added)
(So maybe the ECB should float the idea of replacing Mario Draghi with one of the Governors of the Reserve Bank of Zimbabwe to show they are serious about meeting their inflation target?)
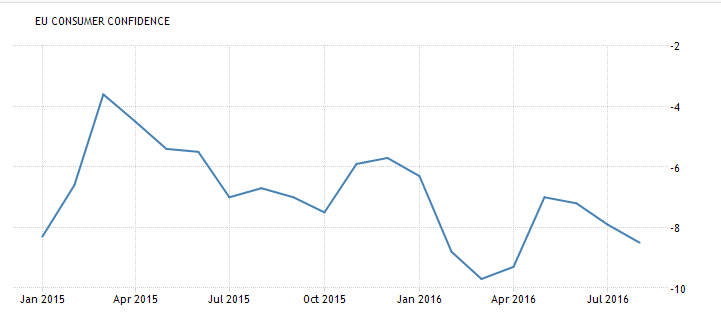
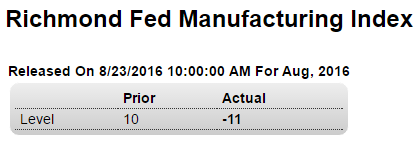
Still extremely depressed:
Down and well below expectations:
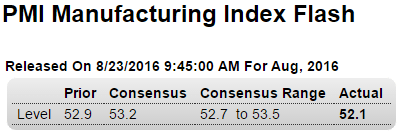
Highlights
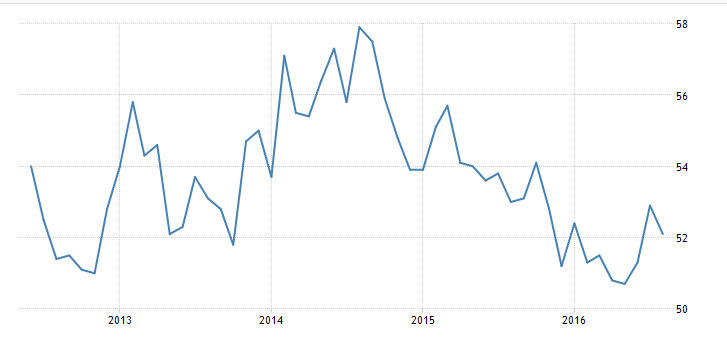
Weakness in orders and employment were unfortunate themes of last week’s Empire State and Philly Fed reports and likewise headline the manufacturing PMI report. The PMI, which is based on a nationwide sample of manufacturers, slowed by 8 tenths in the August flash to 52.1, a reading only modestly above breakeven 50 to indicate no more than limited expansion in composite activity.Output is the month’s best strength but one that won’t last very long if orders remain soft. The sample is cutting back on inventories this month which, like the slowing in employment, hints at caution over the business outlook. Price trends are stagnant in yet another sign of softness in demand. One positive in the report is strength in export orders which, after a long run of weak readings, is suddenly near a 2-year high.
Exports aside, the strength in this report is limited and does not point to second-half strength for manufacturing.
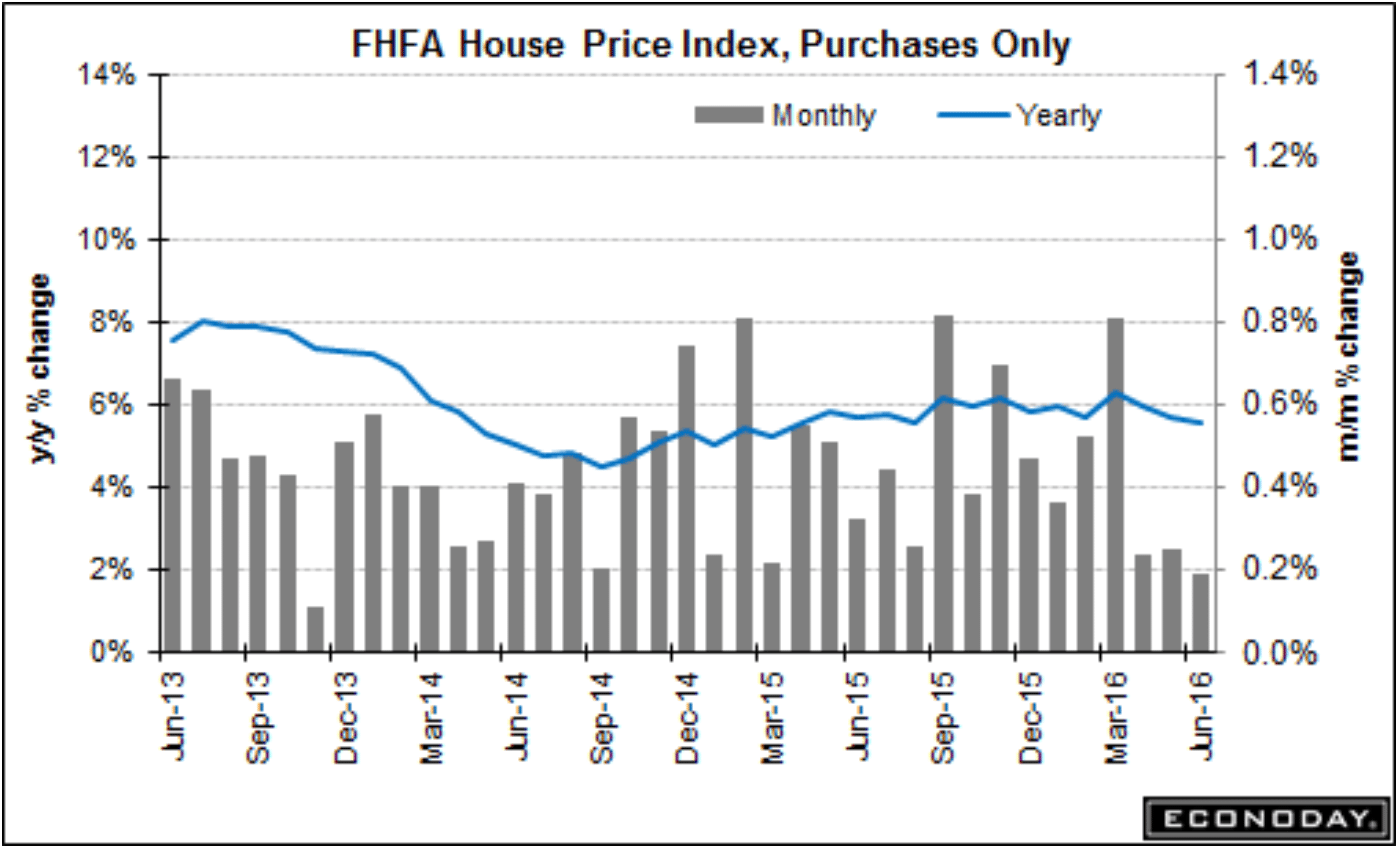
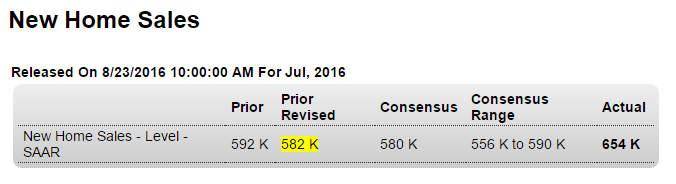
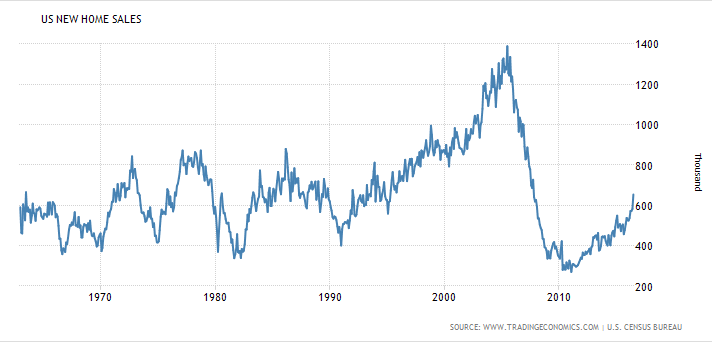
Bad:
Strong sales, higher than expected, but in any case no homes get built or sold without permits which remain weak, so expect ‘corrections’ with future releases:
Stephanie Kelton #1, Pavlina Tcherneva #4!
http://theweek.com/articles/643874/hillary-clintons-economic-dream-team
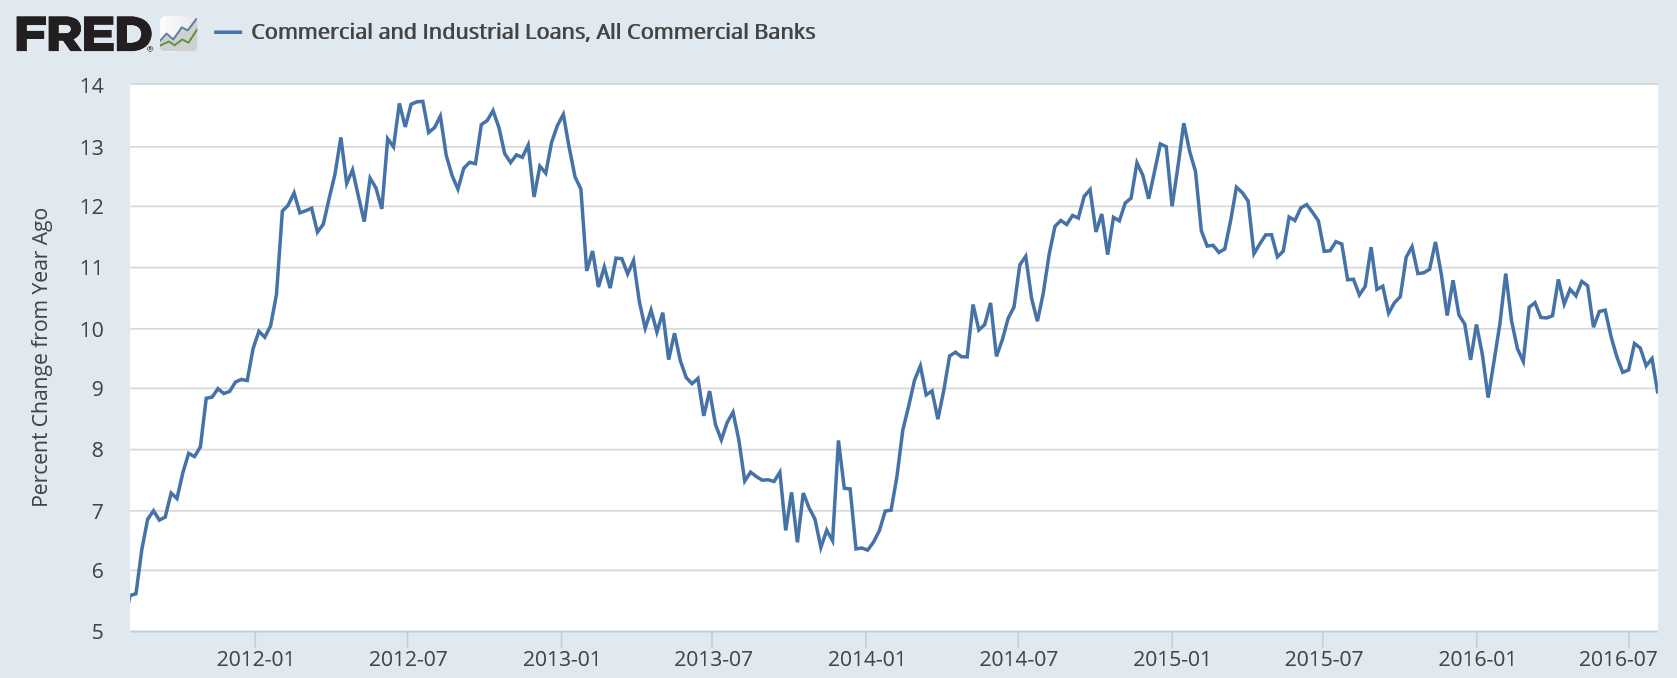
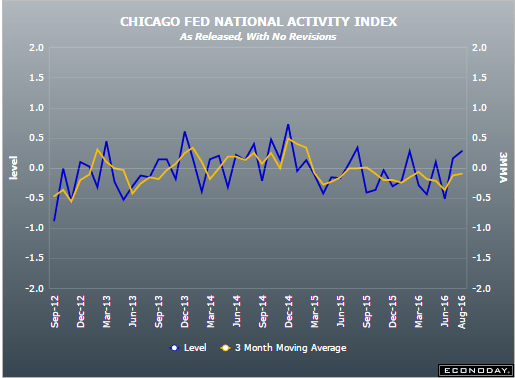
Up a bit for the month, but the 3 month moving average remains negative:
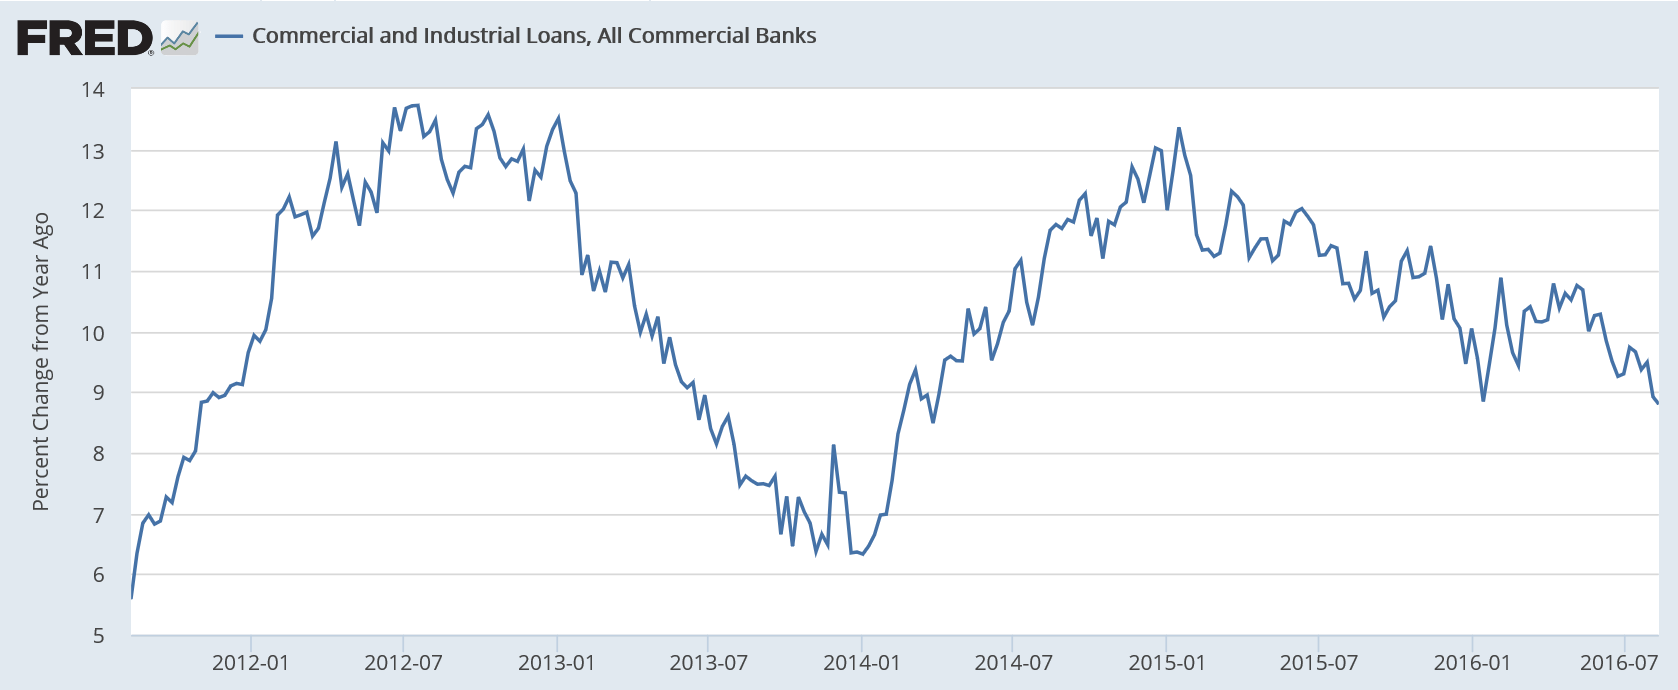
Accelerated with the shale boom, still decelerating with the shale bust:
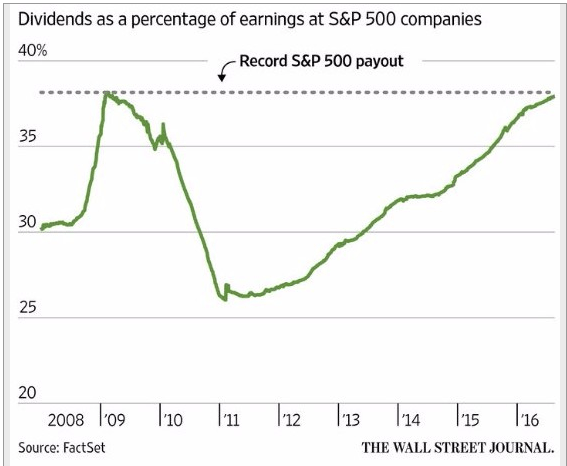
Problem is incentives to not spend income, as below, reduce sales, output, and employment. That is, they’ve got it backwards if the goal is increased GDP etc.
Japan mulls longer-term tax break for savers
Aug 18 (Nikkei) — The Japanese government plans to offer a new option for tax-free investment accounts featuring a much longer exemption. More than 10 million of the so-called NISA accounts were opened between the program’s 2014 launch and this past March. But the rate of new sign-ups is slowing, and just over half of the accounts have never been used. Only a handful of people hit the 1.2 million-yen ($11,900) annual investment limit. The NISA accounts allow individuals to accumulate wealth for up to five years without paying taxes on capital gains or dividends on investments in stocks and mutual funds.
Someone agrees with me!
The truth is the economy is most likely already in a recession and there never was a viable economic recovery. Investors need to keep their eyes open as equity prices march further into all-time high territory. And, most importantly, have a strategy to protect their portfolios once sanity returns to the market.
http://www.cnbc.com/2016/08/18/heres-proof-that-the-economic-recovery-is-over-commentary.html
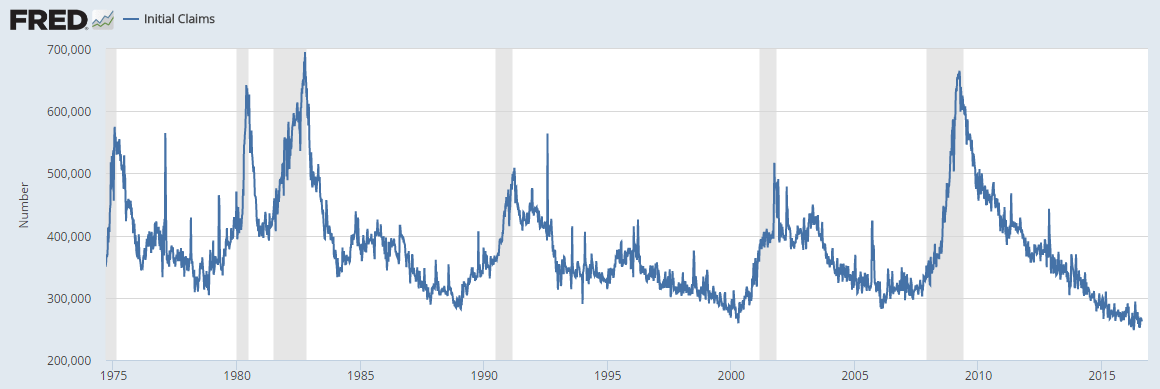
Still looks to me like this is perhaps the most misunderstood statistic, as analysts believe it is signaling strength in the labor markets. Instead I’m suggesting claims are extraordinarily low because the unemployment benefits have become much harder to get:
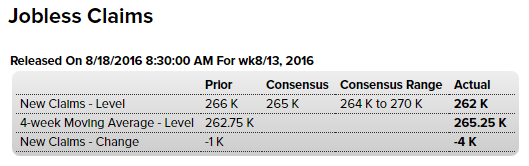
Even with a much higher population and labor force, and with a higher unemployment rate,
new claims are at 40 year lows:
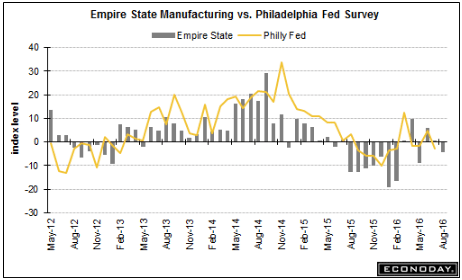
Not at all good:

Highlights
Once again the Philly Fed’s headline tells an entirely different story than the details. At plus 2.0, the headline may be a bit flat but that’s far better than orders or employment which are in deep contraction.New orders fell back into negative ground, to minus 7.2 from July’s plus 11.8 for the very weakest reading of the year. Backlog orders fell to minus 15.0 from plus 1.9 which is also the weakest reading of the year. At a numbing minus 20.0, employment is down for an 8th month in a row for the weakest showing of the cycle, since July 2009. Inventories are in sharp contraction, the workweek is in sharp contraction, and delivery times are speeding up which is a sign of weakness. The one sign of strength (other than the headline) is shipments, at plus 8.4 in a gain that won’t likely be repeated anytime soon given the weakness in orders.
The headline for this report is not a composite but maybe it should be. If it were, it would be deeply negative.
Exports and imports both dropped substantially, indicating global trade continues to decline:
Japan Balance of Trade
Japan recorded a 513.5 JPY billion surplus in July of 2016, compared to a 261.39 JPY billion deficit a year earlier and beating market consensus of a 283.7 JPY billion surplus, as exports fell less than imports.Year-on-year, sales dropped by 14.0 percent to 5,728.41 JPY billion in July, following a 7.4 percent fall in June and in line with estimates.
Imports decreased by 24.7 percent to 5,214.90 JPY billion, compared to a 18.8 percent decrease in a month earlier while markets expected a 20.6 percent drop.
In June 2016, the country posted a 692.83 JPY billion trade surplus.
The chart shows both how depressed the mortgage market is historically as well as how it’s been deteriorating over the last several months:
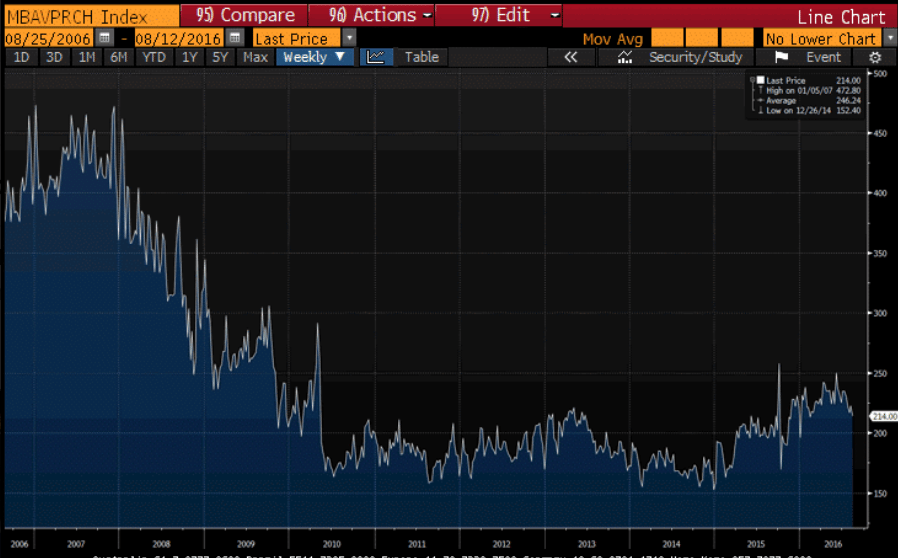
And lots of headlines like this popping up:
Wednesday, August 17, 2016
Sacramento Housing in July: Sales down 7%, Active Inventory down 10% YoY
Las Vegas Real Estate in July: Sales down 10% YoY, Inventory down 1%
Read more at http://www.calculatedriskblog.com
U.S. companies’ stock buyback plans hit four-year low: TrimTabs
Aug 16 (Reuters) — At $1.8 billion a day, the amount of buyback announcements from U.S. companies during the nearly completed second-quarter earnings season is tracking to the lowest since the same period of 2012, according to TrimTabs, which compared six-week periods during which companies report quarterly results. The number of companies announcing buybacks has also fallen, averaging 3.3 a day so far, well below the 6.1 per day during earnings season a year ago. According to TrimTabs, the total amount of announced buybacks through July is down 21 percent from the same period a year ago.*
It dropped a bit so don’t expect to read about it anywhere else…
;)
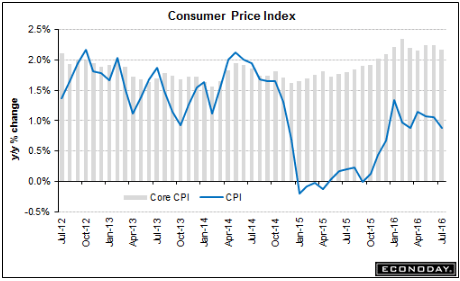
Lots of nuances but still tending to keep the Fed on hold:
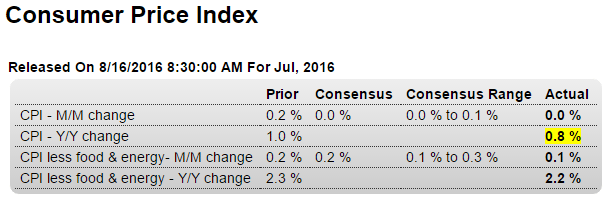
Highlights
The headlines for the consumer price report look very soft but there are important offsetting pressures. The CPI came in unchanged in July, pulled back by a 1.6 percent monthly decline in energy prices and other weakness including flat prices for food and contraction in transportation. And it doesn’t look much better when excluding food & energy where the gain for the core is only 0.1 percent.But two important categories — medical and housing — both show life. Medical care prices jumped 0.5 percent in the month for a year-on-year rate that leads the major readings, at a downright inflationary 4.0 percent. Housing costs rose 0.3 percent in the month with this year-on-year at 2.4 percent which, next to medical care, is the second highest on the list.
Total year-on-year prices are up only 0.8 percent with the closely watched core dipping 1 tenth to 2.2 percent. But the decline in energy and transportation can very well reverse quickly as could the lack of pressure in food prices. But medical and housing costs are a core of their own and should give policy makers confidence that their efforts to lift inflation are making incremental progress.
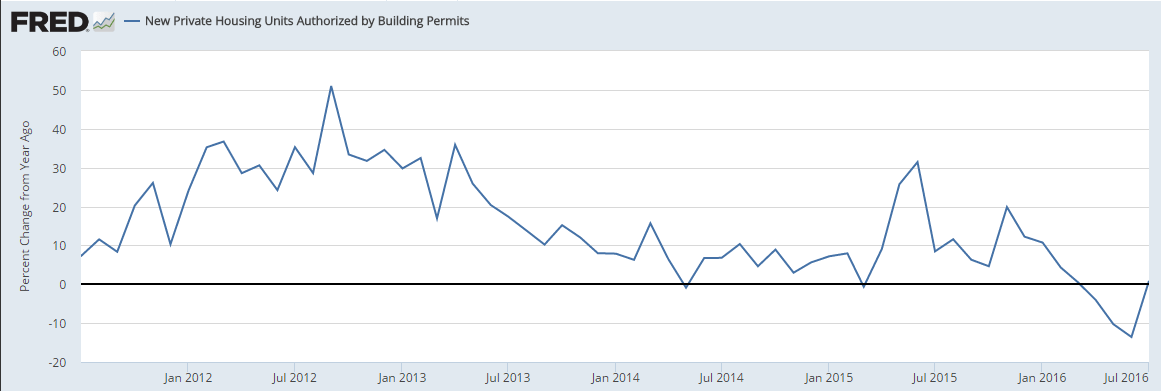
Starts better than expected but permits down and looking very weak. And as you don’t build a house without a permit, not looking good for starts for the rest of q3:
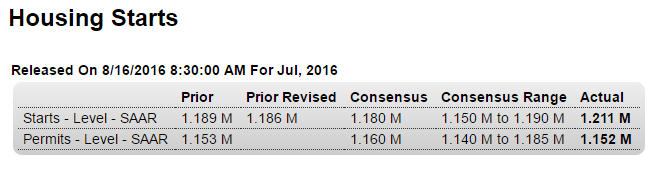
Highlights
Housing starts are strong but permits are flat in what are mixed indications for the nation’s housing sector. July starts rose a strong 2.1 percent to a 1.211 million annualized rate which comes on top of June’s 5.6 percent surge. Starts for single-family homes, the most important category, rose a very respectable 0.5 percent in July but were dwarfed by a 5.0 percent surge for multi-family homes. These results point to ongoing strength for construction.But there may be less strength ahead based on permits which show little change, at a 1.152 million rate in July. Here the single-family reading is down 3.7 percent, offset by a jump in multi-family permits of 6.3 percent. But single-family homes are costlier to build and the decline in permits here is a major offset to the gain for multi-family units.
The housing sector is a positive for this year’s economy though it’s performance continues to be less than smooth.
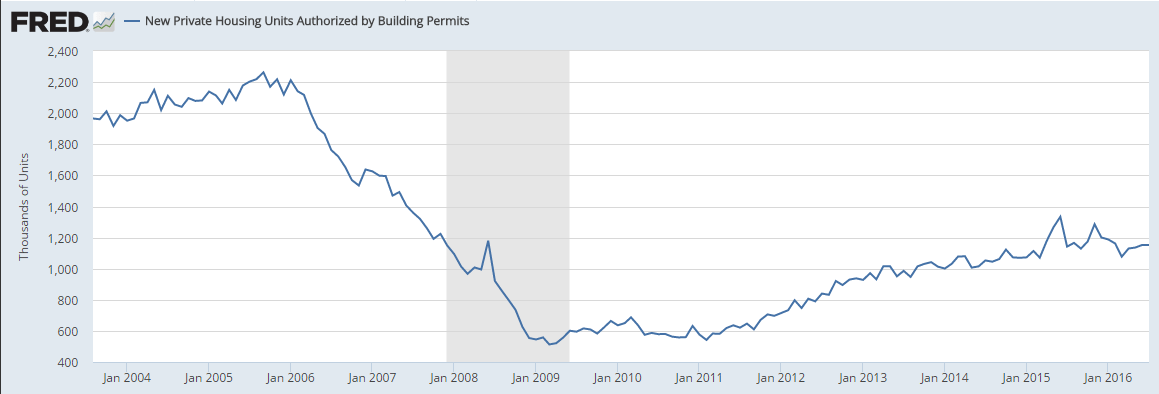
Building Permits:
Privately-owned housing units authorized by building permits in July were at a seasonally adjusted annual rate of 1,152,000. This is 0.1 percent below the revised June rate of 1,153,000, but is 0.9 percent above the July 2015 estimate of 1,142,000.Read more at http://www.calculatedriskblog.com/#WoS6ZvcHVCFmJYeR.99
Looking like housing will add little if any to growth this year:
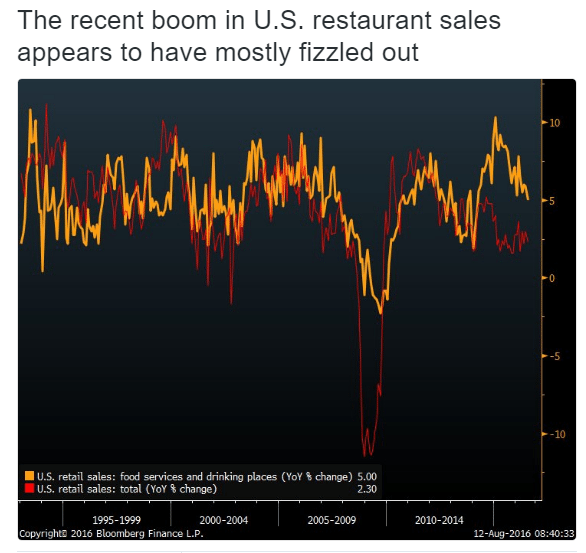
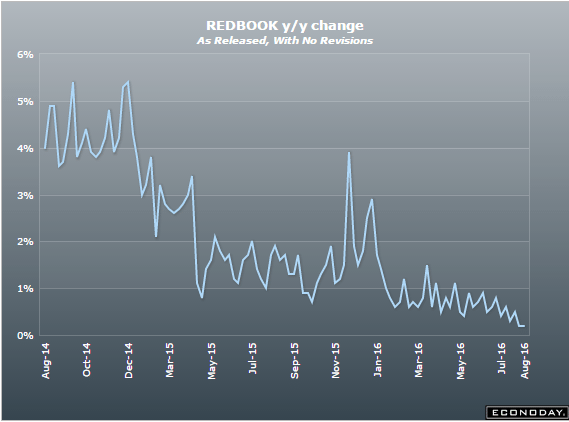
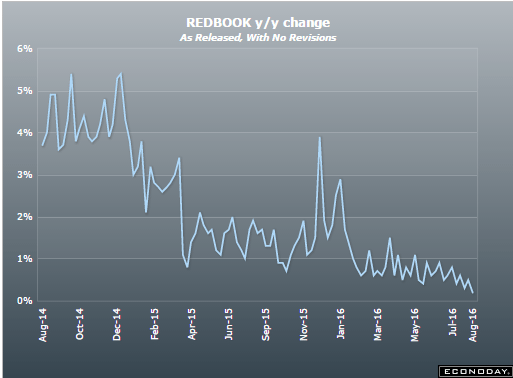
Just another indication of weak retail sales:
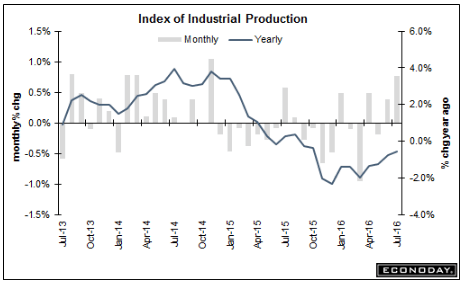
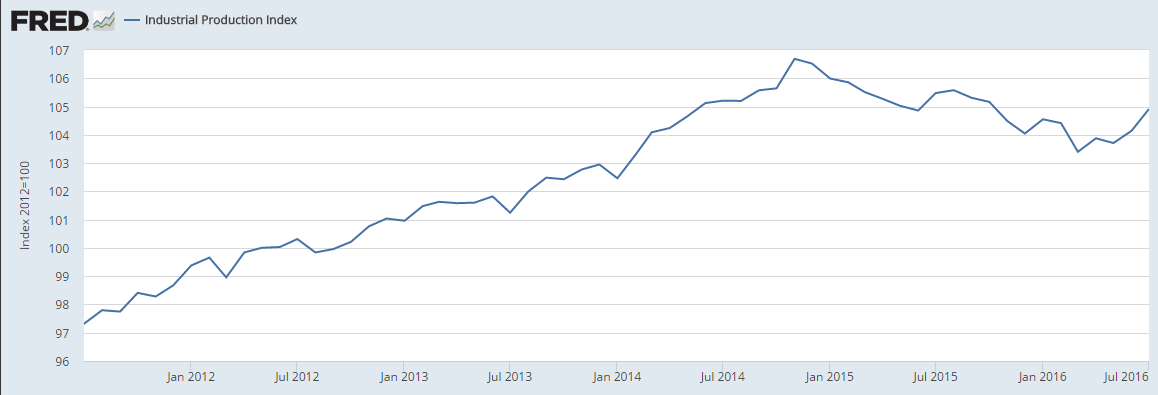
Up more than expected (due to in part to added air conditioning usage) but last month’s ‘good’ number revised down, so best to reserve judgement on this month’s number. And in any case, the year over year performance remains at recession type levels:
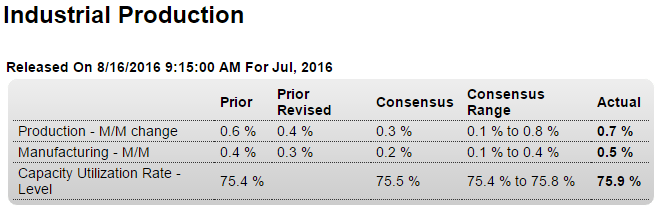
Highlights
Strength in manufacturing leads a strong industrial production report where the July headline jumped 0.7 percent to give a big 1/2 point lift to the capacity utilization rate which is at 75.9 percent.Manufacturing output rose 0.5 percent in the month which follows a downward revised but still very respectable 0.3 percent gain in June. Vehicle production was exceptionally strong in June and was also very solid in July though other manufacturing industries were also strong contributors to the latest month’s gain. Hi-tech was strong in the month and a look at market groups shows 0.6 percent monthly gains for both consumer goods and business goods, the latter a plus given the persistent weakness in business investment.
Outside of manufacturing, utility production jumped 2.1 percent for a second straight month reflecting what has been a strong cooling season. Mining also was a positive contributor, up 0.7 percent in the month though year-on-year output here is still down in the double digits, at minus 10.2 percent.
Though these results are very positive and point to a strong factory contribution to the ongoing economy, weakness in separate data on factory orders unfortunately is not pointing to further gains ahead for manufacturing production.
Note that the traditional non-NAICS numbers for industrial production may differ marginally from the NAICS basis figures.
From the Fed: Industrial production and Capacity Utilization
Industrial production rose 0.7 percent in July after moving up 0.4 percent in June. The advance in July was the largest for the index since November 2014. Manufacturing output increased 0.5 percent in July for its largest gain since July 2015. The index for utilities rose 2.1 percent as a result of warmer-than-usual weather in July boosting demand for air conditioning. The output of mining moved up 0.7 percent; the index has increased modestly, on net, over the past three months after having fallen about 17 percent between December 2014 and April 2016. At 104.9 percent of its 2012 average, total industrial production in July was 0.5 percent lower than its year-earlier level. Capacity utilization for the industrial sector increased 0.5 percentage point in July to 75.9 percent, a rate that is 4.1 percentage points below its long-run (1972–2015) average.
Read more at http://www.calculatedriskblog.com/#WoS6ZvcHVCFmJYeR.99
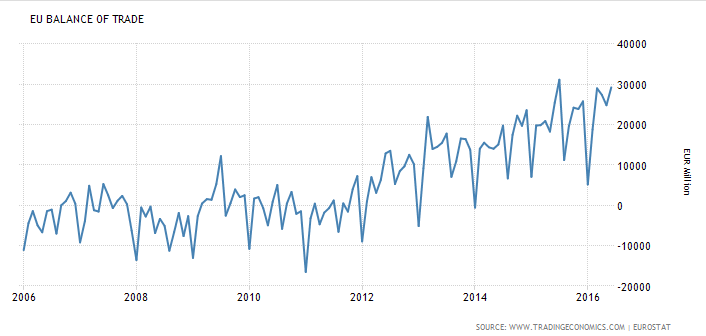
The trade surplus offers fundamental support for the euro, even as total trade is weakening which tends to indicate weakening global demand:
Euro Area Balance of Trade
The trade surplus in the Euro Area increased 14.9 percent year-on-year to € 29.2 billion in June of 2016 as exports decreased 2.2 percent while imports shrank at a faster 5 percent. Figures compare with market forecasts of a € 25.8 billion surplus. It was the biggest trade surplus since July last year.
Just another bit of bad news:

Highlights
The New York region’s manufacturing sector remains flat based on the Empire State index which came in slightly below zero at minus 4.21 in August vs plus 0.55 in July. New orders are especially flat, at plus 1.04 vs July’s minus 1.82, with unfilled orders extending a long run of negative readings at minus 9.28. There is, however, strength in shipments, at 9.01, but it won’t last long given the weakness in orders. Employment is also flat, at minus 1.03. Prices are steady with input pressures moderate and easing and selling prices fractionally higher. A special negative in the report is a 5.50 point decline in the 6-month outlook to 23.74 which is the least optimism this sample has shown since February. Hit by weak global demand and weak demand for capital goods, the factory sector has yet to get in gear this year and this report, the first for August, doesn’t point to any improvement.
Up a bit but the chart tells me nothing’s going on here:
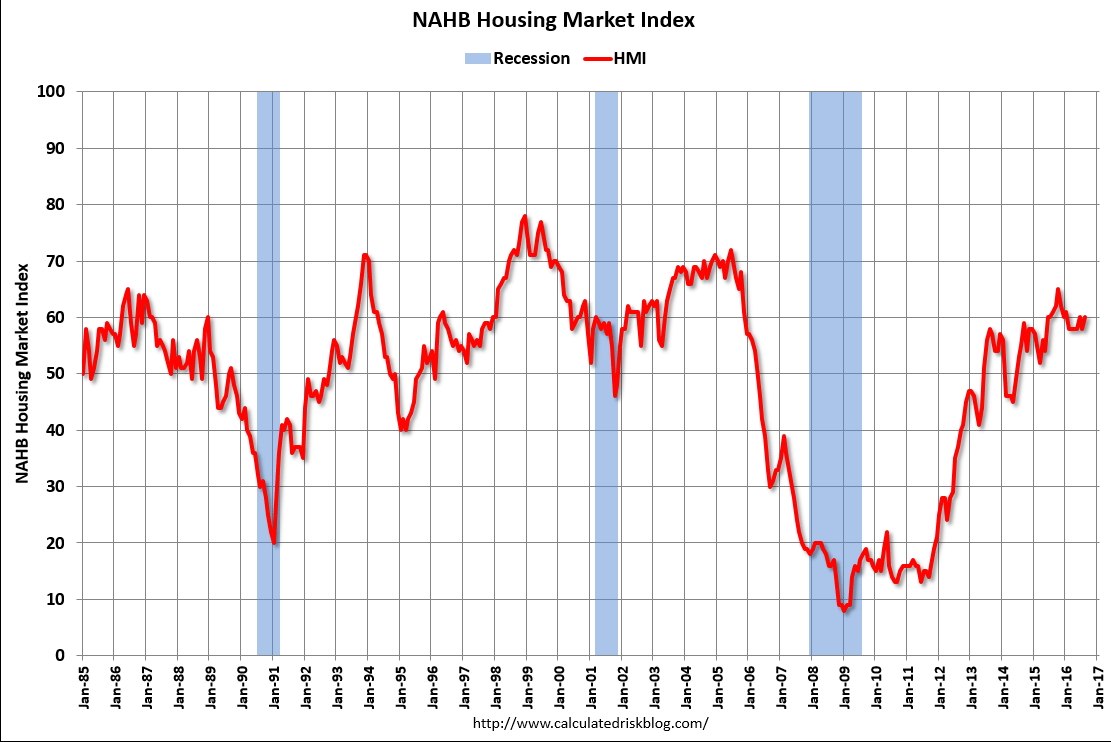
From the NAHB: Builder Confidence Rises Two Points in August
Builder confidence in the market for newly constructed single-family homes in August rose two points to 60 from a downwardly revised reading of 58 in July on the National Association of Home Builders/Wells Fargo Housing Market Index (HMI).
Read more at http://www.calculatedriskblog.com/#me4luWJRvTtC522q.99
Interesting way of saying occupancy is down from last year…
;)
Hotels: Occupancy Rate on Track to be 2nd Best Year
By Bill McBride
From HotelNewsNow.com: STR: US hotel results for week ending 6 August
The U.S. hotel industry reported mixed results in the three key performance metrics during the week of 31 July through 6 August 2016, according to data from STR.
In year-over-year comparisons, the industry’s occupancy decreased 1.6% to 75.6%. However, average daily rate was up 2.7% to US$127.69, and revenue per available room increased 1.1% to US$96.59.
Read more at http://www.calculatedriskblog.com/#me4luWJRvTtC522q.99