Factory orders, Trade, Consumer credit, Fed beige book, Las Vegas real estate sales

Highlights

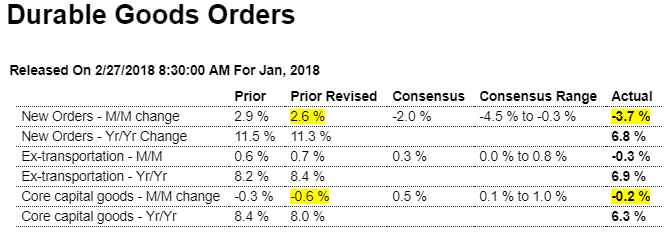
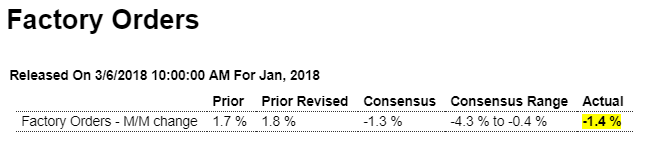
Today’s factory orders report, down 1.4 percent at the headline level but showing life underneath, closes the book on what was a mixed to soft month of January for manufacturing. Aircraft has been a bright spot for the factory sector and mitigates what is a 28 percent downswing in January. Excluding transportation equipment, where aircraft and also motor vehicles are tracked and which were also weak with a 0.5 percent decline, factory orders fell 0.3 percent but follow impressive 0.8 and 0.4 percent gains in the prior two months.

The split between the report’s two main components shows a 0.8 percent rise for nondurable goods — the new data in today’s report where strength is tied to petroleum and coal — and a 3.6 percent drop for durable orders which is 1 tenth less weak than last week’s advance report for this component.

Orders for computers and consumer products are highlights of the report as is a 0.6 percent rise in total shipments. But shipments of core capital goods (nondefense ex-aircraft) are not part of the good news, falling 0.1 percent in the month for a 2 tenth downward revision from the initial reading and which gets business investment off to a slow first-quarter start. And orders for January core capital goods are revised 1 tenth lower to a 0.3 percent decline that follows December’s 0.5 percent dip.

Unfilled orders are another of the report’s weaknesses, down 0.3 percent in a reading that, unlike regional and private surveys, does not point to capacity stresses nor immediate inflationary risks.

This report is a reminder that not all the data on the factory sector are strong and underscores the second straight no change reading in the manufacturing component of the previously released industrial production report for January.


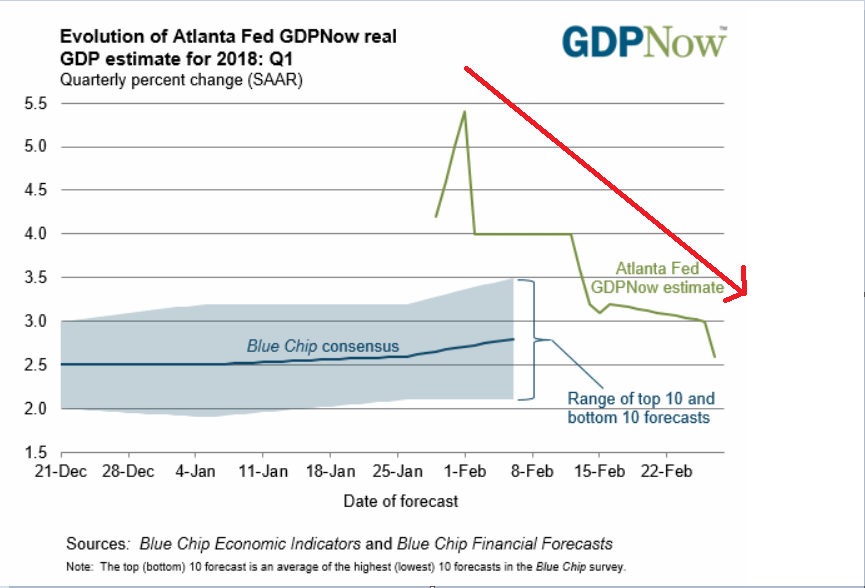
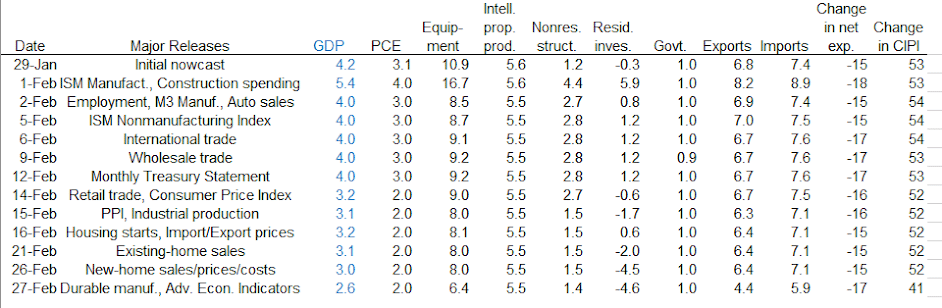
Not a good sign for GDP:
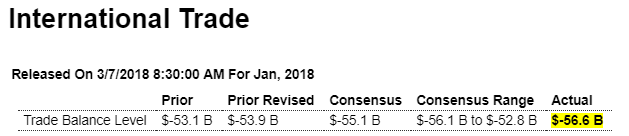
Highlights

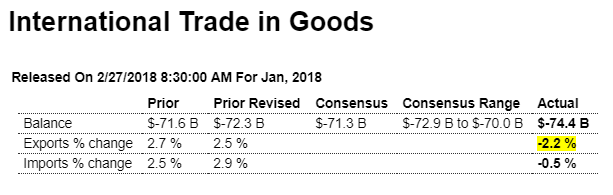
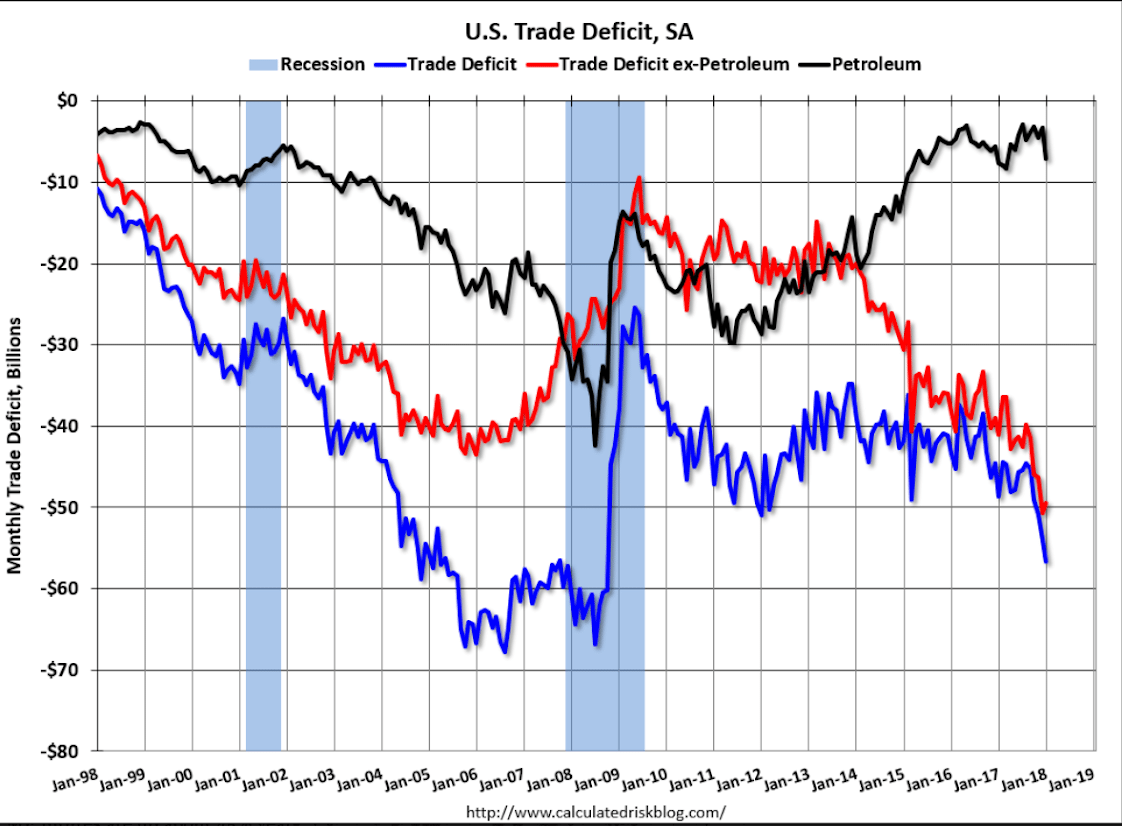
The nation’s trade deficit widened sharply in January, to $56.6 billion which is beyond Econoday’s deepest estimate and marks a negative start to first-quarter net exports.

Imports, at $257.5 billion, were unchanged in the month but not exports which fell a sharp 1.3 percent to $200.9 billion. Exports of services were steady at $66.7 billion while exports of goods fell 2.2 percent to $134.2 billion. And here to blame are industrial supplies, which includes primary metals, down $1.3 billion to $41.5 billion and also capital goods, a central focus of U.S. strength that fell $2.6 billion to $44.9 billion and includes a $1.8 billion decline in civilian aircraft exports to $3.8 billion.

Imports show a $2 billion rise in industrial supplies to $47.3 billion and a welcome $0.9 billion decline in consumer goods to $54.6 billion. Petroleum imports rose $2.2 billion to $13.2 billion reflecting both higher volumes and higher prices.

Exports are going to have to pick up in February and March otherwise first-quarter GDP will be fighting uphill against an accelerating trade deficit.

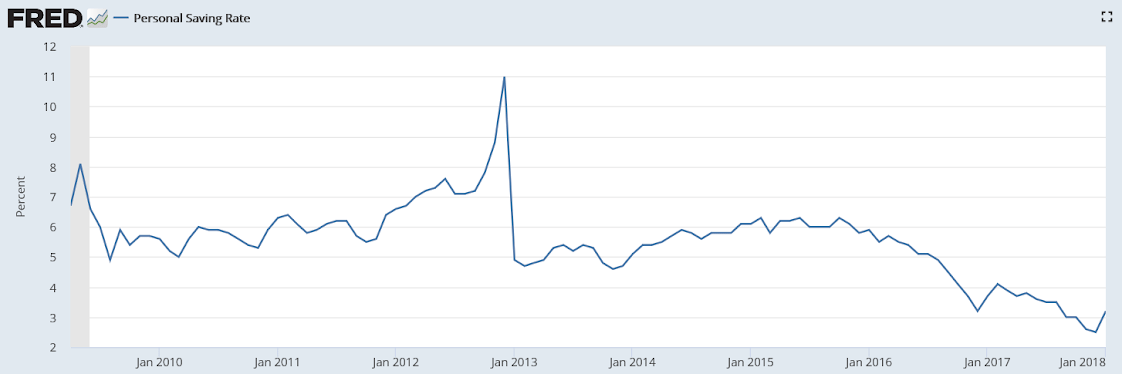
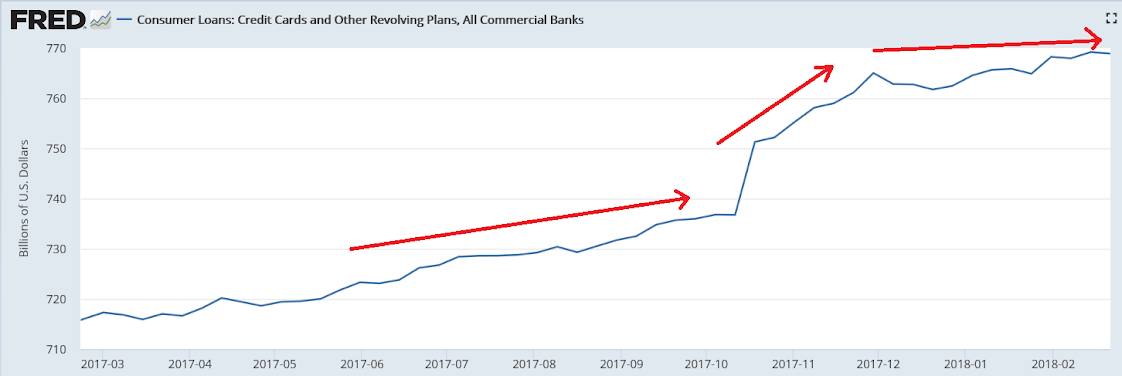
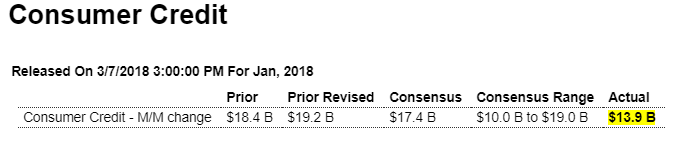
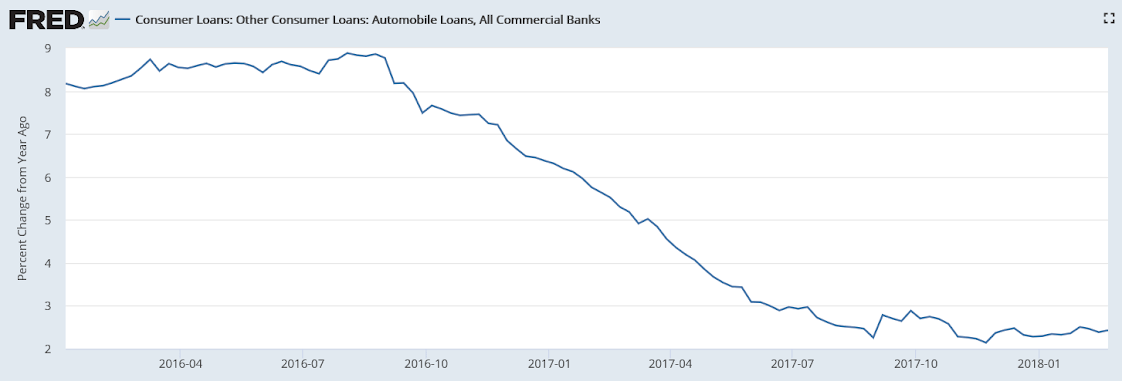
Consumer credit growth was low in 2017 until the what now looks to have been a one time ‘dip into savings’ at year end, with a pronounced flattening most recently:


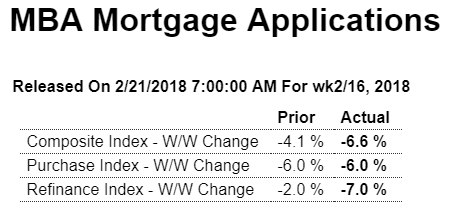
Low and less than expected, inline with the above bank data above:


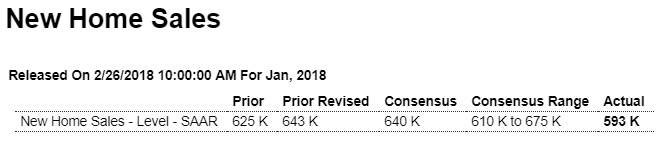
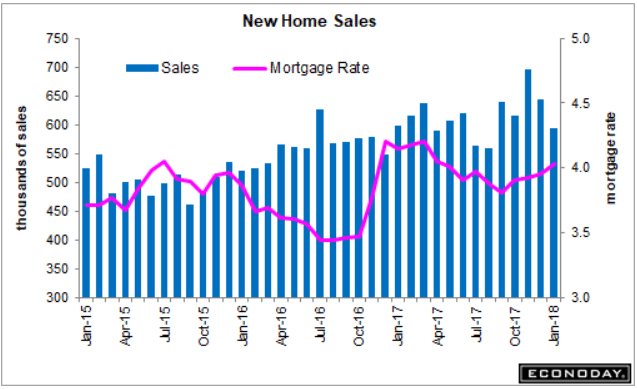
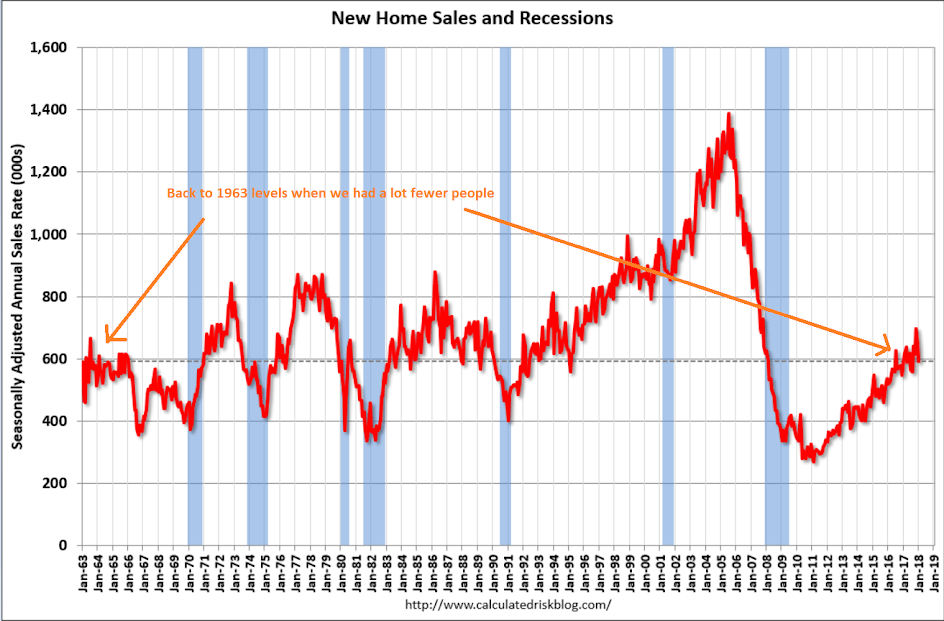
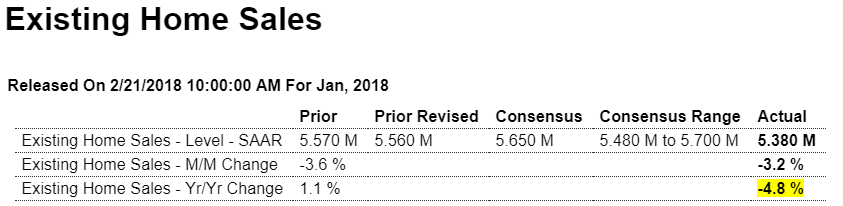
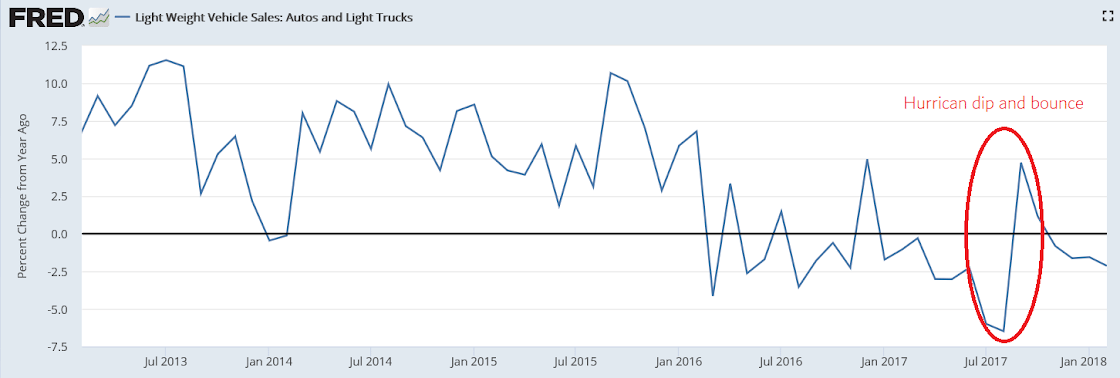
So they’ve finally noticed weakness in housing and cars:

Highlights

Reading the Beige Book can be sobering as the latest edition may be weaker than January’s when at least the Dallas Fed was reporting special strength. But now all 12 districts are back in the “modest-to-moderate” camp with especially soft descriptions for auto sales, which are said to be flat or declining in all districts, and also housing and construction which the report says, outside of isolated strength in some nonresidential markets, is being held down by labor and material shortages.

Las Vegas Real Estate in February: Sales Down 4% YoY, Inventory down 31%
by Bill McBride on 3/07/2018 10:59:00 AM

This is a key distressed market to follow since Las Vegas saw the largest price decline, following the housing bubble, of any of the Case-Shiller composite 20 cities.

Read more at http://www.calculatedriskblog.com/#So8QxRxTRVE157Y7.99

Light vehicle sales, Trump tariffs

Blaming interest rates for a decline that started about two years ago:

U.S. Car Sales Fall as Credit Terms, Higher Payments Squeeze Buyers (WSJ)

Overall U.S. vehicle sales dropped 2.4% in February, to 1.3 million, according to Autodata Corp. J.D. Power estimates incentive spending in February—averaging $3,850 per vehicle—was down slightly from the same month in 2017. The seasonally adjusted sales pace for the market slipped to 17.1 million on an annualized basis, from 17.5 million a year earlier, according to Autodata. Average monthly payments now exceed $525 a month, according to Edmunds.com, with the online-shopping company estimating that interest rates on new-vehicle loans hit an eight-year high in February.

What best serves public purpose when this is a concern is to require defense needs be sourced domestically while the rest of the economy continues unrestricted:

“The premise for the decision, known as Section 232, was on national security grounds. The White House claimed that relying on foreign steel could threaten the U.S. defense industry.”

I wrote this a year or so ago and just modified to keep it current:

Shop to Win!

The President no doubt knows that when you go shopping, buying at the lowest price is the mark of a winner, while paying too much is the mark of a loser. Yet when it comes to buying lumber from Canada, cars from Germany, and now steel and aluminum, the President has viciously attacked and is now retaliating against other nations for not charging us enough for their products!

And while everyone knows that buying at the lowest price is a good thing, there is no serious push back from Democrats, the ‘free trade’ Republicans, the media or any of the headline mainstream analysts. There is clearly something very wrong with their underlying mainstream logic that leads to this type of costly Presidential blunder.

Yes, when we buy imports jobs are lost, just as when we replace workers with machines, including lawn mowers, vacuum cleaners, and power washers, jobs are lost. And yet somehow we’ve survived all that. We went from needing 99% of the people working to grow our food to less than 1%, and manufacturing jobs are down to only 7% of the labor force. And yet the remaining 90% of us are not all unemployed, as jobs have proliferated in the service sector, where most of those jobs are now considered to be better jobs than the lost agricultural and manufacturing jobs. Nor has a trade deficit necessarily resulted in higher unemployment or lower pay. In 1999, for example, we had record imports with unemployment under 4% and inflation under 2%, and students were getting recruited for good paying jobs well before graduation.

The answer to sustaining high levels of employment and pay is fiscal policy. If for any reason, including more imports, weak demand at home is keeping unemployment too high or wages too low, the appropriate policy response is fiscal relaxation- either a tax cut or spending increase, even if that increases the public debt- and not to tax or otherwise drive up the cost of imports. Unfortunately however, the policy that allows all of us to pay the lowest prices for imports and have good paying jobs to replace those lost because of imports has been taken entirely off the table by both Republicans and Democrats. Consequently a very good thing for America- lower prices of imports- has been turned into a very bad thing- unemployment, and all because of the fake news about the public debt that is supported by Republicans and Democrats.

The US public debt is nothing more than the dollars spent by the federal government that have not yet been used to pay taxes. Those dollars spent and not yet taxed sit in bank accounts at the Federal Reserve Bank that are called ‘reserve accounts’ and ‘securities accounts’, along with the actual cash in circulation. Treasury securities (bonds, notes, and bills) are nothing more than dollars in securities accounts at the Federal Reserve Bank, functionally the same as dollars in savings accounts or CD’s at commercial banks.

Think of it this way- when the government spends a dollar, that dollar either is used to pay taxes and is lost to the economy, or it’s not used to pay taxes and remains in the economy. Deficit spending adds to those dollars that were spent but not yet taxed, which is called the public debt. And what’s called ‘paying off the debt’ (as happens to 10’s of billions of Treasury securities every month) is just a matter of the Fed shifting dollars from securities accounts to reserve accounts- a simple debit and a credit- all on its own books. (No tax payers or grand children required…) The ‘ability to pay’ is always there- it’s just a debit and a credit to accounts on the books of the Federal Reserve Bank. The fear mongering about the US running out of money or constraints by foreigners is simply not applicable to today’s monetary system.

And if you are worried about inflation, our proposal works to lower prices for all of us, while the Presidents direct policy is to raise the prices we all pay.

And if the concern is national security, the policy response that best serves public interest is to order the defense department to require domestic sourcing of what they consider strategically important,
and let the rest of us continue to shop for the lowest possible prices.

Point is, once it’s understood that 1) the public debt is nothing more than what can be called the net money supply 2) there is no risk of default 3) there is no dependence on foreign or any other lenders 4)there is no burden being put on future generations the President will be free to make us all winners by being our shopper in chief who works to get us the lowest possible prices.

Personal income and expenditures, Construction spending

About as expected, with a relatively small increase from the tax cuts, which are a one time event. And the weakness in consumption hints at those receiving the cuts having a low propensity to spend. Also, the still too low personal savings rate suggests continuing weakness:

Highlights

Core inflation did noticeably rise but not more than expected, at 0.3 percent in January but not enough to lift the year-on-year rate which holds at an as-expected 1.5 percent. Total prices, reflecting a rise in gas, rose 0.4 percent with this year-on-year rate also unchanged, at 1.7 percent. These results fit in with the Federal Reserve’s expectations for a gradual upward trend for prices but they don’t accelerate the outlook.

The income side of this report does show the effect of tax changes, as personal taxes fell 3.3 percent in the month to help underpin total income which rose a solid 0.4 percent for a second straight month. The wages & salaries component of income rose 0.5 percent for a second time in three months. Disposable personal income, after holding at 0.3 and 0.4 percent gains in prior months, rose 0.9 percent in January for the largest gain in a year.

Spending data are soft, up only 0.2 percent overall and marking a weak first-quarter start for the consumer. Spending on durable goods fell 1.5 percent on a downturn in vehicle sales offset by a gas-related 1.0 percent rise in non-durable spending and a 0.3 percent increase in service spending.

Reflecting the drop in taxes, the savings rate popped back higher in January, up 7 tenths to 3.2 percent. The gain in income is a positive not only for the savings outlook but the spending outlook as well. This report, despite the monthly weakness in spending, points to economic health, specifically rising income and gradually rising prices.


And another weak bit of hard data:


Manufacturing surveys again not in sync with each other:

ISM:

MMT article, Mtg purchase apps, Pending home sales

Very friendly article!

Modern Money Theory Explained (Vice)

Nice increase but year over year remains weak:

Highlights

With the rise in mortgage rates taking a pause, purchase applications for home mortgages rose by a seasonally adjusted 6.0 percent in the February 23 week. But unadjusted, purchase applications were down 1.0 percent from the prior week, putting the year-on-year gain in the Purchase Index at a rather slim 3.0 percent, while applications for refinancing, which tend to be more sensitive to the level of interest rates, fell 1.0 percent, taking the refinance share of mortgage activity down 2.6 percentage points to 41.8 percent. The average interest rate on 30-year fixed rate conforming mortgages ($453,100 or less) remained unchanged from the prior week at 4.64 percent, the highest level in 4 years. The week’s results include an adjustment for the Presidents’ Day holiday.

Way down and prior month revised lower as well:

Highlights

Existing home sales appear to be slowing, the latest evidence coming from the pending home sales index which fell an unexpected 4.7 percent in January to a 104.6 level that is the lowest in nearly 3-1/2 years. Today’s result points to a third straight decline for final sales of existing homes which fell very sharply in both January and December.

Lack of supply is a key factor holding down sales along with rising mortgage rates, at an average of 4.64 percent for 30-year mortgages as reported earlier this morning by the Mortgage Bankers Association. Regional sales data show wide declines especially for the Northeast which had been rebounding in prior months.

The housing sector accelerated at the end of last year but, despite strong leadership from the new home market, appears to have slowed so far this year.

Trade, Durable goods orders, Consumer confidence, Richmond Fed survey, Atlanta Fed nowcast

More signs of a slowdown as exports fall, which means less gdp, and consumer imports down, meaning personal spending was lower than expected, as discussed might be the case previously due to lower personal income growth:

Highlights

Exports came back sharply in January to feed an oversized $74.4 billion goods deficit in January, in what starts off another quarter of trouble for net exports and GDP. Exports fell 2.2 percent in the month with capital goods and industrial supplies posting sharp declines and easily offsetting a sizable gain for the smaller category of consumer goods. Imports also fell but much less so, down 0.5 percent with imports of consumer goods, which on this side of the ledger is the largest category, down 2.2 percent. Imports of capital goods were also down. Today’s report points to a beginning-of-the-year slowing for cross-border trade and a slowing lopsided against exports.

Same here- lower than expected and at odds with the ‘surveys’ that show what I’ve called ‘trumped up expectations’:

Highlights

The major indications on the factory sector are mixed for January with more signs of moderation than acceleration in today’s durable goods report. Total orders sank a sharp 3.7 percent reflecting more than a give back for aircraft orders as the ex-transportation reading dipped an unexpected 0.3 percent. Unfortunately capital goods are part of the weakness, with core orders (nondefense ex-aircraft) down 0.2 percent in January following December’s 0.6 percent decline.

Total shipments are another point of softness, up only 0.2 percent to begin the first quarter off slowly. And shipments of core capital goods, which are inputs into GDP business investment, begin the quarter with only a 0.1 percent gain. Total unfilled orders are another negative, down 0.3 percent and aside from a 0.6 percent gain in December are extending a surprisingly flat trend. One positive is inventory growth, up 0.3 percent and together with gains for this morning’s wholesale and retail inventories (released separately) are pointing to a quick start for first-quarter inventories.

But like the previously released industrial production report, a quick start isn’t what the factory sector is showing and this despite all the enormous strength underway in private and regional surveys like yesterday’s Dallas Fed data or last month’s ISM report. Year-on-year growth rates in today’s report underscore the slowing, moving down from the low double digits/high single digits to the 6 percent range. Like housing, the factory sector appears to be slowing following last year’s rush at year end.

This is one of those ‘trumped up’ surveys that are at odds with the hard data:

Highlights

Market volatility or not, new long-term highs are the continuing story of the consumer confidence index which jumped to 130.8 in February to easily beat Econoday’s consensus and also top the high estimate. Only 14.7 percent of the sample say jobs are currently hard to get which is down noticeably from 16.3 percent in January and points to acceleration for the February employment report. The sample’s outlook for the labor market also continues to rise with 21.6 percent, nearly 3 percentage points higher than January, seeing more jobs opening up six months from now.

Market gyrations however are taking their toll on the sample’s bullishness with only 41.3 percent now seeing stocks moving higher over the next six months for a nearly 10 point monthly decline. The bears are now at 27.4 percent, which is up nearly 7 points.

Inflation expectations are up 1 tenth to 4.7 percent which, however, is very subdued for this reading. A look at component readings shows similar strength between the present assessment and the future outlook, at 162.4 for a 7.7 point gain and 109.7 for a 5.7 point gain, respectively.

Enormous strength in consumer confidence has been a standout feature of the economic data, in some contrast however with consumer spending where strength has been tangible but more limited. If the stock market begins to calm down, it will be interesting to see whether this report actually begins to accelerate further. Watch on Friday for final February consumer sentiment data which, though running less hot than this report, did jump sharply at mid-month.

And here’s another survey:

Highlights

After slower growth in the previous two months, manufacturing activity in the Fifth District showed renewed robust growth in February, with the Richmond Fed Manufacturing Index jumping from January’s 14 to 28, the second highest value on record. Far surpassing consensus analysts’ expectations calling for a modest increase of 2 points, the sharp acceleration in the sixteenth consecutive monthly expansion of manufacturing in the Fifth District was driven by increases in shipments, up 16 points to 31, new orders, up 11 points to 27, and the number of employees, up 15 points to 25.

Note how this has been coming down as weak hard data is released. However it’s also being propped up by survey data:

New home sales, Core inflation chart, Trump testimony

Large drop from already historically depressed levels reverses year end spike, and inline with depressed mortgage applications:

Highlights

Sales of new homes slowed but not all the data in January’s new home sales report are negative. New home sales came in at a much lower-than-expected 593,000 annualized rate in January though, in offsets, the two prior months are revised a net 25,000 higher. And badly needed supply moved into the market, up a monthly 2.4 percent to 301,000 units for sale. On a sales basis, supply jumped above 6 months to 6.1 months vs 5.5 and 4.9 months in the two prior months.

But sales in January were definitely soft as the rate in the South, which is by far the largest housing region, fell 14.2 percent to a 301,000 rate with the Northeast, which had been coming on strong, down 33.3 percent to only a 24,000 rate. Year-on-year, sales in the West are doing best at plus 33.1 percent with the South down, however, a steep 10.9 percent. Overall, new home sales are down a yearly 1.0 percent.

Prices are another negative in the report, down 4.1 percent for the median to $323,000 though the yearly rate is still positive at 2.5 percent.

The new home market surged into the end of last year but understandably slowed in January. Yet supply, that is the lack of it, is an overwhelming issue for the market and today’s details, including gains underway for permits and starts which are growing in the mid-to-high single digits, are positives for the outlook.

White House Legal Team Considers Ways Trump Could Testify Before Mueller

President Donald Trump’s lawyers are considering ways for him to testify before special counsel Robert Mueller, provided the questions he faces are limited in scope and don’t test his recollections in ways that amount to a potential perjury trap, a person familiar with his legal team’s thinking said. Mr. Trump’s legal team is weighing options that include providing written answers to Mr. Mueller’s questions and having the president give limited verbal testimony, another person familiar with the matter said. “Everything is on the table,” this person said.

Mtg purchase apps, CPI, Retail sales

Still depressed and going nowhere:

Highlights

Amid rising interest rates, purchase applications for home mortgages fell by a seasonally adjusted 6.0 percent in the February 9 week. Unadjusted, the year-on-year gain in the volume of purchase applications fell 4.0 percentage points to 4.0 percent. Applications for refinancing fell just 2.0 percent in the week, putting the refinancing share of mortgage applications up 0.1 percentage points to 46.5 percent. Mortgages rates rose to the highest level since January 2014, with the average interest on 30-year fixed rate conforming mortgages ($453,100 or less) up 8 basis points from the prior week to 4.57 percent.

Higher than expected which elevates expectations of Fed rate hikes:

But the Fed may also be looking at this evidence of weakness:

Worse than expected with prior month revised lower as well, ties in with previous discussion about low personal income growth, with this report now indicating personal savings wasn’t quite so low because spending was that much lower than first reported:

Highlights

Retail sales not only proved very soft in January, but a sharp downward revision to December looks certain to pull down what had been outstanding strength for consumer spending in fourth-quarter GDP. Retail sales fell 0.3 percent in January compared to Econoday’s low estimate for no change. December is revised down 4 tenths to unchanged with November, adding insult to injury, also revised down, 1 tenth lower to what is still an outstanding gain of 0.8 percent.

All three months show declines for the leading component which is motor vehicles, falling a very sharp 1.3 percent in January. The weakness here no doubt is the result of replacement demand following the hurricane season which pulled sales forward. Building materials are also weak, down 2.4 percent and in this case possibly reflecting January’s unusually severe weather. But however bad the weather was it didn’t help nonstore retailers, a component that is dominated by e-commerce and which proved dead flat in January with December’s initial surge of 1.2 percent revised down to a much more moderate looking 0.5 percent.

Clothing sales, which had been very soft, rose 1.2 percent in the month, echoing this morning’s consumer price report where apparel prices posted a sudden jump. Restaurant sales, which had been strong, were unchanged while furniture sales wobbled for a second month, down 0.4 percent.

The downward revision to December turns what had been a solid holiday shopping season into a so-so season. Control group sales, which are a direct input into GDP, did rise a very strong 1.2 percent in November but are now down 0.2 percent for December with January limping in at no change. After today’s report, the consumer sector gets a one-notch downgrade from strong to solid.

Unemployment benefits, Debt/GDP, Same store sales

Unemployment benefits are harder to get, as previously discussed:

The Next Recession Is Gonna Really Suck

As a result, the rate at which unemployed Americans receive layoff compensation overall has fallen from about 36 percent in 2007 to about 28 percent in 2017, according to data from The Department of Labor. Wayne Vroman, an associate with the Urban Institute, said a big reason for the decline is that states are finding ways to kick unemployed people off benefits after they’ve already been deemed eligible. His research shows a big increase in “nonseparation determinations.” These are instances of states investigating whether someone is continuing to meet eligibility requirements by doing things like writing down the names and addresses of businesses where they’ve applied for work on forms to state work agencies.

In Florida, it’s not an easy process. The state overhauled its unemployment system in 2011, requiring layoff victims to file claims online and even (for a time) take a math and reading test. Since 2007, before the last recession started, the percentage of unemployed Floridians who receive compensation plunged from 32 percent to 9 percent, almost the lowest rate of coverage in the nation.

While the annual deficit to gdp ratio is higher than the last two cycles, it’s been looking to me that the ‘neutral’ deficit to gdp ratio has been going up as well. This is likely because the unspent income (pension fund and other retirement accounts, corporate reserves including insurance reserves, cash in circulation, $US foreign central bank holdings and other non resident ‘savings’, etc.) is growing at ever higher rates, while private sector deficit spending has been subdued. Consequently, even with what may seem to be what historically has been a sufficiently high Federal deficit, GDP can retreat:

Redbook same store retail sales (not inflation adjusted) fell several years ago, and as stores were closed, same store sales growth eventually resumed, but has been softening lately and is still shy of earlier levels:

Spending bill, Rail traffic, Rig count, Saudi pricing

This alone could add maybe 2% to nominal GDP.
How much real output it adds is another question, of course:

Trump signs massive spending deal into law and ends year’s second government shutdown

Self-professed fiscal hawks in the House also opposed the bill. The nonpartisan Congressional Budget Office estimated Thursday that it would cost about $320 billion. Most of that would come in the first year.
The deal includes:

  • A $165 billion increase in military spending;
  • A $131 billion boost to domestic program spending;
  • Nearly $90 billion in funding for disaster relief efforts in Texas, Florida and Puerto Rico;
  • Two years of funding for community health centers;
  • Another four-year extension of the Children’s Health Insurance Program, for a total of a decade;
  • Funding for existing infrastructure programs related to transportation, drinking water and broadband.

  • Up again. And it’s looking like may have triggered a Saudi price cut: