Employment, Construction spending

Above expectations and indicative of continuous modest growth. However, I have trouble making it all ‘add up’. More comments below:
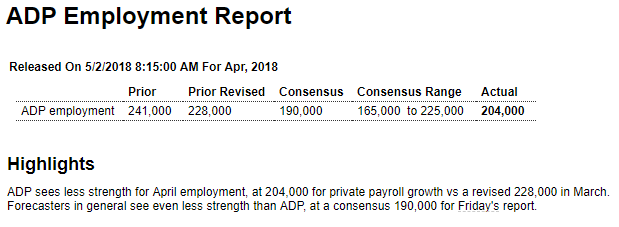
Highlights

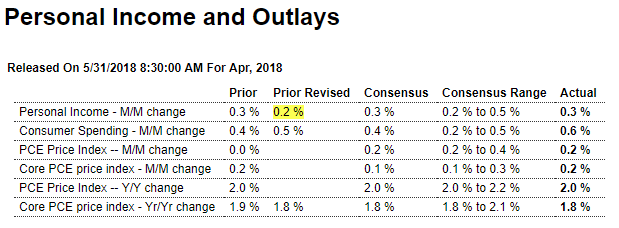
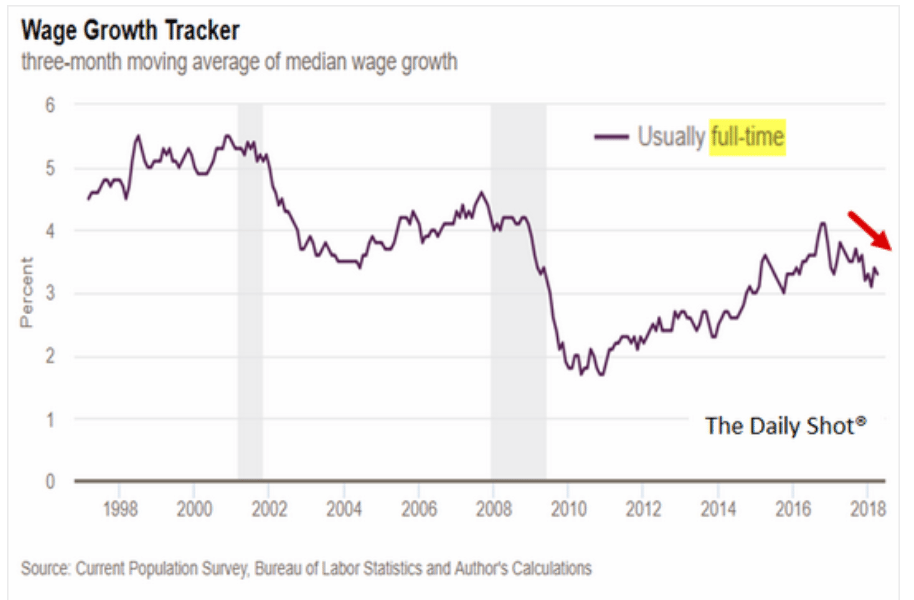
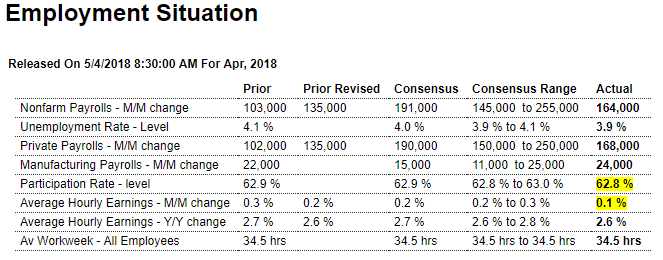
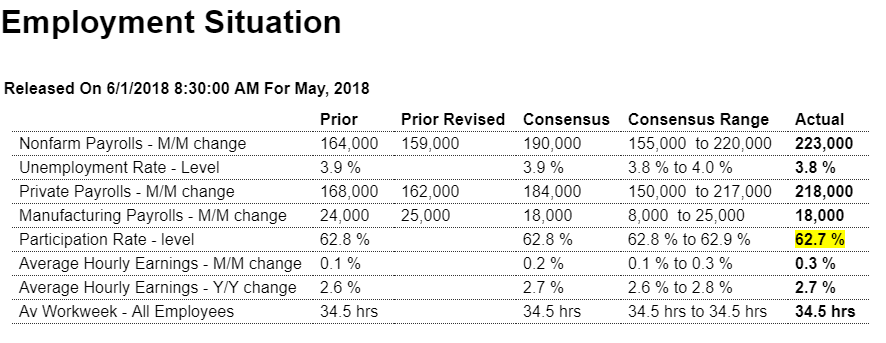
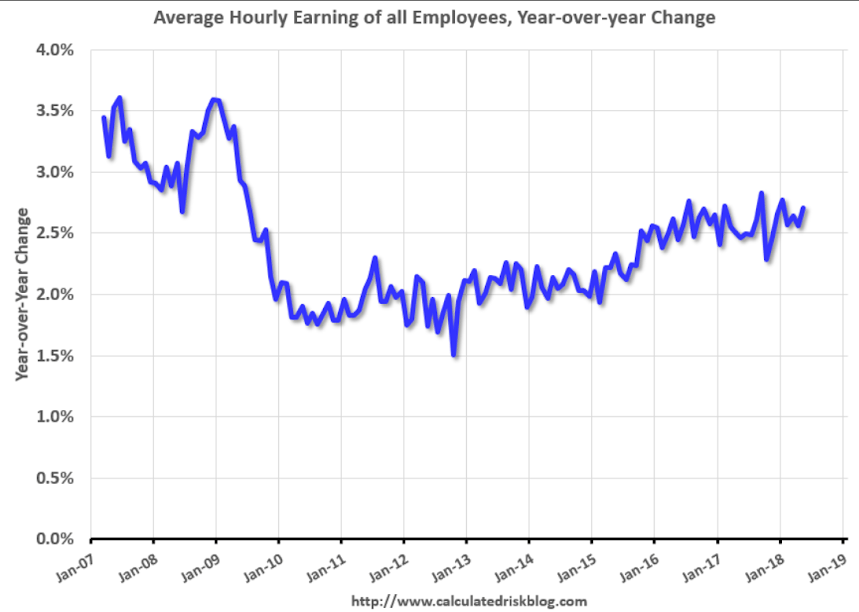
Employment growth is strong and it is not entirely without wage pressure. Nonfarm payrolls rose 223,000 in May to just top Econoday’s high estimate while the unemployment rate moves down a tick to a new expansion low of 3.8 percent. The monthly gain for average hourly earnings came in at the high end of expectations, up 0.3 percent for a year-on-year rate that is up a tenth to 2.7 percent.

Payroll gains are led by trade & transportation, up 53,000 in the month for a sector where delivery delays have been climbing, and include solid 31,000 gains for both retail and also professional & business services with the gain for the latter suggesting that employers are scrambling to fill positions. Manufacturing payrolls rose 18,000 which hits Econoday’s consensus with construction payrolls up 25,000.

The participation rate moves down a tenth to an even thinner 62.7 percent as the number of people actively looking for work is down 281,000 to 6.065 million. The workweek for all employees is unchanged at 34.5 hours though factory hours and factory overtime are down which point to give back for May’s industrial production report.

But today’s report is about strength and the risk that available slack in the labor force is disappearing and in turn raising the potential of wage inflation. The results clearly support expectations for a rate hike at this month’s FOMC.

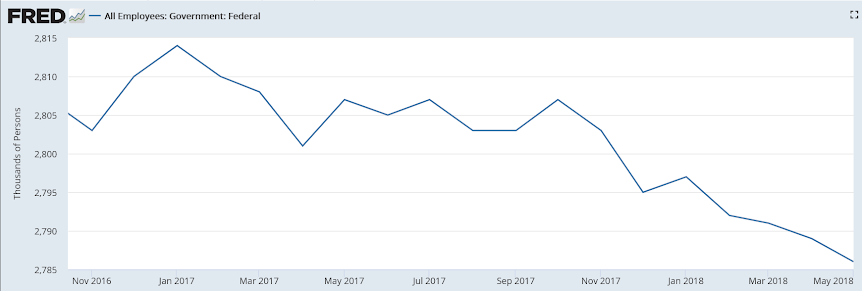
The federal government continues to reduce headcount:

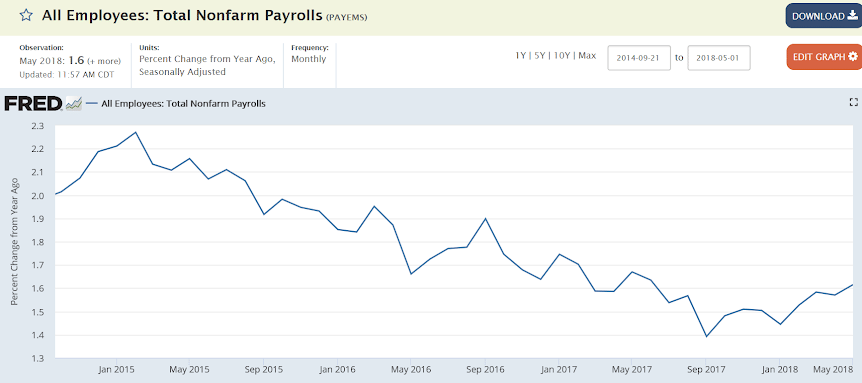
Seems the deceleration in payroll growth reversed around year end, perhaps in reaction to the change in tax laws:

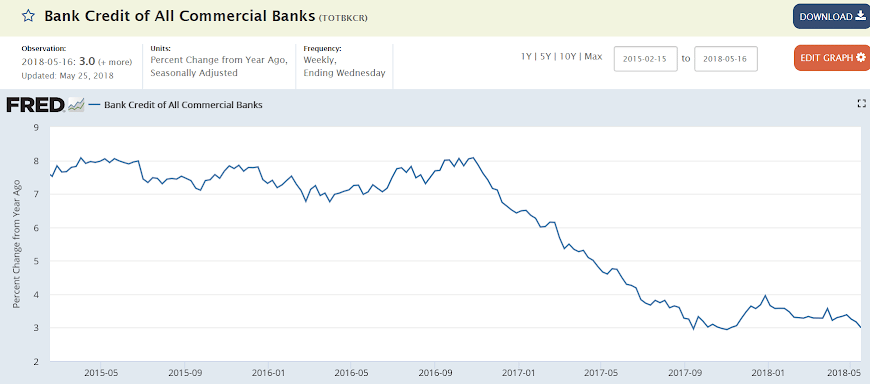
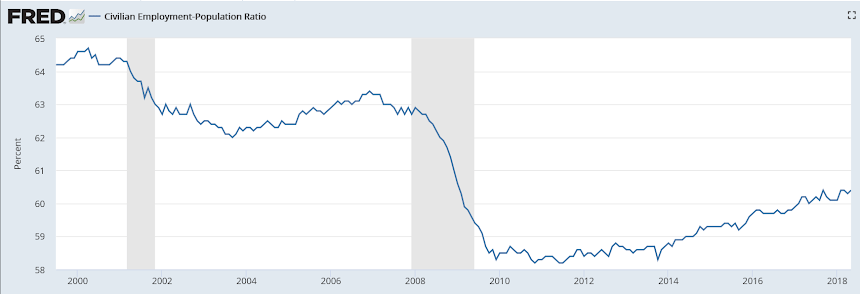
This dropped dramatically with the 2008 recession, recovered only modestly, and most recently seems to have leveled off at historically low levels:

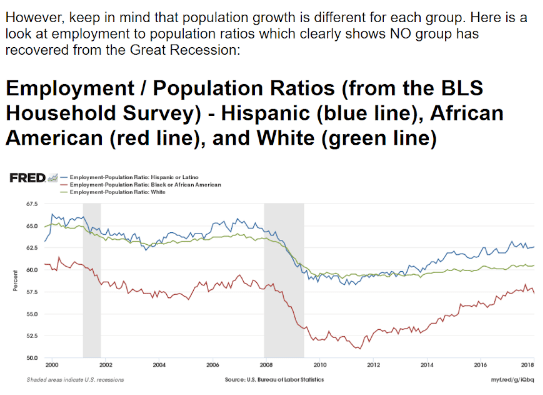
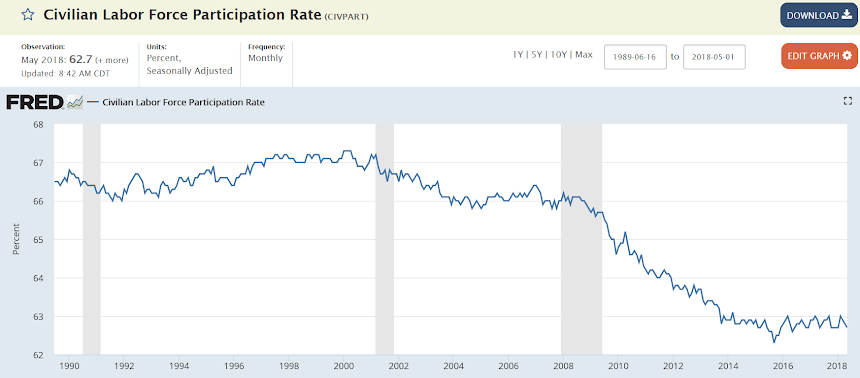
The participation rate began falling with the recession, leveled off for the last two years, and has yet to recover:


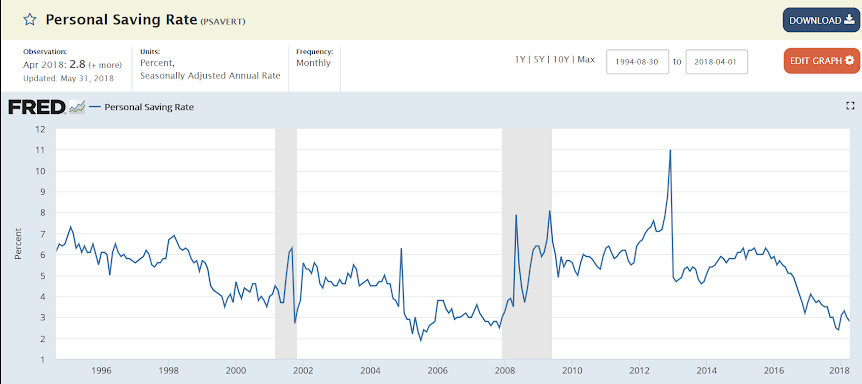
Wage growth shows a lack of demand as well:


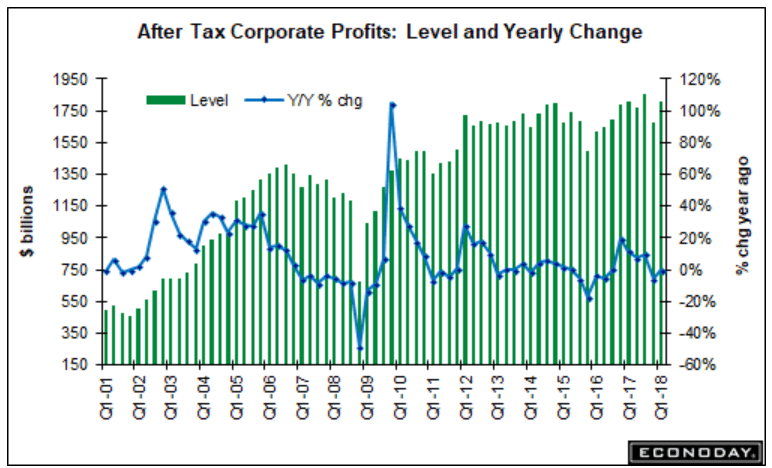
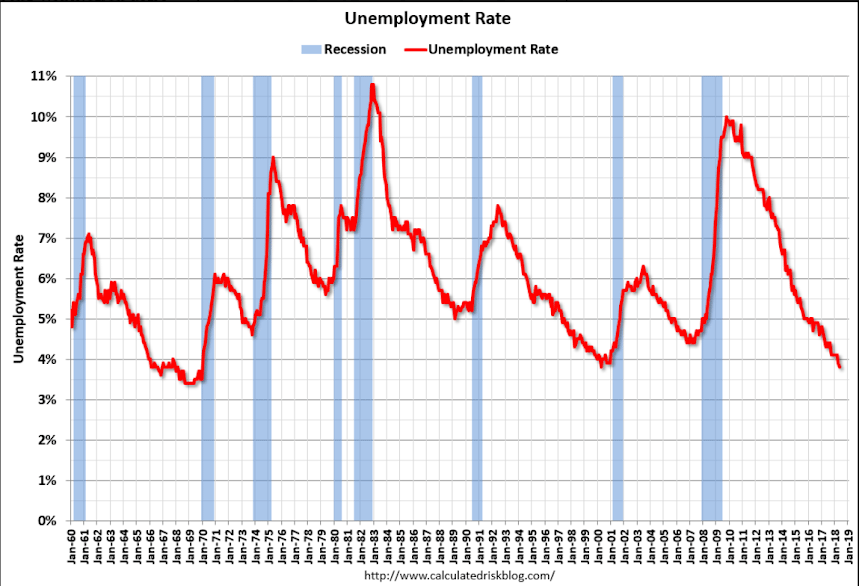
Unemployment as defined has hit a multi cycle low even with weaker wage growth and weaker GDP growth.

Might have something to do with healthcare? Increasingly health insurance is available only through employment? Maybe there’s been a reduction of illegal workers which would also explain in part the reduction in productivity?

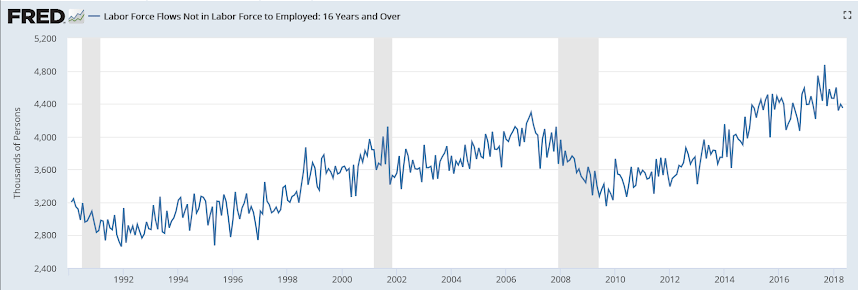
And this chart shows that 4.3 million people took jobs last month who previously were not classified as unemployed and were not even considered as part of the labor force:

Highlights

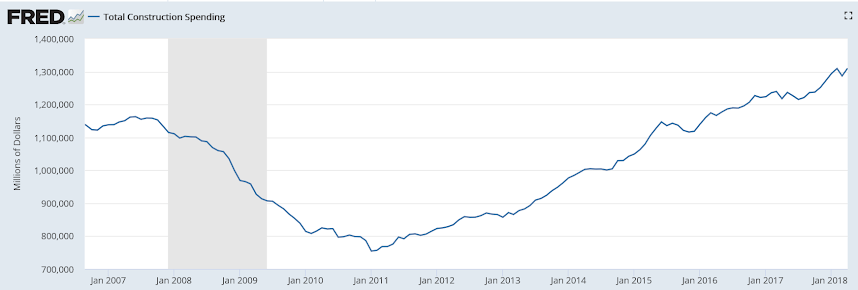
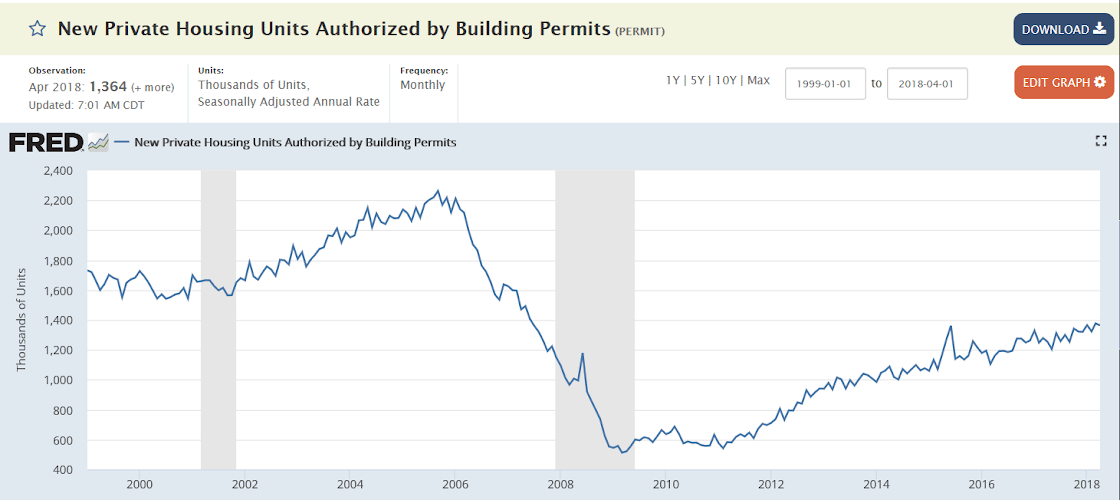
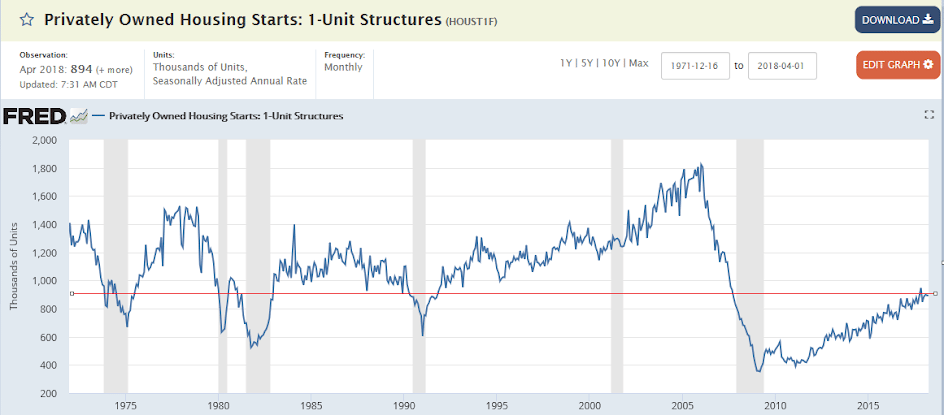
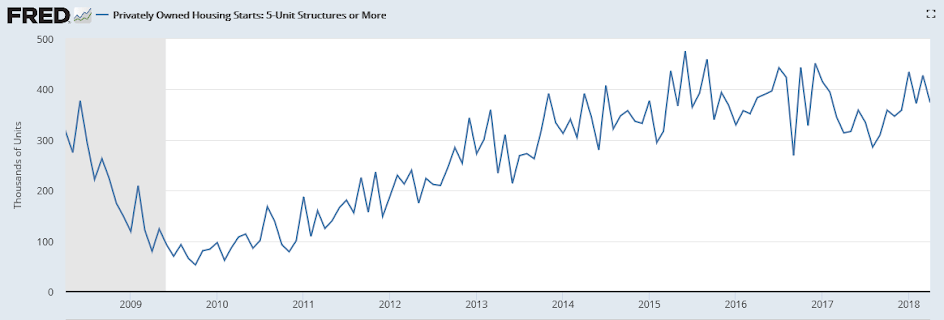
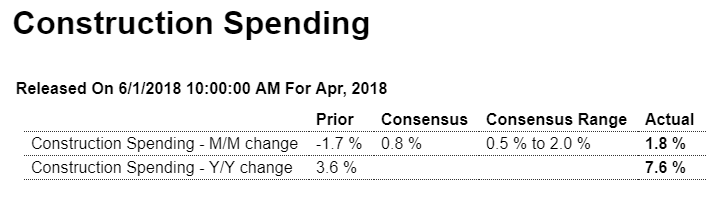
A rebound in multi-family units helped drive construction spending 1.8 percent higher in April to fully reverse the prior month’s 1.7 percent decline. Spending on multi-family units rose 3.6 percent in the month following March’s 4.3 percent decline in a gain, however, that can’t overshadow no change for spending on single-family homes. But home improvements were a big positive rising 0.7 percent in the month.

Non-housing data are mixed with private nonresidential, led by transportation and power, up a strong 0.8 percent but with highways & streets down 1.0 percent.

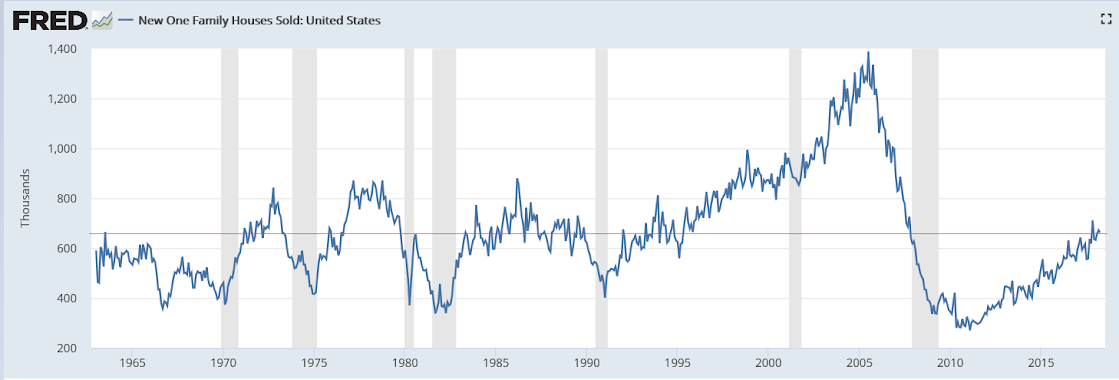
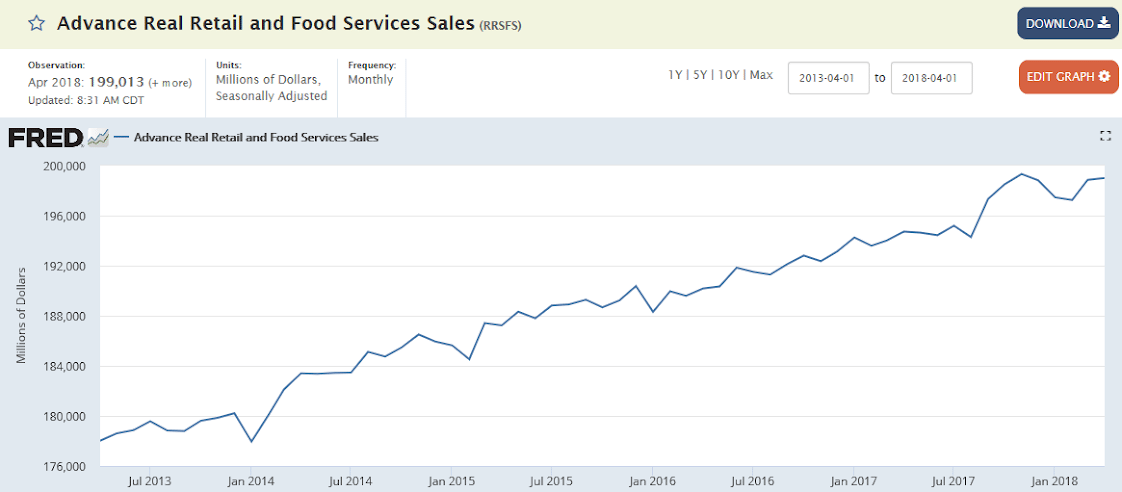
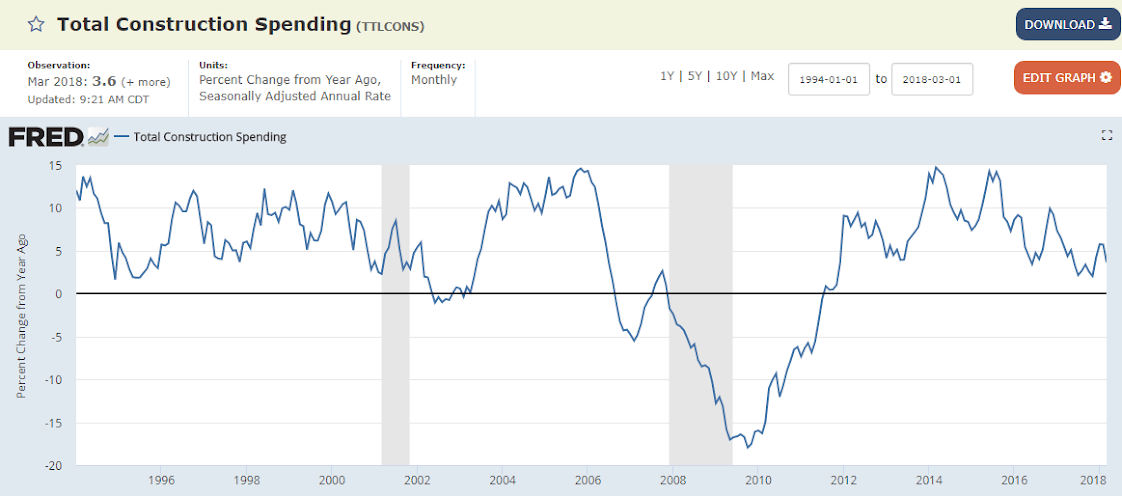
This report is often very volatile making year-on-year readings useful to gauge trends. And there is clear strength here, with total spending up 7.6 percent including a very strong 9.6 percent gain for single-family homes that puts April’s no change in perspective. Housing is in short supply which has been holding down home sales and the question for the sector is whether builders can pick up their pace to meet demand.

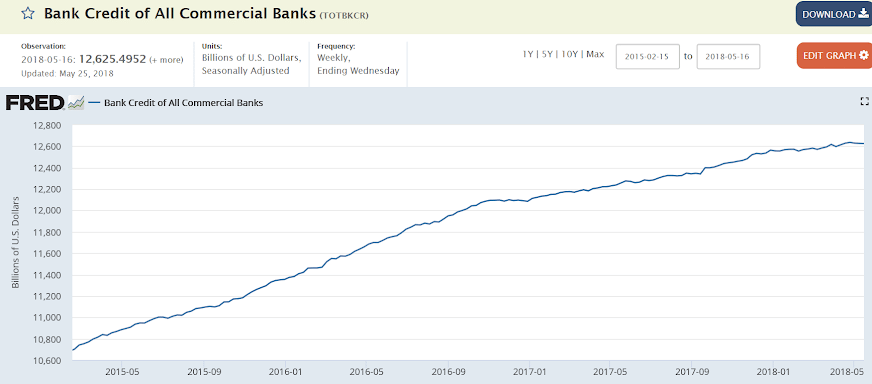
This chart is not adjusted for inflation. On an inflation adjusted basis it’s still short of the prior cycle highs:

Personal income and outlays, Corporate profits, Trade, Bank lending, Corporate debt

Spending was up, but unfortunately due to higher gas prices, which were paid for by further dipping into savings that were already far too low. So looks to me like q2 is off to a very uncertain start after a weak q1:

Highlights

Income isn’t quite as soft and spending isn’t quite as strong as they look while inflation readings are modest and steady. Income rose 0.3 percent in April but the wages & salaries component shows a solid 0.4 percent gain. Spending jumped 0.6 percent in the month led, however, by a 0.9 percent gain for nondurables which reflects April’s rise in gas prices.

Both the overall PCE price index and the core rose 0.2 percent in the month, the latter edging above Econoday’s consensus by 1 tenth, with the year-on-year rates hitting expectations, at 2.0 percent overall and 1.8 percent for the core.

Of note for the core is a revision to March’s year-on-year rate which has been downgraded to 1.8 percent. Also of note is a 2 tenths dip in the savings rate to an even lower 2.8 percent which suggests April’s spending, to a degree, was funded at the expense of savings.

Yet gas-driven or not, the rise in spending marks a strong opening for second-quarter consumer spending and, together with yesterday’s big improvement in April goods trade, are both early indications of strength for second-quarter GDP. More fundamentally, concerns in yesterday’s Beige Book that consumer spending was moderating look perhaps unwarranted and that steady growth, backed by respectable income, is now the more accurate description. For inflation, no alarms in this report with the overall rate holding on target for a second straight month but room still left to run for the core in its awaited approach to the Fed’s 2 percent line. Note that the Fed’s goal is to bring both the overall price index and the core to the 2 percent target and then to hold them there as steady as possible.


While the trade deficit was small than expected, the drop was due to weak US imports, which doesn’t bode well for domestic demand or for foreign economies:

Highlights

Second-quarter net exports open up on the positive side, at a goods deficit of $68.2 billion in April vs $68.6 in March and far better than expectations which were calling for a much deeper $71.0 billion deficit.

But the mix of the results are less favorable as exports of goods fell 0.5 percent to $139.6 billion reflecting sharp slowing for vehicles and also capital goods that offset gains for industrial supplies and especially food products. The import side is more favorable, falling 0.5 percent to $207.8 billion after March’s 1.5 percent decline with consumer goods falling very sharply, down 5.3 percent after March’s 1.7 percent dip.

The decline in exports aside, today’s results are positive and should give a lift to early estimates for second-quarter GDP.

Existing home sales, Durable goods, China debt, State index

More weakness:

Highlights

Yesterday’s new home sales report showed less strength than expected while today’s existing home sales results are outright disappointing. Sales fell 2.5 percent in April to an annualized rate of 5.460 million which falls below Econoday’s low estimate.

The decline in sales came despite a sizable increase in supply on the market, at 1.800 million for a monthly gain of 9.8 percent though the year-on-year rate remains squarely in the negative column at minus 6.3 percent. On a sales basis, supply rose to 4.0 months from 3.5 months.

The median price for a resale rose 3.2 percent in the month to $257,900 which no doubt held down the month’s sales. But the year-on-year rate for the median, in contrast to FHFA or Case-Shiller data which are near 7 percent, is a more moderate 5.3 percent.

All regions were weak in the month especially the Northeast where sales fell 4.4 percent. And only one region, the South, is in the year-on-year plus column and at only 2.2 percent.

Housing got off to a slow start this year and the first indications on the second quarter are not pointing to any acceleration. Housing, like consumer spending, has been unexpectedly flat.

Been near flat for going on three years now:


Ex aircraft better than expected, apparently due to the tariffs. The chart shows modest growth and levels that have not yet exceeded 2008 in real terms:

Highlights

Tariff-related price inflation may be driving up dollar totals in the factory sector which, based on the April advance durable goods report, has gotten off to a very strong start for the second quarter. Forget the 1.7 percent headline decline in the month, one due entirely to an understandable swing lower for what have been very strong aircraft orders. Excluding aircraft and other transportation equipment, durable goods orders rose 0.9 percent to beat Econoday’s consensus by 3 tenths.

Orders for primary metals, where tariffs on steel and aluminum are in effect, jumped 1.3 percent in April on top of March’s giant 4.6 percent surge when tariffs first took effect. Orders for fabricated metals, also affected by tariffs, rose 2.0 percent following March’s 1.2 percent gain. These two components make up more than 20 percent of total durable orders.

Elsewhere, capital goods put in a very strong April showing in what is very auspicious news for second-quarter business investment. Core orders, which exclude aircraft, rose 1.0 percent with core shipments, which are direct inputs into fixed nonresidential investment, up 0.8 percent.

Civilian aircraft orders fell by 36.2 percent but follow March’s 71.7 percent climb. And defense aircraft helped narrow the difference, rising 7.5 percent in the month. Vehicle orders also opened up the second-quarter on a strong note with a 1.8 percent gain.

The factory sector, as has been indicated by the regional reports, is picking up steam and, showing no immediate negatives and possibly positives from tariffs, looks to be an increasing contributor to the 2018 economy. Other details include a third straight strong rise in unfilled orders, up 0.5 percent in April, and a useful 0.3 percent build for inventories.

These numbers are not adjusted for inflation:

China debt crackdown leaves regional institutions short of cash

(Nikkei) China is cutting off funds to financial companies and banks tied to regional governments in a crackdown on risky debt. China’s massive state-owned banks are largely responsible for keeping the interbank market flush. Chinese regional governments that have hit limits on debt issuance have traditionally founded quasi-private companies to handle infrastructure and public works, borrowing as needed. From the beginning of 2018 through last week, financial institutions and companies sold just under 460 billion yuan in securitized products, a drop of 10% from a year earlier.

This chart has been revised by the Fed and now looks very different:

Mtg purchase apps, New home sales, Architecture billing index, China

Weakness continues:

Housing, while growing modestly, remains very depressed historically:

Highlights

Month after month the new home sales report shows its volatility behind which, however, slight strength is evident. Sales in April came in 15,000 short of Econoday’s consensus, at a 662,000 annualized rate with revisions pulling down the prior two months by a total of 30,000. Yet compared to the prior report, when sales beat expectations by 64,000 and when upward revisions added 81,000, today’s report doesn’t reverse what is still an upward slope for new homes.

Yet details are mixed. Price discounting may be underway as the median fell a very steep 6.9 percent in the month to $312,400 for a year-on-year gain of only 0.4 percent. Relative to sales, which are up 11.6 percent year-on-year, prices look like they have room to climb. Supply data are also a concern. New homes on the market rose only 2,000 to 300,000 with supply relative to sales also moving only marginally higher, to 5.4 months from 5.3 months.

Until supply begins to build at a better pace, sales of new home homes will lack acceleration. Residential investment, where new home sales are a major piece, proved flat in the first quarter though improvement in the second quarter, however limited, does look like it’s underway. Watch tomorrow for existing home sales which have been flat and which are expected to remain so.

This chart is not population adjusted:

Permits are also growing very modestly and remain historically depressed. Again, this is not population adjusted:


This has also been historically depressed this cycle;

https://asia.nikkei.com/Economy/China-curbs-infrastructure-spending-as-local-debt-climbs

China curbs infrastructure spending as local debt climbs

BEIJING — China is slamming the brakes on infrastructure investment to reel in soaring local debt, but the move is certain to hurt regions reliant on public works projects, widening the country’s already stark economic gaps.

Infrastructure spending in the January-April period rose 12.4% on the year, 0.6 percentage point lower than the growth marked in the three months ended March, data from China’s National Bureau of Statistics shows. The seemingly strong growth appears less impressive when put in context. The annual increase has been around 20% in recent years. In 2017, when the Communist Party held its twice-a-decade congress, the figure was 19%.

Overall fixed asset investment expanded just 7% in the January-April period, the slowest since 6.3% in 1999.

Retail sales, Mtg apps, Housing starts, Industrial production, Wage growth tracker

Pretty much as expected. These numbers are not adjusted for inflation, which is running around 2%:

Highlights

Consumer spending was weak in the first quarter and the first look at the second quarter is no better than moderate. Total sales rose an as-expected 0.3 percent in April which pretty much tells the story of the month. Vehicle sales, despite a decline in previously reported unit sales, did post a rise of 0.1 percent in the month which is very respectable given the oversized comparison with March when sales jumped 2.1 percent. Gasoline sales rose an outsized 0.8 percent on higher prices in the month and when excluding both vehicles and gas, retail sales matched the 0.3 percent showing at the headline level.

Details throughout the report are mixed: furniture, which offers a reading on housing demand, extended recent strength with a 0.8 percent gain but restaurants, and their indication on discretionary spending, fell 0.3 percent but following a sharp gain in February. Apparel sales, which have been mixed, surged 1.4 percent but sales at department stores, which have been very weak, managed only a 0.2 percent gain. Building materials rose 0.4 percent in another positive sign for residential investment while nonstore retailers, the report’s strongest component, posted a solid 0.6 percent gain.

Control group sales, which are another core measure and a direct input into GDP, rose 0.4 percent which, given the weak comparison in the first quarter, does point to an early lift for second-quarter consumer spending. But the lift is not dramatic especially considering this year’s tax cut, which has raised disposable income, and of course the enormous demand in the labor market. Note that today’s report includes upward revisions to March, up another 2 tenths to 0.8 percent, and a 1 tenth upward revision to February which now stands at unchanged. These revisions will help limit the weakness of consumer spending in the second estimate for first-quarter GDP.

The December spike coincided with a spike in credit card balances, as well as the peak in Bitcoin prices. Seems to have leveled off since then?


From very modest growth to nearly no growth and only about half what it was some 10 years ago:


Looks to me like a serious lack of aggregate demand:

Highlights

Despite headline declines, the housing starts and permits report for April is mostly positive. First the negatives: starts fell 3.7 percent in the month to a lower-than-expected 1.287 million annualized rate while permits fell 1.8 percent to an as-expected 1.352 million rate. The decline for both starts and permits reflects give back from multi-units which fell sharply in April after rising sharply in March.

Steady readings for single-family homes are the positives in today’s data. Starts here posted a 0.1 percent increase to an 894,000 rate while single-family permits, which are the best news in the report, rose 0.9 percent to an 859,000 rate. But not all the single-family news is positive as completions fell 4.0 percent in the month to an 820,000 rate for a decline that is not welcome in a housing market starved of supply.

But behind all the volatility in the numbers is a housing sector that continues to climb at a solid rate, reflected in year-on-year change that shows total starts up 10.5 percent and permits up 7.7 percent.

Slowly climbing back to levels historically seen only in recessions, and these numbers are not population adjusted:


No growth here since oil capex collapsed about 2 1/2 years ago;


Back through the 2015 highs, growing at modest rates;


Led by oil, though oil related capital expenditures aren’t back to where they were:


This more general categories have been going mostly sideways since the oil capex collapse:


Looks to me like a serious lack of aggregate demand:

Macro review, Rig count, Redbook same store sales, Consumer credit, Philly Fed state index, Jolts

There is now growing evidence that the economy’s deceleration that followed the collapse of oil related capital expenditures at the end of 2014 continued for about two years after which it reversed course.

This means the collapse in private sector deficit spending was replaced by other sources of deficit spending, some of it public, the rest private. The increase in private sector deficit spending was apparently not bank financed, as indicated by bank lending statistics, so seems it must have been done in the capital markets.

First quarter weakness, if not reversed in q2, would indicate the contribution of private sector deficit spending is fading, as happened with consumer credit:


The resumption of oil capex is part of the answer:


Note the dip followed by a recovery:


This is not contributing to the apparent reversal:

Highlights

Consumer credit came in on the low side of expectations, up $11.6 billion in March with February revised $3.0 billion higher to $13.6 billion. Revolving credit is once again the weak spot, down $2.6 billion in the month following a $0.5 billion decline in February. Weakness in revolving credit, which includes credit cards, explains at least part of the slowdown in first-quarter consumer spending. Non-revolving credit, which includes both student loans and vehicle loans, rose $14.2 billion in both March and February.


Interesting reversal- historically happens after a recession:

Employment, Durable goods, Bank loans, Collections index, China phone sales

  • Economic intuitive sectors of employment were mixed with truck transport contracting.
  • This month’s report internals (comparing household to establishment data sets) was inconsistent with the household survey showing seasonally adjusted employment expanding only 3,000 vs the headline establishment number expanding 164,000. The point here is that part of the headlines are from the household survey (such as the unemployment rate) and part is from the establishment survey (job growth). From a survey control point of view – the common element is jobs growth – and if they do not match, your confidence in either survey is diminished. [note that the household survey includes ALL jobs growth, not just non-farm).
  • The household survey removed 236,000 people to the labor force.

  • Growing modestly but on an inflation adjusted basis still well below 2008 levels:


    Total bank credit growth abruptly slowed in 2016 around election time and has yet to pick up:


    C and I loan growth picked up a bit recently but is still way down from prior rates of growth:

    Some of the decline can be blamed on the Chinese Lunar New Year. The holiday cut into smartphone production. As a result, on a sequential basis, shipments declined 34% from the fourth quarter of last year. Since the fourth quarter includes the holiday shopping season, that decline might not be as ominous as the 13.4% drop year-over-year. Chinese shipments as a percentage of the total number of Q1 global smartphone deliveries dropped under 30%.

    ADP employment, Light vehicle sales

    Auto sales continue to slow:

    The BEA released their estimate of April vehicle sales this morning. The BEA estimated sales of 17.07 million SAAR in April 2018 (Seasonally Adjusted Annual Rate), down 1.7% from the March sales rate, and up slightly from April 2017.
    Read more at http://www.calculatedriskblog.com/#kXZuxyjWLR2MW4ME.99


    Light truck sales were slowing until getting a boost from the hurricanes:

    GDP, Bank lending, Construction spending, Capital investment, Emerging market debt, Smartphone exports

    As previously discussed, something has to give to bring the savings rate inline, and the low reported personal consumption expenditures are a step in that direction, and housing has also been soft, as were prices. Also, while inventory building adds to GDP, combined with slower sales growth it doesn’t bode well for the future:

    Highlights

    A sharp rise in service spending helped keep first-quarter GDP in the respectable range, at an annualized 2.3 percent rate and 3 tenths above Econoday’s consensus. Service spending contributed nearly 1 full point to the result and offset a sharp decline in spending on durables. Consumer spending in total rose at a 1.1 percent pace, subdued but still positive.

    Business spending also helped the quarter, contributing 8 tenths of a point with strength here including both structures and equipment. But residential investment, after spiking in the fourth quarter, couldn’t pull its weight and contributed zero to the latest quarter.

    Inventories, which had been too low relative to demand, are a welcome positive in the report, rising $33.1 billion and adding 4 tenths to the quarter. Imports are once again the biggest negative, subtracting 4 tenths in a quarter that marked the imposition of metal tariffs. But in more than an offset, exports rose 0.6 percent to make for a 6 tenths positive contribution from net exports. Government purchases are also a positive, adding 2 tenths.

    Price readings are a negative surprise in the report, with the chain-weight GDP price index rising at only a 2.0 percent rate which is well short of expectations for 2.4 percent.

    It was a moderate quarter for the economy especially for the consumer whose spirits waned a bit despite the big tax cut and continuing strength in the labor market. As for spending, given the moderate gains for services in February and January, the strength in this component in today’s report implies a sharp gain for services in Monday’s personal income & outlays report which will unbundle March’s contributions to the quarter. Also note the decline in durable spending largely reflects the quarter’s soft showing for vehicle sales which however did show promise going into April with the first indication on second-quarter consumer spending coming from next week’s unit vehicle sales results.


    Growth has stabilized after dropping by about 4.5% which is about $570 billion per year or about 3% of GDP per year:


    Last month revised up, but this month down that much and more, indicating q1 was weaker than first reported:

    Highlights

    Construction spending data are known for their volatility which should limit the surprise from a very unexpected 1.7 percent decline in March, far below Econoday’s consensus range. The housing sector is the weakness in the report with residential spending down 3.5 percent in the month including dips for both single-family homes, down 0.4 percent, and multi-units, down 2.7 percent. Home improvements, which have been soft, fell 8.0 percent in the month.

    But the minus signs don’t stop here with private non-residential spending, held down by continuing weakness in factory spending and a monthly downturn for commercial spending, falling 0.4 percent in the month. Spending on public building is mixed with highways & streets showing a gain offset by a flat result for educational building.

    Today’s data are a surprise for forecasters but are offset by a heavy upward revision to February, now at plus 1.0 percent from an initial 0.1 percent gain, and may paradoxically build up expectations for a construction rebound in coming reports. Watch for housing comments in tomorrow’s FOMC statement and also construction payrolls, which have been strong, in Friday’s employment report.

    Another chart that indicates we could already be in recession:


    Yet another source of credit growth for 2017 I hadn’t seen:


    Smartphone sales have been a substantial source of US GDP growth: