ISM, Canada

US service sector continues its rapid deceleration:

Seems about the same everywhere- imports and exports both down:

Canada’s trade surplus decreased to CAD 0.14 billion in June 2019 from a downwardly revised CAD 0.56 billion in the previous month and against market expectations of a CAD 0.3 billion gap. It was the third trade surplus since December 2016, as exports were down 5.1 percent, while imports fell at a softer 4.3 percent, both due in part to significant decreases in crude oil, as well as aircraft and other transportation equipment and parts. Balance of Trade in Canada averaged 1281.20 CAD Million from 1971 until 2019, reaching an all time high of 8524.80 CAD Million in January of 2001 and a record low of -4962 CAD Million in December of 2018.

Employment, Factory orders, Trade, Construction

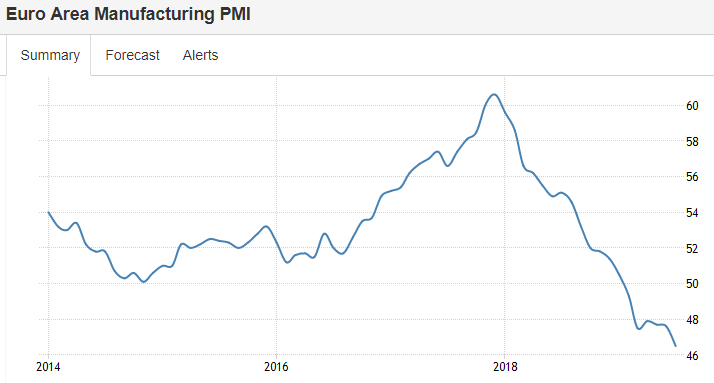
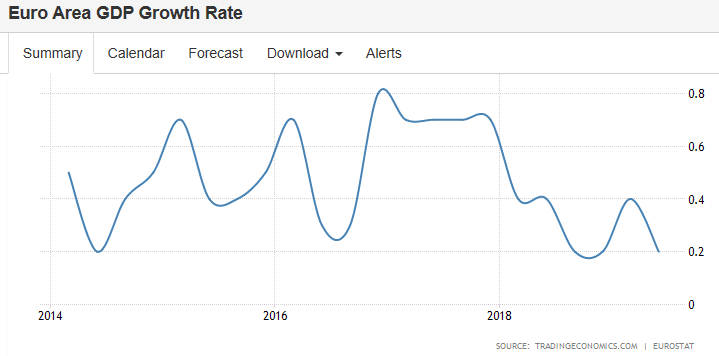
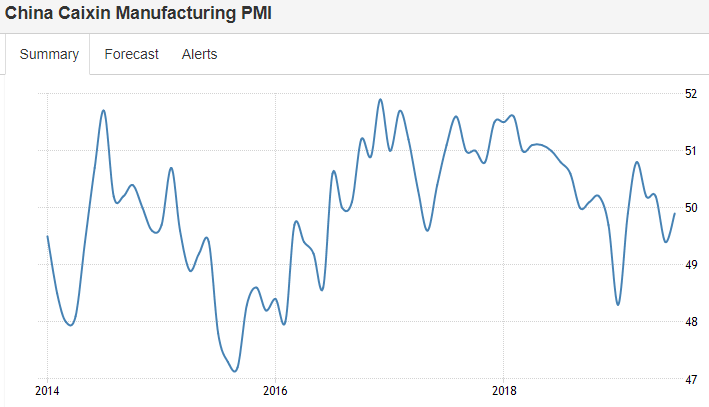
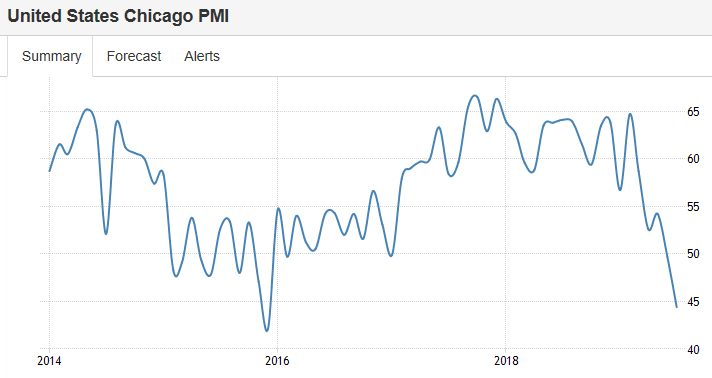
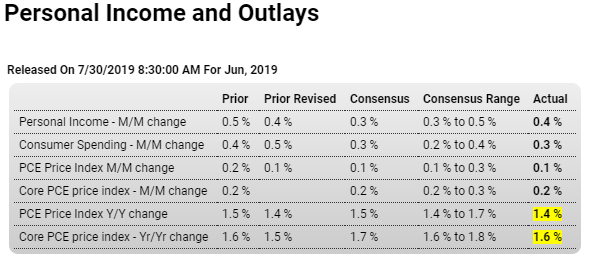
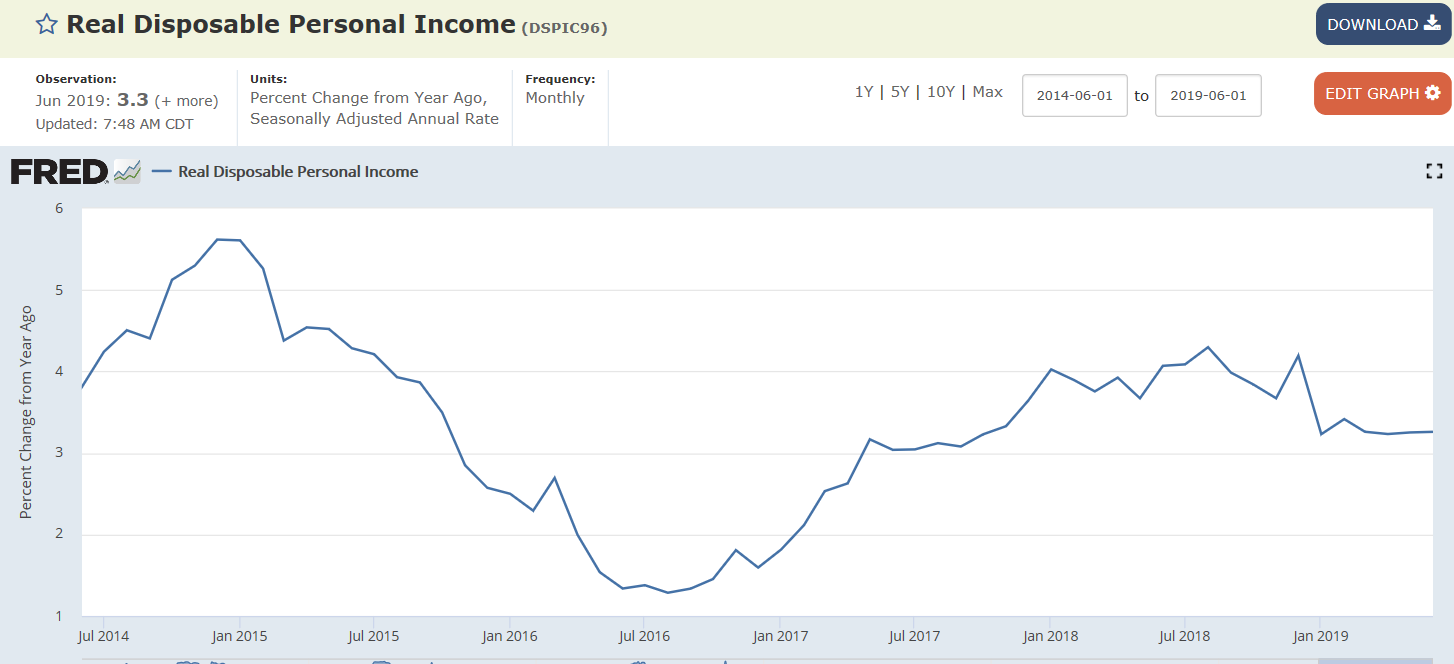
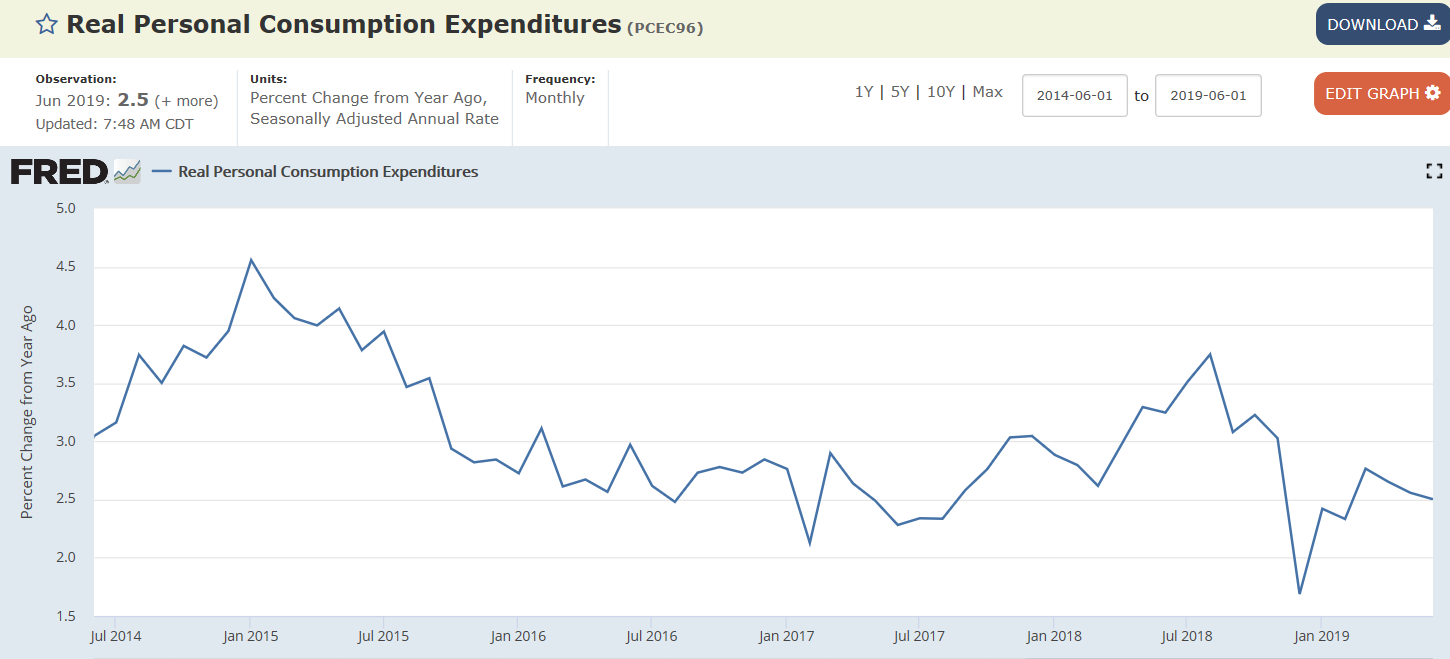
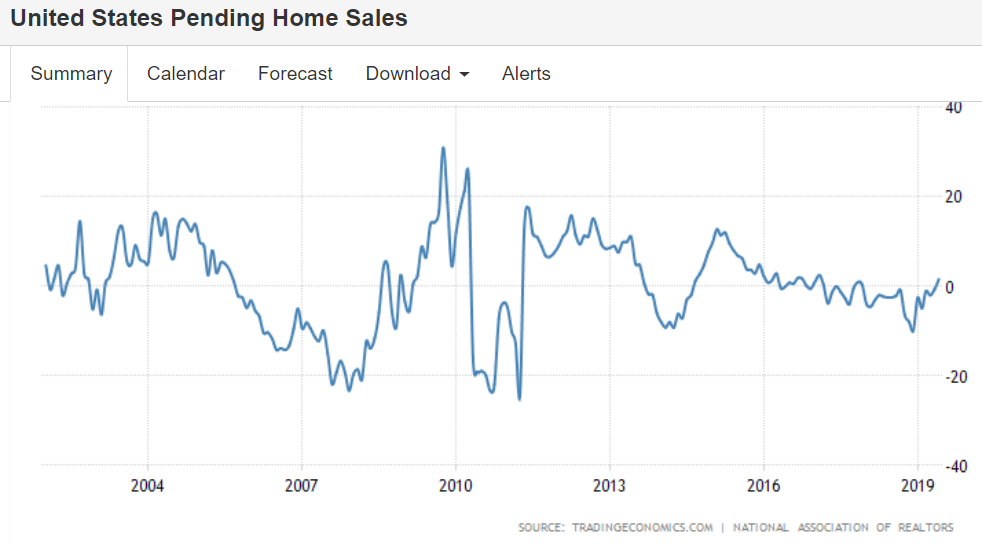
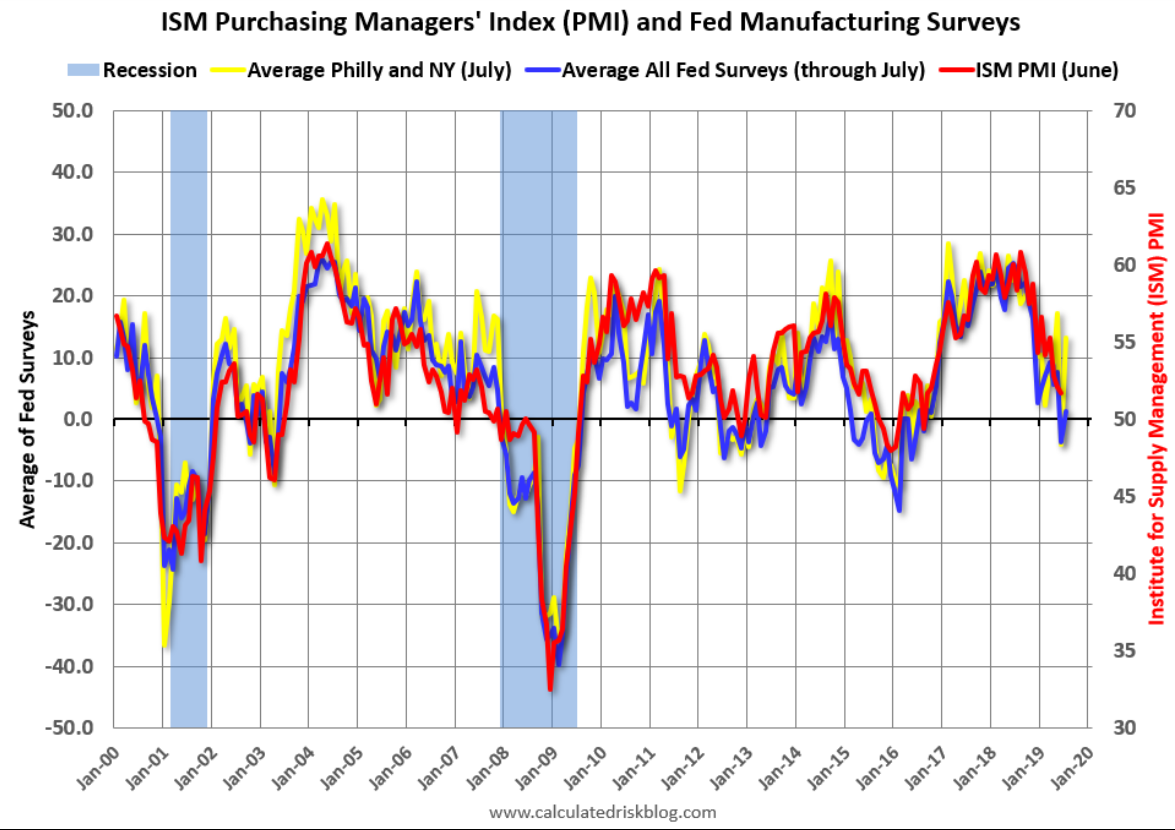
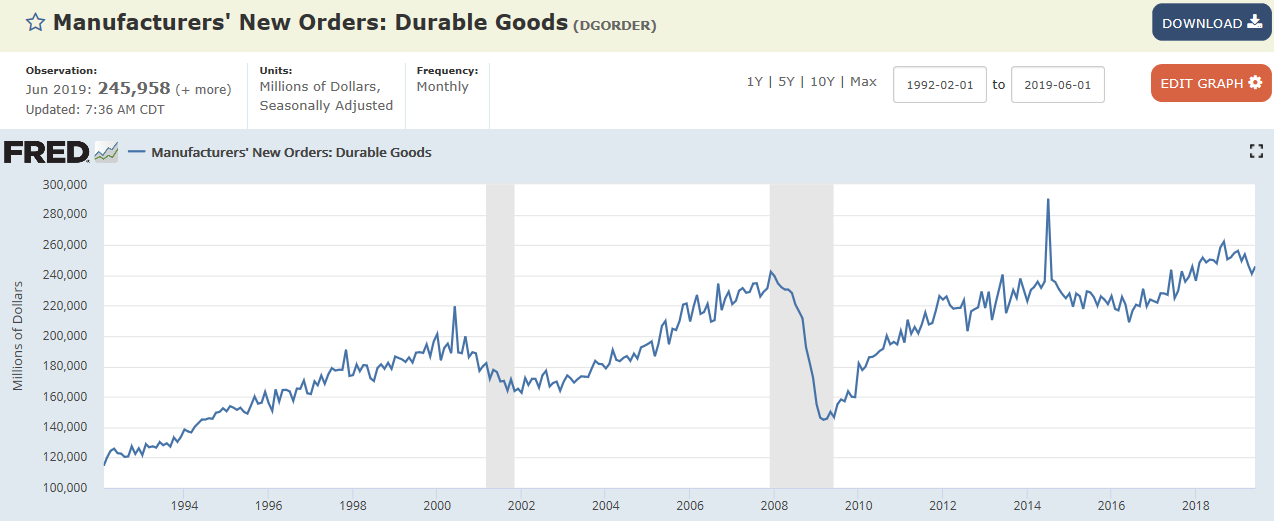
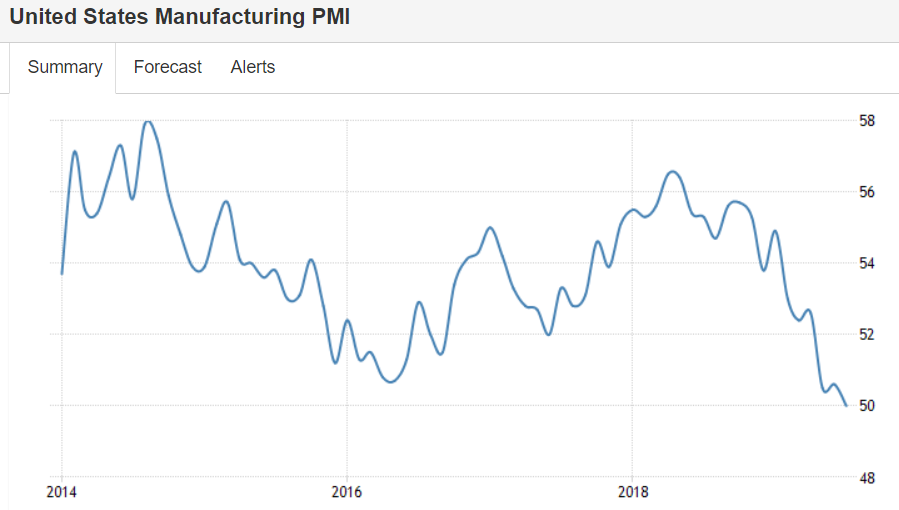
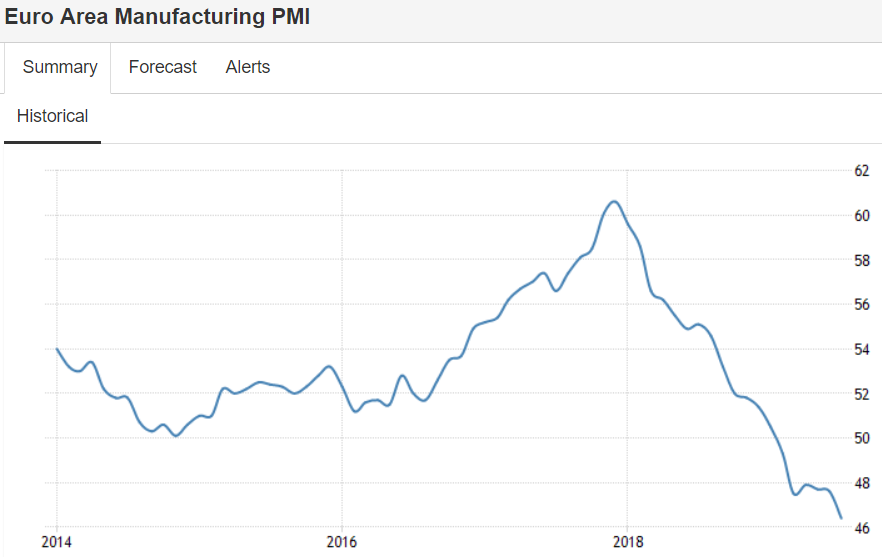
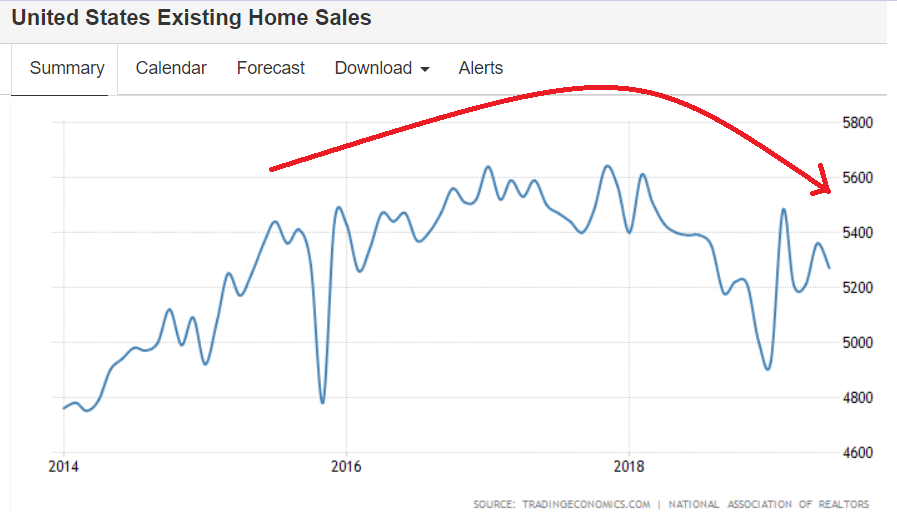
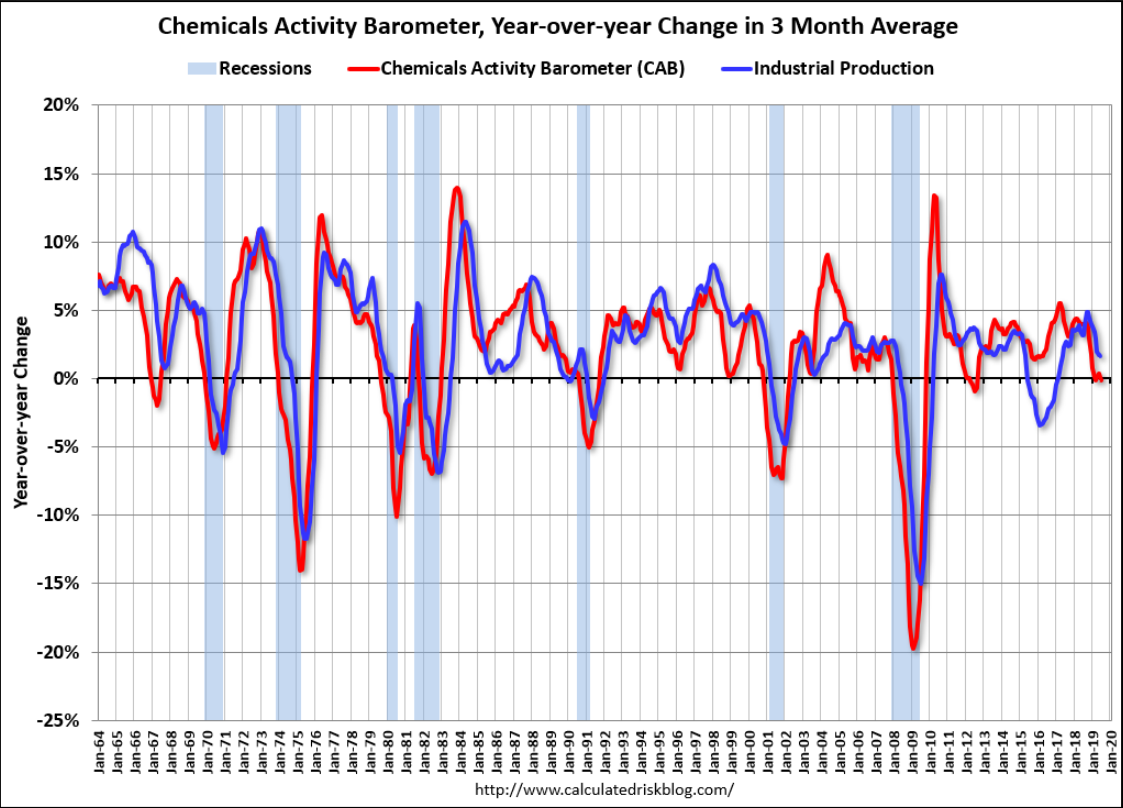
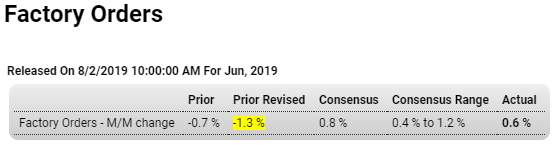
Deceleration continues- see chart:

Highlights

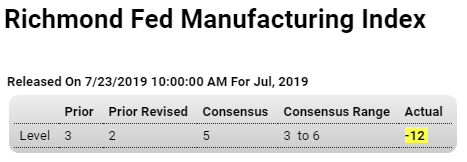
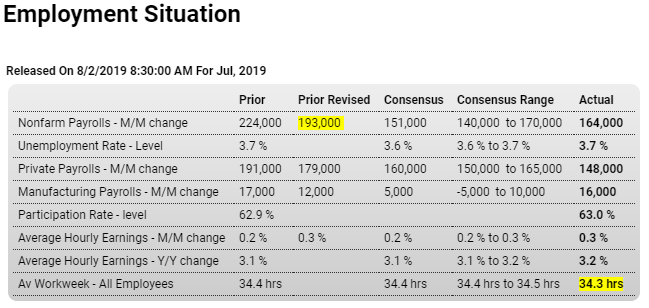
How far along the rate-cut path will the Fed go? Maybe a bit further given a middling employment report where an important detail is pointing to big trouble for the next industrial production report. First the headlines as nonfarm payroll rose 164,000 which is actually 13,000 above Econoday’s consensus for 151,000. But much of the strength came for a second month from government payrolls which, reflecting the heavy government spending that’s underway, rose 16,000 to top June’s 14,000 rise. Private payrolls, which exclude government payrolls, rose 148,000 which, in contrast to the nonfarm headline, is 12,000 under Econoday’s consensus.

But a key detail is a decline in manufacturing hours, at 40.4 hours in the weeks and down from 40.7 hours in June, with manufacturing overtime also down, at 3.2 hours from 3.4 hours. These are inputs into the manufacturing component of the July industrial production report and point to a quick reversal from June’s strength, one that would no doubt focus new attention on the weakness of the sector and the effects of slowing global trade.

Yet wage pressures may be dulling at least some of the Fed’s stimulus bias, especially for the two FOMC members who voted against Wednesday’s rate cut. Average hourly earnings rose 0.3 percent which is at the top-end of Econoday’s consensus range while June’s rise is revised 1 tenth higher and now also stands at 0.3 percent. Year-on-year, earnings rose 1 tenth to 3.2 percent and though moving upward in the month have been higher, at 3.4 percent back in February this year.

Even if wages aren’t rising that much, the availability of labor does show some tightening. The unemployment rate held steady at a very low 3.7 percent but the participation rate did rise 1 tenth to 63.0 percent. The pool of available workers fell nearly 200,000 in the month to 11.1 million.

Turning back to payrolls, manufacturing posted a strong gain of 16,000 which easily tops the consensus range even if the hours in the sector fell in the month. Payroll gainers aren’t eye popping but do include a second straight 38,000 rise for business services which points to demand for contractors and temporary workers, as well as an 18,000 rise for financial activities. On the downside is yet again retail which fell 4,000 in the month to extend its very severe contraction.

Manufacturing is the focus right now and today’s report points squarely at an unfavorable reading for the sector in the next industrial production report which will be posted Thursday, August 15. Otherwise today’s report is mixed showing a solid and sustainable pace for overall payroll growth fed in part by government workers and incremental but not excessive tightening in labor conditions.


Lower than expected and downward revisions:

Highlights

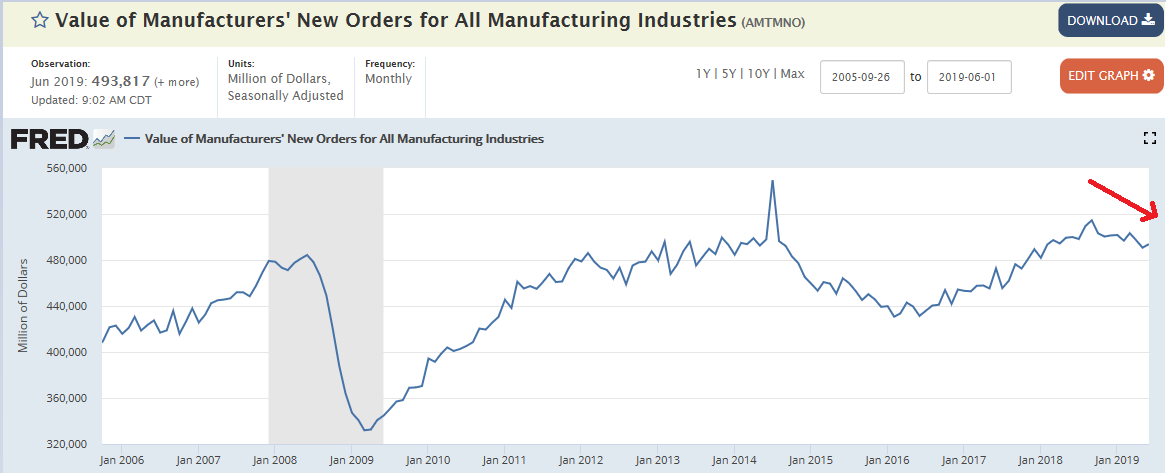
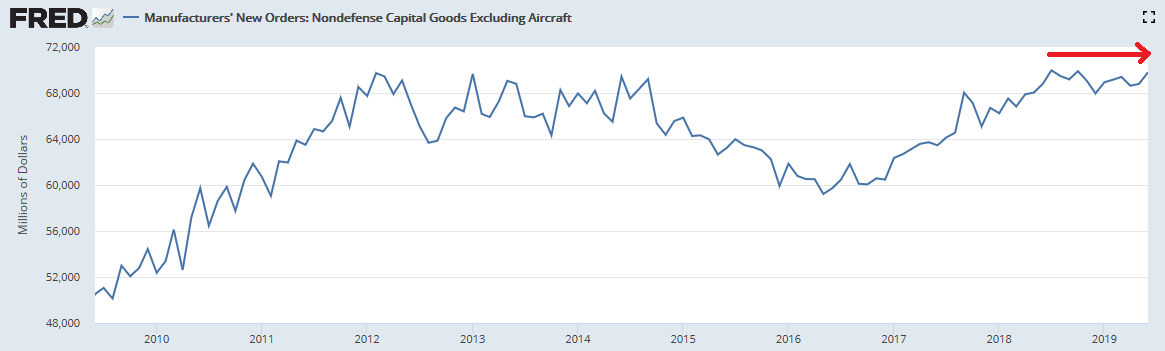
Capital goods that surged in last week’s advance data are revised down a bit in the factory orders report, limiting June’s monthly headline increase to 0.6 percent which is inside of Econoday’s consensus range but misses the consensus by 2 tenths. New orders for core capital goods (nondefense ex-aircraft) are trimmed back 4 tenths to what is still a very strong 1.5 percent monthly gain in June. May is also trimmed back, by 1 tenth to 0.2 percent. Shipments for this category, which are inputs into GDP business investment, are also trimmed back several tenths over June and May to gains of 0.3 and 0.4 percent.

Orders for nondurable goods are the fresh data in today’s report and, pulled down by the effects of lower oil as well as coal prices, fell 0.5 percent in June following a 0.3 percent dip in May. The second estimate for June’s durable goods orders is shaved 1 tenth to a 1.9 percent gain, a very strong showing boosted by capital goods.

Inventories rose a thin 0.2 percent for a third straight month to pull the inventory-to-shipment ratio down to 1.37 from 1.38. If manufacturing is slowing, and year-on-year total new orders in June were down 1.2 percent, at least inventories are being kept in check.

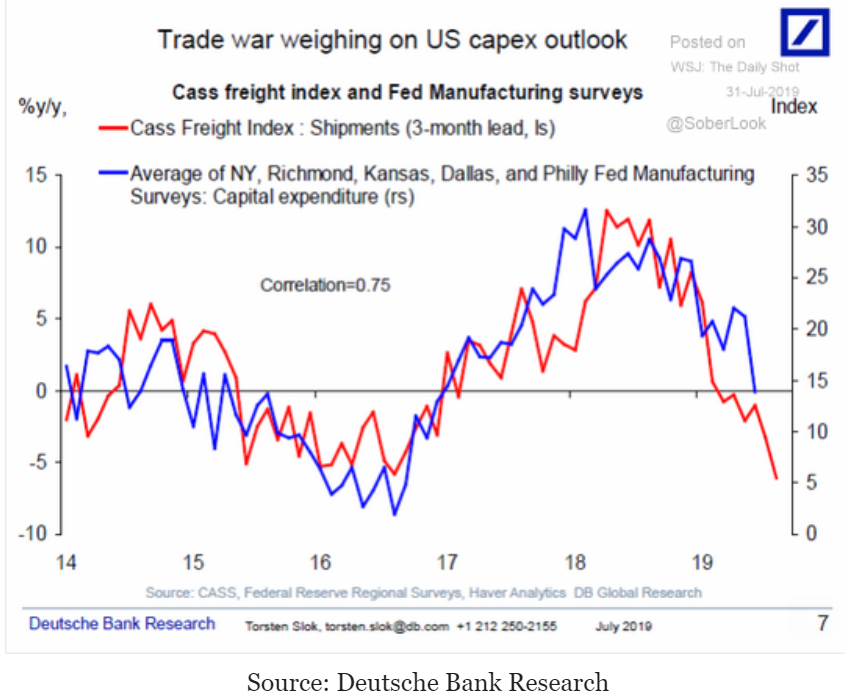
Capital goods orders had been softening and duly raising concern at the Federal Reserve over the health of business investment; June’s jump does not fit into this pattern. If strength continues to appear in this reading, then a central concern for the Fed and its policy shift will be less pressing.

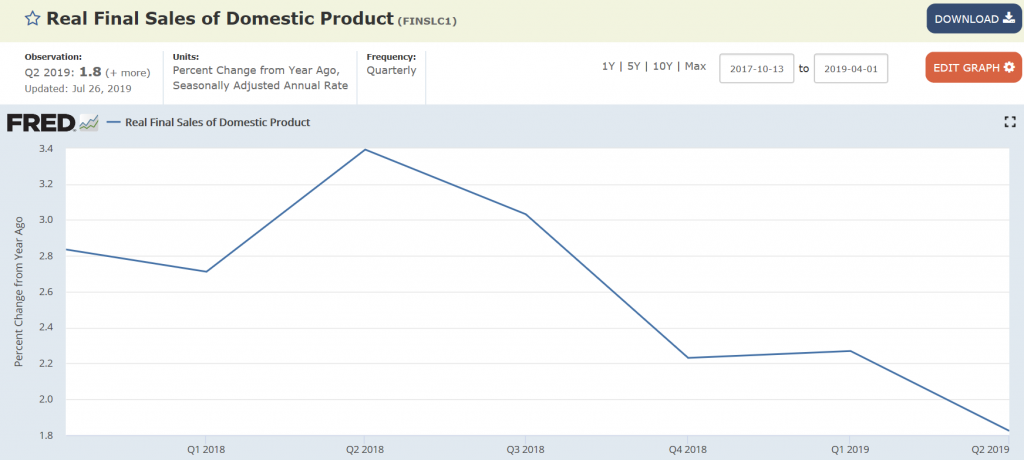
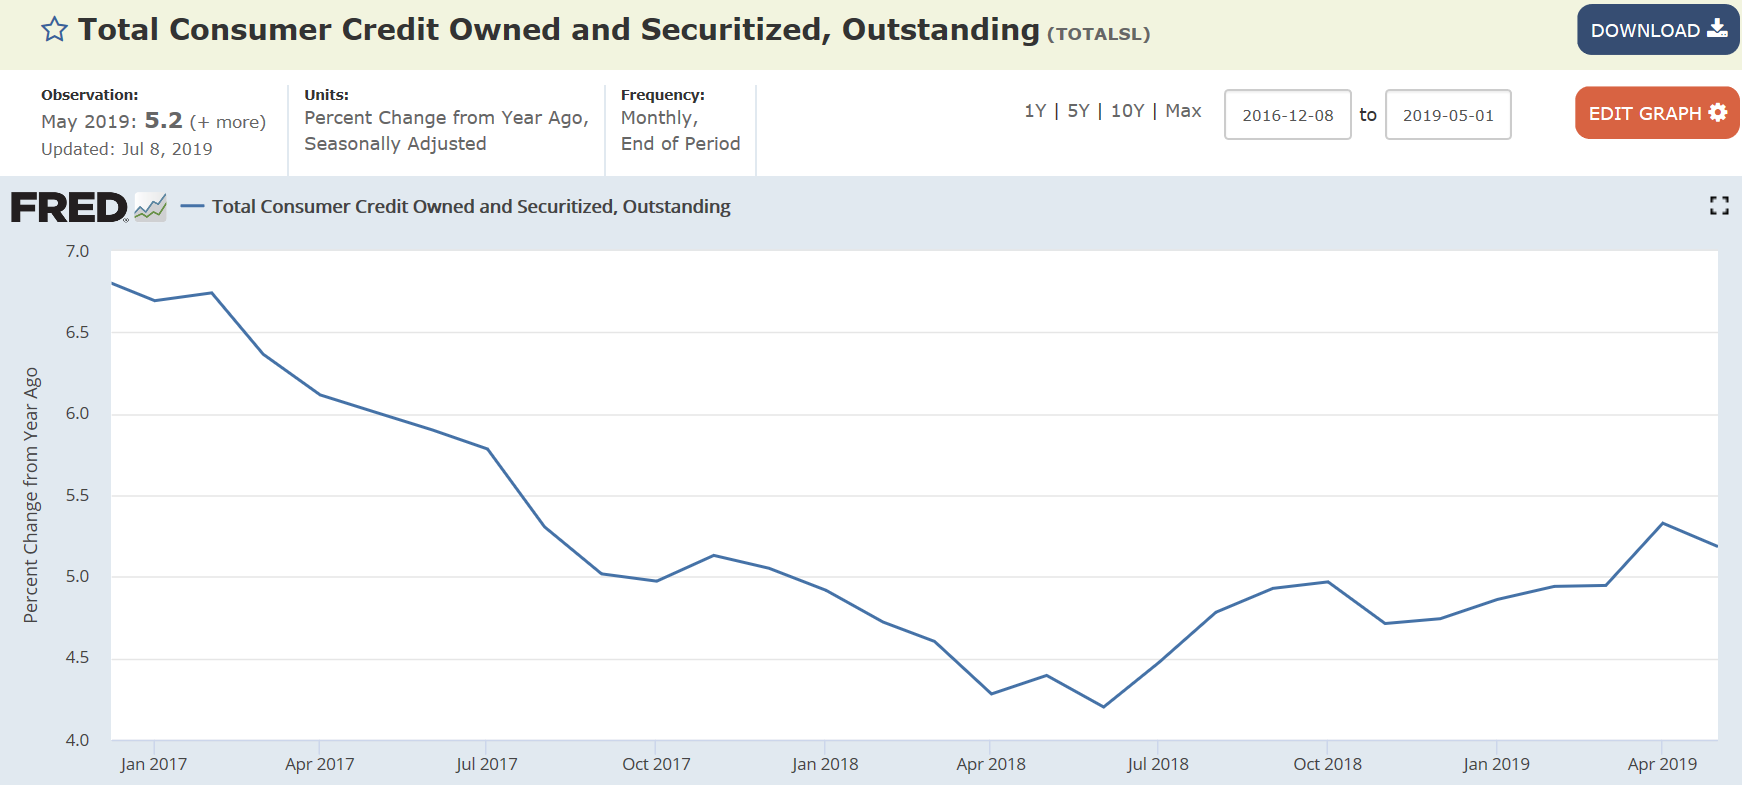
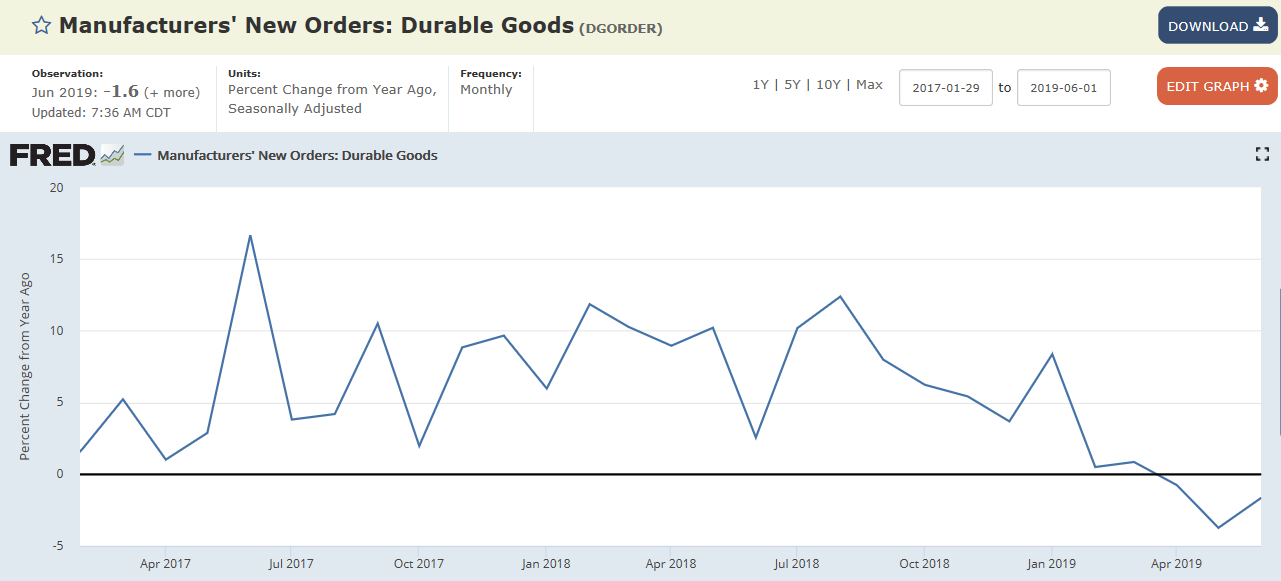
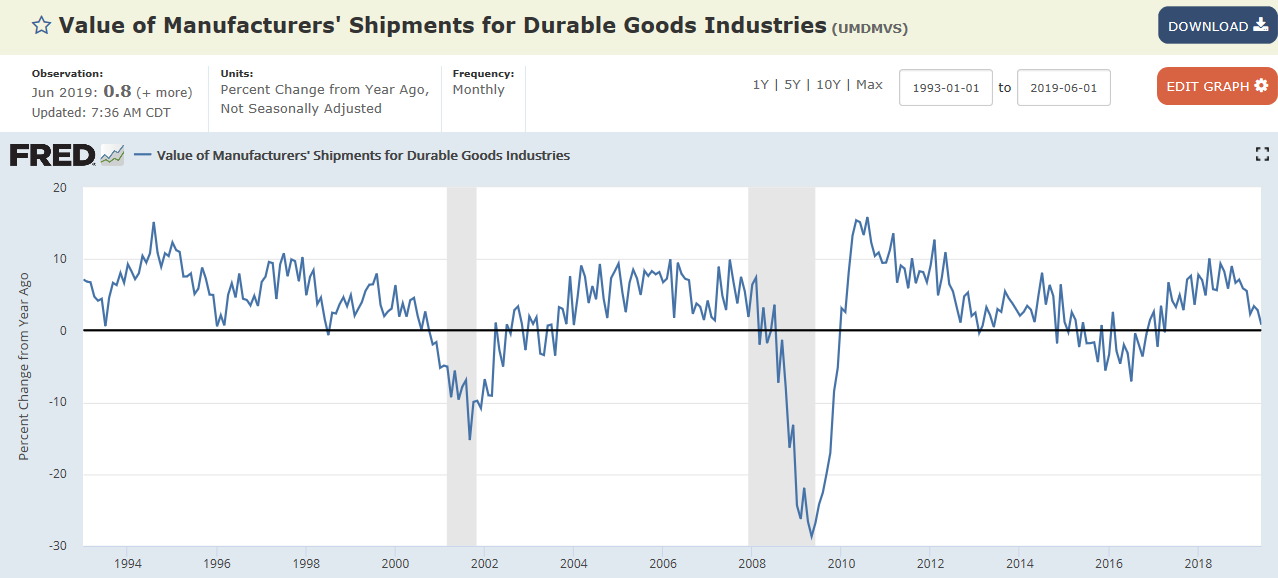
Continuing deceleration, no growth in orders or shipments:


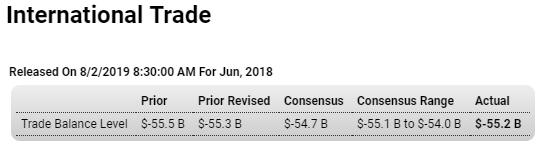
Imports and exports contracting as the global trade collapse continues:

Highlights

June was a very soft month for US trade and though the month’s headline does show marginal improvement from May, at an adjusted deficit of $55.2 billion versus a revised $55.3 billion, both imports and exports contracted, down a monthly 1.7 percent and 2.1 percent respectively.

And not only did goods exports fall, down 2.8 percent to $137.1 billion, but services exports which are usually solid also fell, down 0.7 percent in the month to $69.2 billion. Imports of goods fell 2.2 percent to $212.3 billion with imports of services up 0.2 percent to $49.2 billion.

Turning to details on goods, the deficit with China in June was $30.0 billion versus May’s $30.2 billion in country data that may be unadjusted but are still indicative of a deep and persistent bilateral deficit. The deficit with Mexico also remains very deep, at $9.9 billion from May’s $9.6 billion.

By categories, exports of consumer goods were the weakest posting a $1.9 billion monthly decline in adjusted data to $16.2 billion with exports of capital goods, despite a welcome rise of $0.6 billion in civilian aircraft exports, down $1.2 billion to $44.9 billion. Exports of agricultural products rose slightly in the month to $12.1 billion. On the import side, oil price effects made for a $3.2 billion decline in industrial supplies while consumer goods, the heaviest category for imports, fell $0.9 billion to a still steep $54.7 billion.

June’s trade report edges the trade debate deeper on the troubled side, but only slightly. Yet if the pattern continues and both exports and imports contract, the Federal Reserve’s concerns over the effects of slowing global trade, expressed by this week’s rate cut, will look more and more justified.
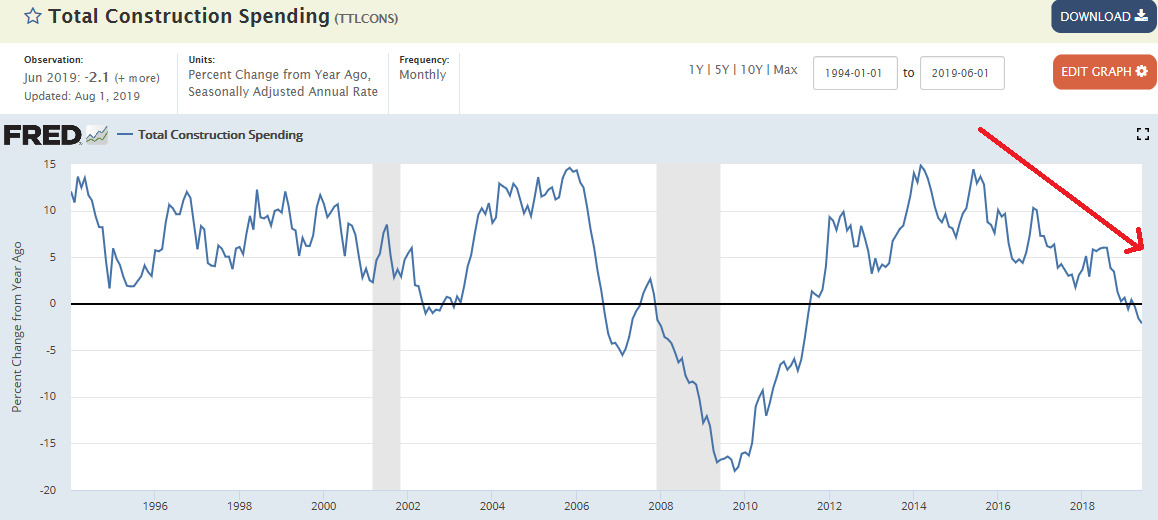
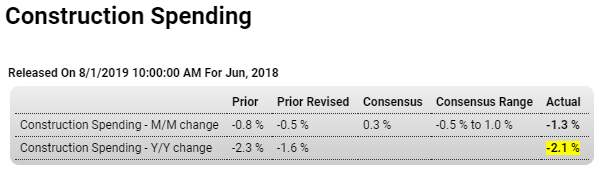

In contraction:

Highlights

The construction sector has been a stubborn disappointment all year, failing to show much life despite strong conditions in the domestic economy and favorable financing rates. Construction spending in June fell 1.3 percent to miss the low end of the Econoday’s consensus range. Year-on-year, spending is down 2.1 percent.

The one positive for the sector has been public spending which, however, fell sharply in June for both educational building and highways & streets. Yet year-on-year, both of these categories are still rising at solid mid-single digit rates reflecting what are strong yearly increases in state & local spending of 5.9 percent and federal spending of 9.7 percent.

When turning to data on the private side of construction the story changes. Private nonresidential construction is down 0.4 percent on the year and June was another soft month with the transportation and power sectors both lower. Manufacturing is showing some life, up in the month and up 10.5 percent year-on-year while commercial building did improve in June but is still down 12.0 percent on the year.

The worst news in the report continues to come from the residential sector where spending is down 8.1 percent from June last year. This despite strong gains in multi-family construction which are being offset by contraction in single-family construction, falling 0.7 percent on the month and down 8.5 percent on the year. And home improvements have likewise been weak, down again in the month and for yearly contraction of 5.1 percent.

This report brings up questions of possible contraction in foreign investment in US real estate and whether construction, like manufacturing, is being pulled down by global slowing and related tariff effects. Watch for construction payrolls in tomorrow’s employment report for the first indication on July conditions in the sector.

ADP, Chicago PMI, Buy backs, Domestic product sales

Rolling over:

Highlights

ADP estimates that private payroll growth in Friday’s employment report for July will rise 156,000. Econoday’s consensus for this estimate was 155,000 and forecasters see actual private payrolls coming in at 160,000 in Friday’s report vs 191,000 in June.

Highlights

In the lowest reading in 4-1/2 years, the Chicago PMI fell 5.3 points in July to 44.4. New orders sank deeper into contraction with employment falling into contraction for the first time in nearly two years and to its deepest level of contraction in nearly 10 years. Production is also at a 10-year low and given the indications on new orders, may weaken further in the reports to come. This sample was flying high as recently as February this year, holding for a year-and-a-half in the mid-60s area. Though conclusions are difficult to draw based on uncertainties over the make-up and size of Chicago’s sample, the drop in this report could reflect trade-tension issues.

Companies are ramping up share buybacks, and they’re increasingly using debt to do so

  • Share buybacks are expected to approach $1 trillion this year, according to Goldman Sachs.
  • Funding is coming from a record drawdown in cash as well as a rise in gross debt and leverage.
  • Buybacks have exceded free cash flow for the first time since the financial crisis.
  • U.S. companies are on pace to break another record for share repurchases in 2019, using a combination of cash and debt to push the total to close to $1 trillion.

    For the first time since the financial crisis, companies have given back more to shareholders than they are making in cash net of capital expenditures and interest payments, or free cash flow, according to Goldman Sachs calculations.

    The level of buybacks to free cash flow hit 104% for the 12 months ending in the first quarter of 2019, the first time that number has topped 100% during…

    Some of the GDP charts the Fed is looking at:


    The red line is an approximation for stall speed:

    Personal income and consumption, Home prices, Pending home sales, Oil capex, Euro area

    Income and consumption is growing at lower but moderate pace, but has been decelerating since the tariffs started to bite and global trade began its collapse:

    Highlights

    The month-to-month breakdown of consumer spending shows slowing in what will offer support for those on the FOMC who want to cut interest rates this week. Despite the strength of June retail sales, total consumer spending in the month rose only 0.3 percent following gains of 0.5 percent in May and 0.6 percent in April. Spending on both goods and also services shows this similar pattern.

    Monthly data on income and also core inflation are steady in the monthly sequences, at 0.4 percent for April through June on income and at 0.2 percent each month for core PCE inflation (ex-food ex-energy). The year-on-year rate for the core did tick 1 tenth higher in June to 1.6 percent in a gain that moves the curve in the right direction and incrementally toward the Fed’s 2 percent target but one that follows a 1 tenth downward revision to May which is now 1.5 percent.

    Turning back to income, the wages & salaries component jumped 0.5 percent in June but follows very low monthly gains in May and April of 0.2 and 0.1 percent. Yet the consumer’s finances look solid with the savings rate up 1 tenth to 8.1 percent.

    The Fed’s assessment of the consumer has to remain very favorable given the strength of income and spending though the slowing for the latter in June will give policy makers some cover for a rate cut. Providing the most cover, however, is core inflation which is under target and which suggests that an increase in demand would be sustainable. But there is a little gem for the hawks and that’s the monthly gain for the core which, at an unrounded 0.247 percent, just missed coming in at 0.3 percent.


    This kind of weakness and deceleration is not a good sign for the economy:


    Gone negative:

    Looks like the price of oil hasn’t been high enough for capex to grow:

    The BEA has released the underlying details for the Q2 initial GDP report.
    The BEA reported that investment in non-residential structures decreased at a 10.6% annual pace in Q2.
    Investment in petroleum and natural gas exploration decreased in Q2 compared to Q2, and was down 8% year-over-year, but has increased substantially over the last two years.

    GDI, Productivity, China pmi, Dallas Fed

    Gross domestic income was just revised higher. The blue bars are the previously reported levels and the red bars are the revised levels. This further meant that the savings rate unspent income) was higher as previously discussed. And an increasing savings rate generally reflects a deceleration in borrowing:


    Lack of aggregate demand- desires to not spend income not being sufficiently ‘offset’ by’ private or public sector net (deficit) spending:


    I see deceleration in both, just less so in services:

    Highlights

    Texas manufacturing activity bounced back but not as much expected in July, with the general business activity index rebounding by 5.8 points from June’s three-year low though remaining in contraction at minus 6.3. The production index also improved slightly, rising 0.4 points to 9.3, indicating factory output growth at roughly the same pace as in June.

    The survey’s demand indicators were mixed but mostly stronger, however. Showing acceleration were new orders, which rose 1.8 points to 5.5 in an extension of June’s improvement, and moving out of contraction the growth rate of orders rose 8 points to 2.7. Shipments rebounded strongly by 8.5 points to 10.2, and capacity utilization rose to 1.6 points to 11.2. But unfilled orders did fall 6.2 points to minus 2.8 and delivery times fell 4.3 points to minus 4.8. Inventories of finished goods fell another 4.5 points to minus 10.6.

    employment measures bounced back strongly after slipping previously, with the employment index rising 7.2 points to 16.0, well above the long-term average. Hours worked rose 1.9 points to 6.6, while wages slightly dipped by 1.6 points to a still strong 20.1.

    Also pointing to strength ahead, capital expenditures rose sharply after falling to two-year lows previously, rising 8.3 points to 15.2.

    On the inflation front, manufacturers saw upward pressures remaining about the same for raw materials input costs, with the index edging up 0.6 points 17.0, much stronger than for prices received, where price growth was down 2.9 points to minus 1.7.

    Expectations for future business conditions improved, though remaining well below average, with expected general activity returning into positive territory by rising 8.7 points to 6.0 and the company outlook rising 5.5 points to 9.1.

    Today’s report shows Texas manufacturing recovering in July from June’s slide more strongly than the headline suggests, and will probably not strengthen the case for more accommodation by the Fed.

    Dallas Fed: “Texas Manufacturing Continues Moderate Expansion”

    The general business activity index rose six points but remained in negative territory for a third month in a row, coming in at -6.3. The company outlook index rose five points to -0.9, with the near-zero reading indicating that the share of firms noting a worsened outlook roughly equaled the share noting an improved outlook. The index measuring uncertainty regarding companies’ outlooks retreated 12 points from its June peak, coming in at 9.7.

    This is what the Fed is looking at- a steep deceleration after tariffs were announced:

    Durable goods, KC Fed, Mtg purchase apps, New home sales, US and euro area PMI’s, Trump quote

    Year over year in contraction. And the chart is not adjusted for inflation:

    Negative:


    Lower rates don’t seem to be helping:

    Highlights

    The purchase index continues to pull back in what is an unfavorable indication for underlying home sales. After falling 4.0 percent in the prior week, the index fell 2.0 percent in the July 19 week to pull down year-on-year growth to 6.0 percent. Refinancing activity has also been coming down, 2.0 percent lower in the week. Rates fell back in the week, down 4 basis points to 4.08 percent for conventional 30-year loans.

    Still rolling over from what are already historically depressed levels, with tariffs now widely mentioned:

    Highlights

    The housing trend is visibly fading at the half-way point, opening the year on a solid rise before flattening out and slowing in May and June. This is true of existing home sales which were reported yesterday and is especially true with today’s report on new home sales which came in at a lower-than-expected 646,000 annual rate. The 3-month average is at 636,000 which compares unfavorably against a 673,000 peak in April.

    The median price firmed in June to $310,400 but is no better than dead flat versus June last year. Supply edged higher to 338,000 new homes on the market and on a sales basis is at an ample 6.3 months. Sales jumped in the West, edged higher in the South, and slipped in the South and Northeast.

    Market fundamentals should be pointing to better results for new home sales: there’s plenty of homes on the market, prices are soft, employment is strong, and mortgage rates have come down sharply. Yet today’s report is consistent with anecdotal reports that foreign buyers, due to trade tensions, have been scaling back US home buying. In any case, these results do fit in with arguments for a rate cut, a cut that would likely pull mortgage rates even lower in what couldn’t but help housing.


    US industry continues its deceleration into contraction, like most of the rest of the world:

    US Factory Activity Stalls in July

    The IHS Markit US Manufacturing PMI fell to 50.0 in July 2019, the lowest since September 2009 and below market expectations of 51.0, a preliminary estimate showed. Output contracted the most since August 2009 and new work from abroad declined at the fastest pace since April 2016 while employment dropped for the first time in six years.

    ***President Donald Trump asked teenagers at the Turning Point USA conference Tuesday to “imagine” a world without “fake news” media in which he would have “100 percent” approval ratings.

    Mtg purchase apps, New home sales, US and euro area PMI’s, Trump quote

    Lower rates don’t seem to be helping:

    Highlights

    The purchase index continues to pull back in what is an unfavorable indication for underlying home sales. After falling 4.0 percent in the prior week, the index fell 2.0 percent in the July 19 week to pull down year-on-year growth to 6.0 percent. Refinancing activity has also been coming down, 2.0 percent lower in the week. Rates fell back in the week, down 4 basis points to 4.08 percent for conventional 30-year loans.

    Still rolling over from what are already historically depressed levels, with tariffs now widely mentioned:

    Highlights

    The housing trend is visibly fading at the half-way point, opening the year on a solid rise before flattening out and slowing in May and June. This is true of existing home sales which were reported yesterday and is especially true with today’s report on new home sales which came in at a lower-than-expected 646,000 annual rate. The 3-month average is at 636,000 which compares unfavorably against a 673,000 peak in April.

    The median price firmed in June to $310,400 but is no better than dead flat versus June last year. Supply edged higher to 338,000 new homes on the market and on a sales basis is at an ample 6.3 months. Sales jumped in the West, edged higher in the South, and slipped in the South and Northeast.

    Market fundamentals should be pointing to better results for new home sales: there’s plenty of homes on the market, prices are soft, employment is strong, and mortgage rates have come down sharply. Yet today’s report is consistent with anecdotal reports that foreign buyers, due to trade tensions, have been scaling back US home buying. In any case, these results do fit in with arguments for a rate cut, a cut that would likely pull mortgage rates even lower in what couldn’t but help housing.


    US industry continues its deceleration into contraction, like most of the rest of the world:

    US Factory Activity Stalls in July

    The IHS Markit US Manufacturing PMI fell to 50.0 in July 2019, the lowest since September 2009 and below market expectations of 51.0, a preliminary estimate showed. Output contracted the most since August 2009 and new work from abroad declined at the fastest pace since April 2016 while employment dropped for the first time in six years.

    ***President Donald Trump asked teenagers at the Turning Point USA conference Tuesday to “imagine” a world without “fake news” media in which he would have “100 percent” approval ratings.

    Existing home sales, Richmond Fed, UK factory orders, Chemical Activity Barometer

    Worse than expected and in contraction year over year:

    Highlights

    The housing market firmed in the early Spring but has since flattened out. Existing home sales came in softer-than-expected at a 5.270 million annual rate in June which, however, is right in line with the 3-month average of 5.280 million. This average started the year at roughly 5.1 million.

    Single-family resales fell 1.5 percent in the month to a 4.690 million pace while condo sales, the second and much smaller component in the report, fell 3.3 percent to 580,000. By region, the Northeast and Midwest posted mid-single digit monthly gains with the South and West posting mid-single digit declines.

    For home sellers, the good news is centered in prices which rose a sharp 2.7 percent to a median $285,700. For buyers, the good news includes a 1.0 percent rise in supply on the market, at 1.930 million which nevertheless is dead flat on the year at zero.

    Sales year-on-year are in negative ground at minus 2.2 percent in what should be an easy comparison against a weak 2018. Resales have only a limited impact on residential investment in contrast to new home sales which will be posted tomorrow. But if trends hold, even flat results for new home sales, given firmness early in the quarter, could still make for the first positive residential contribution, however modest, to GDP since 2017.

    Lack of momentum in housing, which is unexpected this year given the strength of the jobs market and the fall in mortgage rates, will be one factor that doves can cite at next week’s FOMC meeting in favor a rate cut. Watch Friday for the first estimate of second-quarter GDP.


    Bad:

    Highlights

    Fifth District manufacturing activity unexpectedly fell into contraction in July, according to the latest survey from the Richmond Fed, whose composite index fell 14 points from June’s revised reading of 2 to minus 12, its lowest level since January 2013. Coming in sharply below the range of analysts’ forecasts calling for a modest uptick in growth, the slowdown was driven by declines in in all three major components of the index, with shipments down 18 points to minus 13, new orders down 16 to minus 18, and the number of employees down 7 points to minus 3, the lowest level in more than three years.

    Weakness was registered in nearly all components, with some posting double digit declines. Backlog of orders fell 29 points to minus 26, the lowest level since April 2009, while capacity utilization fell 20 points to minus 24. Companies reported worsening local business conditions, with the index plunging 25 points to minus 18, the largest monthly drop on record.

    The one bright spot in an otherwise gloomy report were expectations over the next six months, as companies on balance saw improvement in most major components. Here, expected shipments were up 9 points 32 and expected new orders were up 9 points to 36, while expected local business conditions were up 14 points to 25.

    On the inflation front, companies said both prices paid and prices received grew at a significantly faster pace in July, though input price growth continued to outpace growth of output prices. Survey participants expected growth of both prices paid and prices received to slow in the near future.

    The surprising weakness of today’s report contrasts with the Philly Fed and Empire State regional reports last week showing manufacturing rebounding in these regions. Despite the reported increase in input and output prices, the marked deterioration in the region’s manufacturing survey to the lowest level in six years is likely to bolster the dovish case for cutting the Fed funds rate at the FOMC meeting next week.


    Not at all good- 3mo average now negative year over year:

    Chemical Activity Barometer Fell in July

    Housing starts, Architecture index, Foreign home buyers

    Rolled over and on the decline and from highs that were at historically depressed levels:


    Now in contraction:

    From the AIA: Design services demand stalled in June, Project inquiry gains hit a 10-year low

    Demand for design services at architecture firms decreased in June in comparison to the previous month, according to a new report today from The American Institute of Architects (AIA).

    AIA’s Architecture Billings Index (ABI) score for June was 49.1, which is down from 50.2 in May. Any score below 50 indicates a decrease in billings. Both the project inquiries index and the design contracts index continued to soften in June but remained positive.

    Read more at https://www.calculatedriskblog.com/#YGy8qvAMEyXj5cSq.99

    Foreign purchases of American homes plunge 36% as Chinese buyers flee the market